Zip Codes with the Highest Percentage of Population Employed in Arts, Entertainment & Recreation in Brownsville, TX
RELATED REPORTS & OPTIONS
Arts, Entertainment & Recreation
Brownsville
Compare Zip Codes
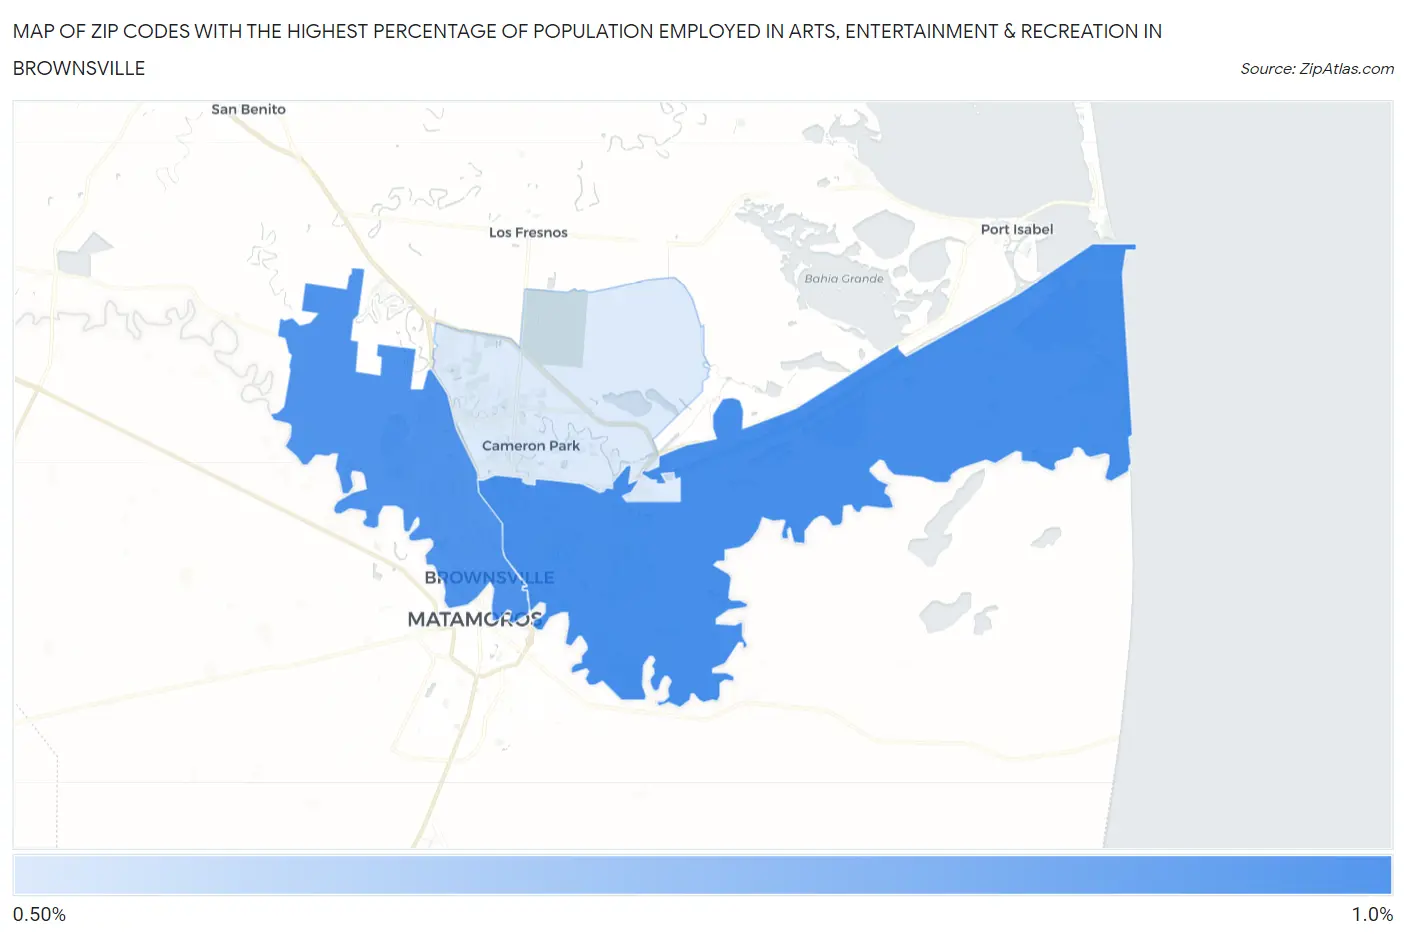
Map of Zip Codes with the Highest Percentage of Population Employed in Arts, Entertainment & Recreation in Brownsville
0.56%
0.94%
Zip Codes with the Highest Percentage of Population Employed in Arts, Entertainment & Recreation in Brownsville, TX
| Zip Code | % Employed | vs State | vs National | |
| 1. | 78521 | 0.94% | 1.5%(-0.521)#851 | 2.1%(-1.14)#17,380 |
| 2. | 78520 | 0.92% | 1.5%(-0.544)#865 | 2.1%(-1.16)#17,551 |
| 3. | 78526 | 0.56% | 1.5%(-0.904)#1,051 | 2.1%(-1.52)#20,122 |
1
Common Questions
What are the Top Zip Codes with the Highest Percentage of Population Employed in Arts, Entertainment & Recreation in Brownsville, TX?
Top Zip Codes with the Highest Percentage of Population Employed in Arts, Entertainment & Recreation in Brownsville, TX are:
What zip code has the Highest Percentage of Population Employed in Arts, Entertainment & Recreation in Brownsville, TX?
78521 has the Highest Percentage of Population Employed in Arts, Entertainment & Recreation in Brownsville, TX with 0.94%.
What is the Percentage of Population Employed in Arts, Entertainment & Recreation in Brownsville, TX?
Percentage of Population Employed in Arts, Entertainment & Recreation in Brownsville is 0.89%.
What is the Percentage of Population Employed in Arts, Entertainment & Recreation in Texas?
Percentage of Population Employed in Arts, Entertainment & Recreation in Texas is 1.5%.
What is the Percentage of Population Employed in Arts, Entertainment & Recreation in the United States?
Percentage of Population Employed in Arts, Entertainment & Recreation in the United States is 2.1%.