Zip Codes with the Highest Percentage of Population with a Degree in Arts and Humanities in Seneca, SC
RELATED REPORTS & OPTIONS
Arts and Humanities
Seneca
Compare Zip Codes
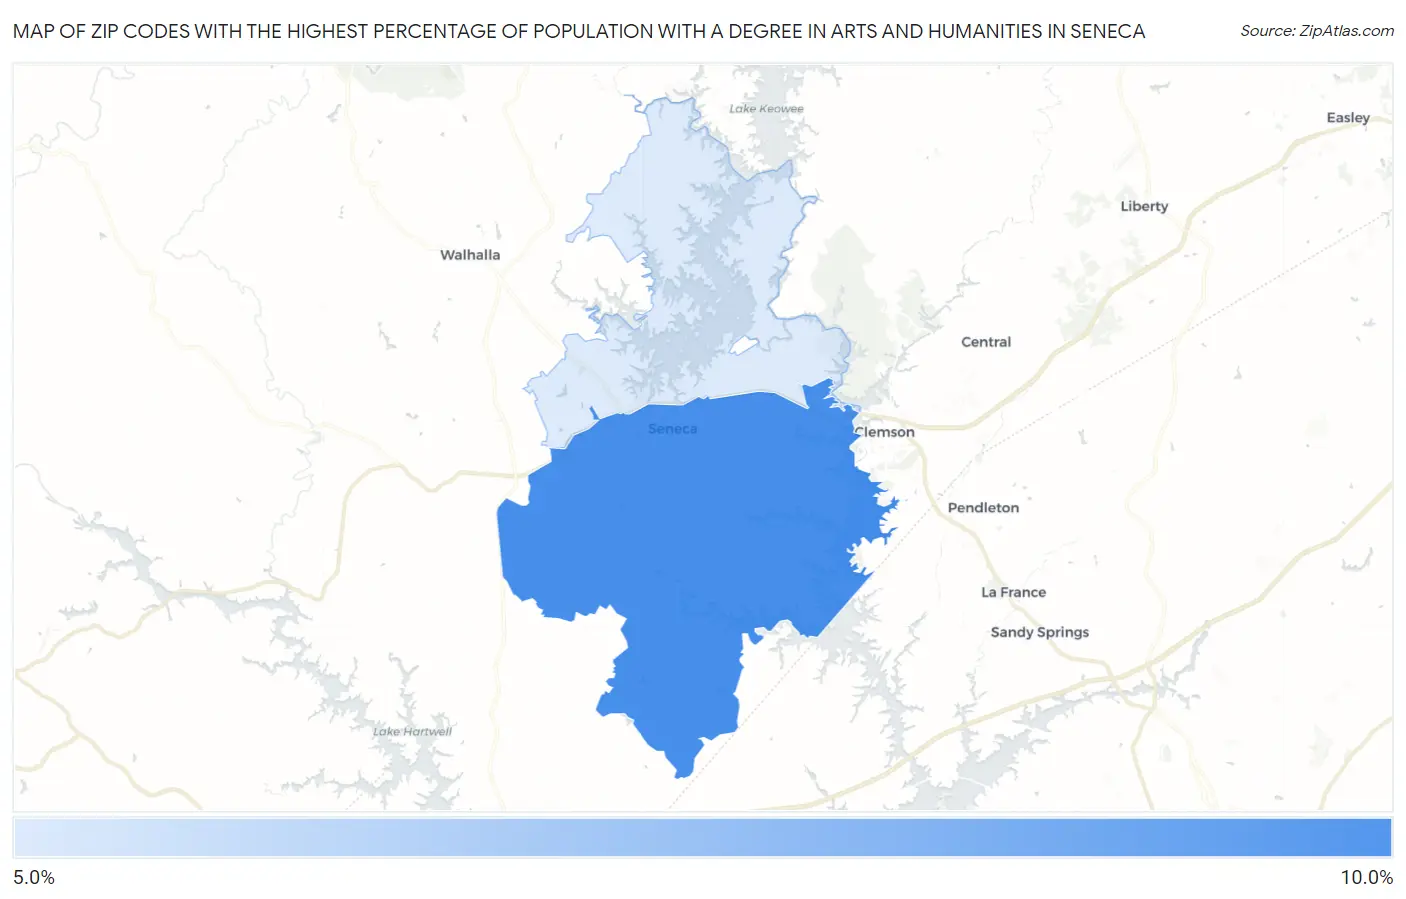
Map of Zip Codes with the Highest Percentage of Population with a Degree in Arts and Humanities in Seneca
5.3%
8.8%
Zip Codes with the Highest Percentage of Population with a Degree in Arts and Humanities in Seneca, SC
| Zip Code | % Graduates | vs State | vs National | |
| 1. | 29678 | 8.8% | 6.1%(+2.66)#81 | 6.0%(+2.80)#8,090 |
| 2. | 29672 | 5.3% | 6.1%(-0.806)#189 | 6.0%(-0.666)#16,632 |
1
Common Questions
What are the Top Zip Codes with the Highest Percentage of Population with a Degree in Arts and Humanities in Seneca, SC?
Top Zip Codes with the Highest Percentage of Population with a Degree in Arts and Humanities in Seneca, SC are:
What zip code has the Highest Percentage of Population with a Degree in Arts and Humanities in Seneca, SC?
29678 has the Highest Percentage of Population with a Degree in Arts and Humanities in Seneca, SC with 8.8%.
What is the Percentage of Population with a Degree in Arts and Humanities in Seneca, SC?
Percentage of Population with a Degree in Arts and Humanities in Seneca is 10.3%.
What is the Percentage of Population with a Degree in Arts and Humanities in South Carolina?
Percentage of Population with a Degree in Arts and Humanities in South Carolina is 6.1%.
What is the Percentage of Population with a Degree in Arts and Humanities in the United States?
Percentage of Population with a Degree in Arts and Humanities in the United States is 6.0%.