Zip Codes with the Highest Percentage of Population Employed in Professional & Scientific Services in Seneca, SC
RELATED REPORTS & OPTIONS
Professional & Scientific Services
Seneca
Compare Zip Codes
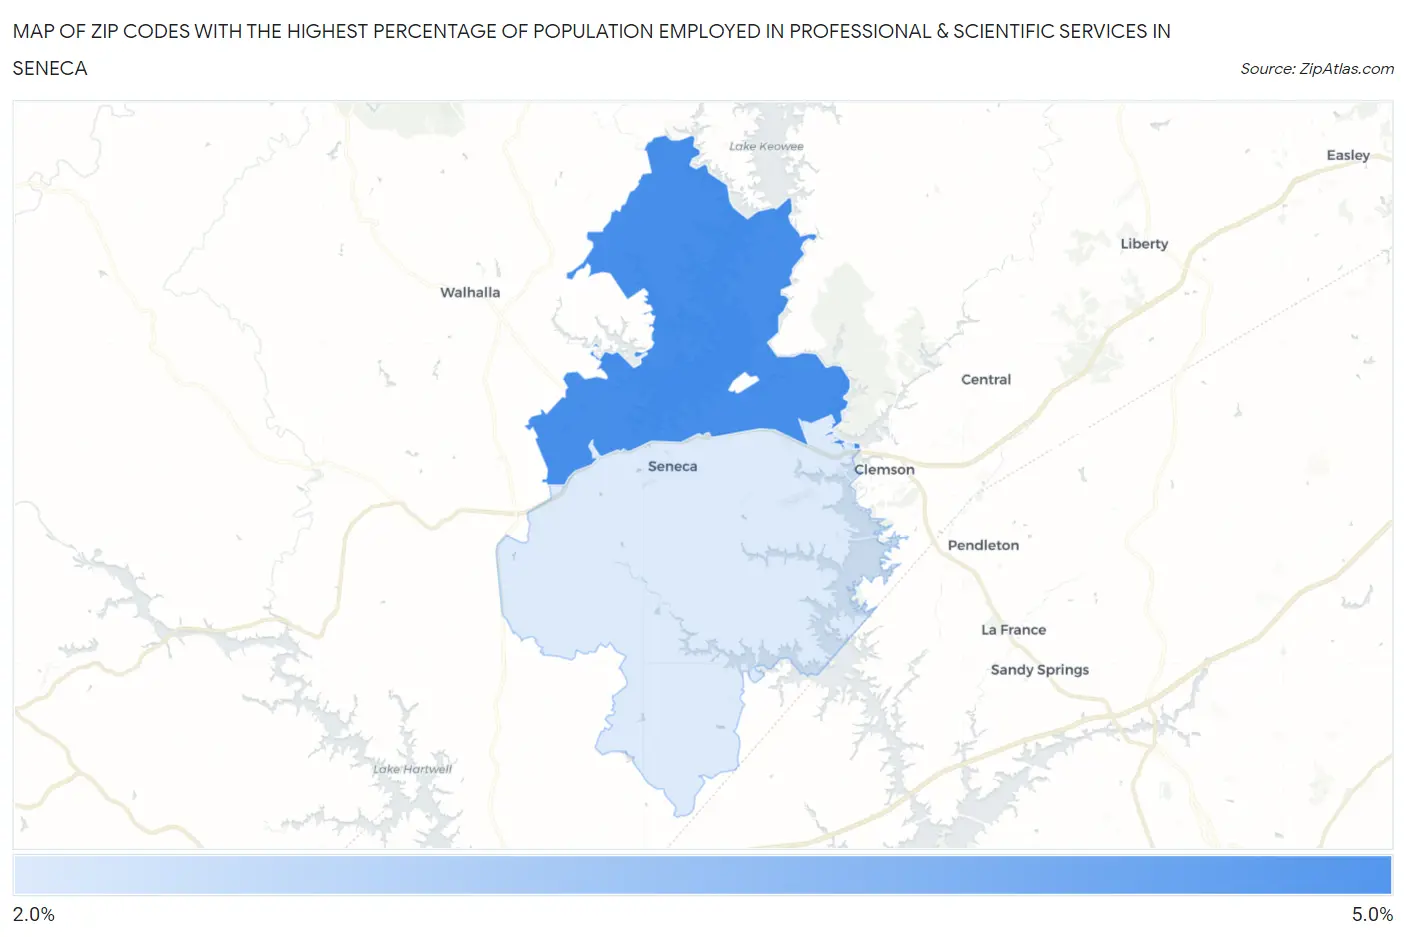
Map of Zip Codes with the Highest Percentage of Population Employed in Professional & Scientific Services in Seneca
2.9%
4.2%
Zip Codes with the Highest Percentage of Population Employed in Professional & Scientific Services in Seneca, SC
| Zip Code | % Employed | vs State | vs National | |
| 1. | 29672 | 4.2% | 6.0%(-1.80)#154 | 7.8%(-3.67)#14,598 |
| 2. | 29678 | 2.9% | 6.0%(-3.12)#223 | 7.8%(-4.99)#18,968 |
1
Common Questions
What are the Top Zip Codes with the Highest Percentage of Population Employed in Professional & Scientific Services in Seneca, SC?
Top Zip Codes with the Highest Percentage of Population Employed in Professional & Scientific Services in Seneca, SC are:
What zip code has the Highest Percentage of Population Employed in Professional & Scientific Services in Seneca, SC?
29672 has the Highest Percentage of Population Employed in Professional & Scientific Services in Seneca, SC with 4.2%.
What is the Percentage of Population Employed in Professional & Scientific Services in Seneca, SC?
Percentage of Population Employed in Professional & Scientific Services in Seneca is 1.5%.
What is the Percentage of Population Employed in Professional & Scientific Services in South Carolina?
Percentage of Population Employed in Professional & Scientific Services in South Carolina is 6.0%.
What is the Percentage of Population Employed in Professional & Scientific Services in the United States?
Percentage of Population Employed in Professional & Scientific Services in the United States is 7.8%.