Zip Codes with the Highest Percentage of Population with a Degree in Literature and Languages in Seneca, SC
RELATED REPORTS & OPTIONS
Literature and Languages
Seneca
Compare Zip Codes
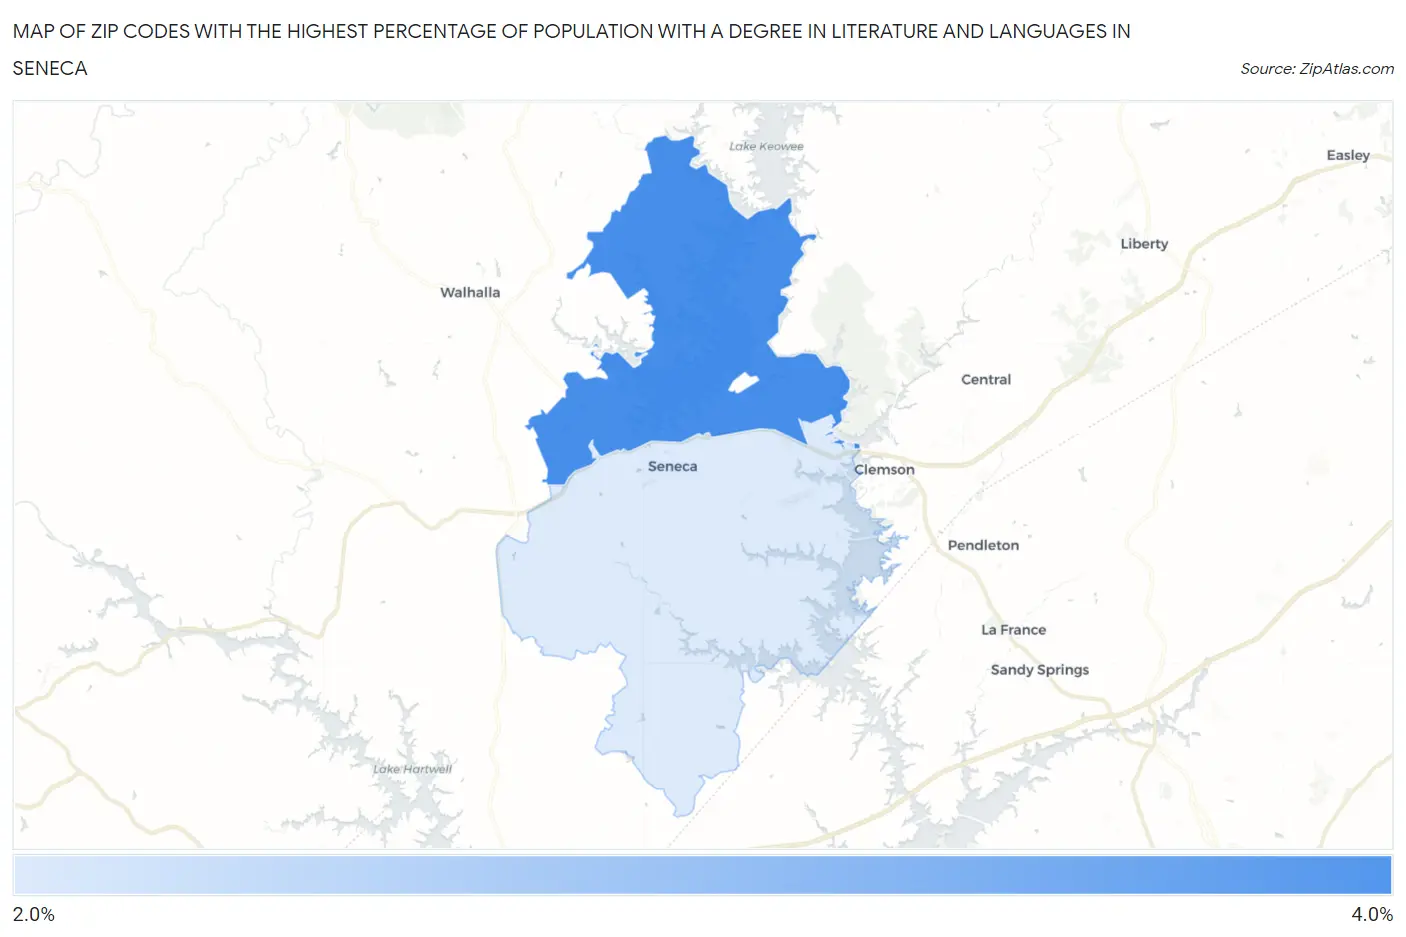
Map of Zip Codes with the Highest Percentage of Population with a Degree in Literature and Languages in Seneca
2.5%
3.9%
Zip Codes with the Highest Percentage of Population with a Degree in Literature and Languages in Seneca, SC
| Zip Code | % Graduates | vs State | vs National | |
| 1. | 29672 | 3.9% | 3.7%(+0.174)#112 | 4.4%(-0.500)#10,455 |
| 2. | 29678 | 2.5% | 3.7%(-1.19)#192 | 4.4%(-1.86)#15,130 |
1
Common Questions
What are the Top Zip Codes with the Highest Percentage of Population with a Degree in Literature and Languages in Seneca, SC?
Top Zip Codes with the Highest Percentage of Population with a Degree in Literature and Languages in Seneca, SC are:
What zip code has the Highest Percentage of Population with a Degree in Literature and Languages in Seneca, SC?
29672 has the Highest Percentage of Population with a Degree in Literature and Languages in Seneca, SC with 3.9%.
What is the Percentage of Population with a Degree in Literature and Languages in Seneca, SC?
Percentage of Population with a Degree in Literature and Languages in Seneca is 0.62%.
What is the Percentage of Population with a Degree in Literature and Languages in South Carolina?
Percentage of Population with a Degree in Literature and Languages in South Carolina is 3.7%.
What is the Percentage of Population with a Degree in Literature and Languages in the United States?
Percentage of Population with a Degree in Literature and Languages in the United States is 4.4%.