Zip Codes with the Highest Percentage of Population Employed in Sales & Related in Hazleton, PA
RELATED REPORTS & OPTIONS
Sales & Related
Hazleton
Compare Zip Codes
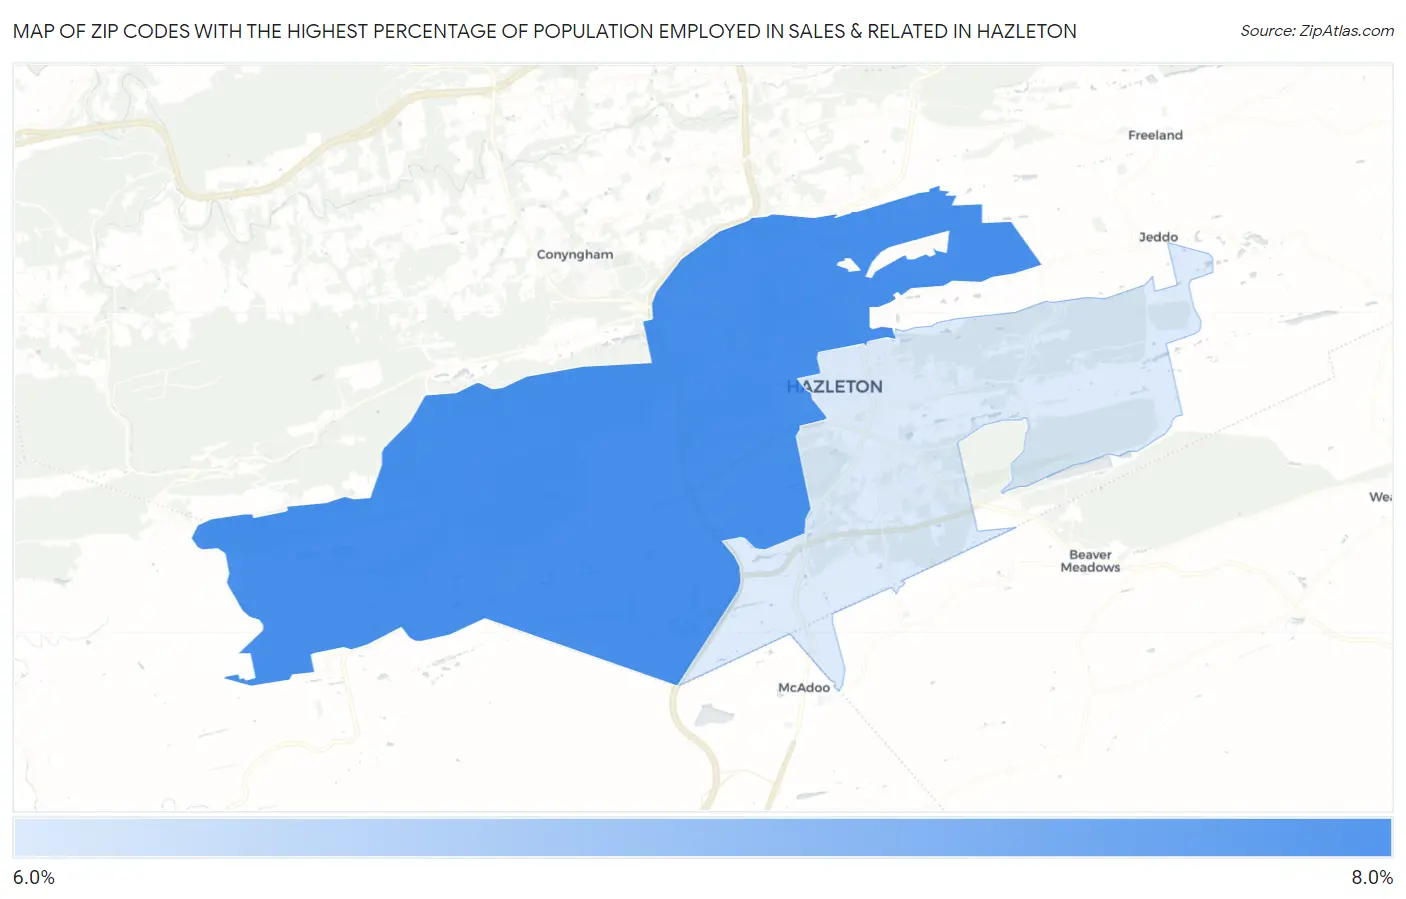
Map of Zip Codes with the Highest Percentage of Population Employed in Sales & Related in Hazleton
6.9%
8.0%
Zip Codes with the Highest Percentage of Population Employed in Sales & Related in Hazleton, PA
| Zip Code | % Employed | vs State | vs National | |
| 1. | 18202 | 8.0% | 9.1%(-1.17)#942 | 9.6%(-1.63)#18,145 |
| 2. | 18201 | 6.9% | 9.1%(-2.26)#1,143 | 9.6%(-2.72)#21,531 |
1
Common Questions
What are the Top Zip Codes with the Highest Percentage of Population Employed in Sales & Related in Hazleton, PA?
Top Zip Codes with the Highest Percentage of Population Employed in Sales & Related in Hazleton, PA are:
What zip code has the Highest Percentage of Population Employed in Sales & Related in Hazleton, PA?
18202 has the Highest Percentage of Population Employed in Sales & Related in Hazleton, PA with 8.0%.
What is the Percentage of Population Employed in Sales & Related in Hazleton, PA?
Percentage of Population Employed in Sales & Related in Hazleton is 6.6%.
What is the Percentage of Population Employed in Sales & Related in Pennsylvania?
Percentage of Population Employed in Sales & Related in Pennsylvania is 9.1%.
What is the Percentage of Population Employed in Sales & Related in the United States?
Percentage of Population Employed in Sales & Related in the United States is 9.6%.