Zip Codes with the Highest Percentage of Households Without a Vehicle in Canton, OH
RELATED REPORTS & OPTIONS
Households without a Cars
Canton
Compare Zip Codes
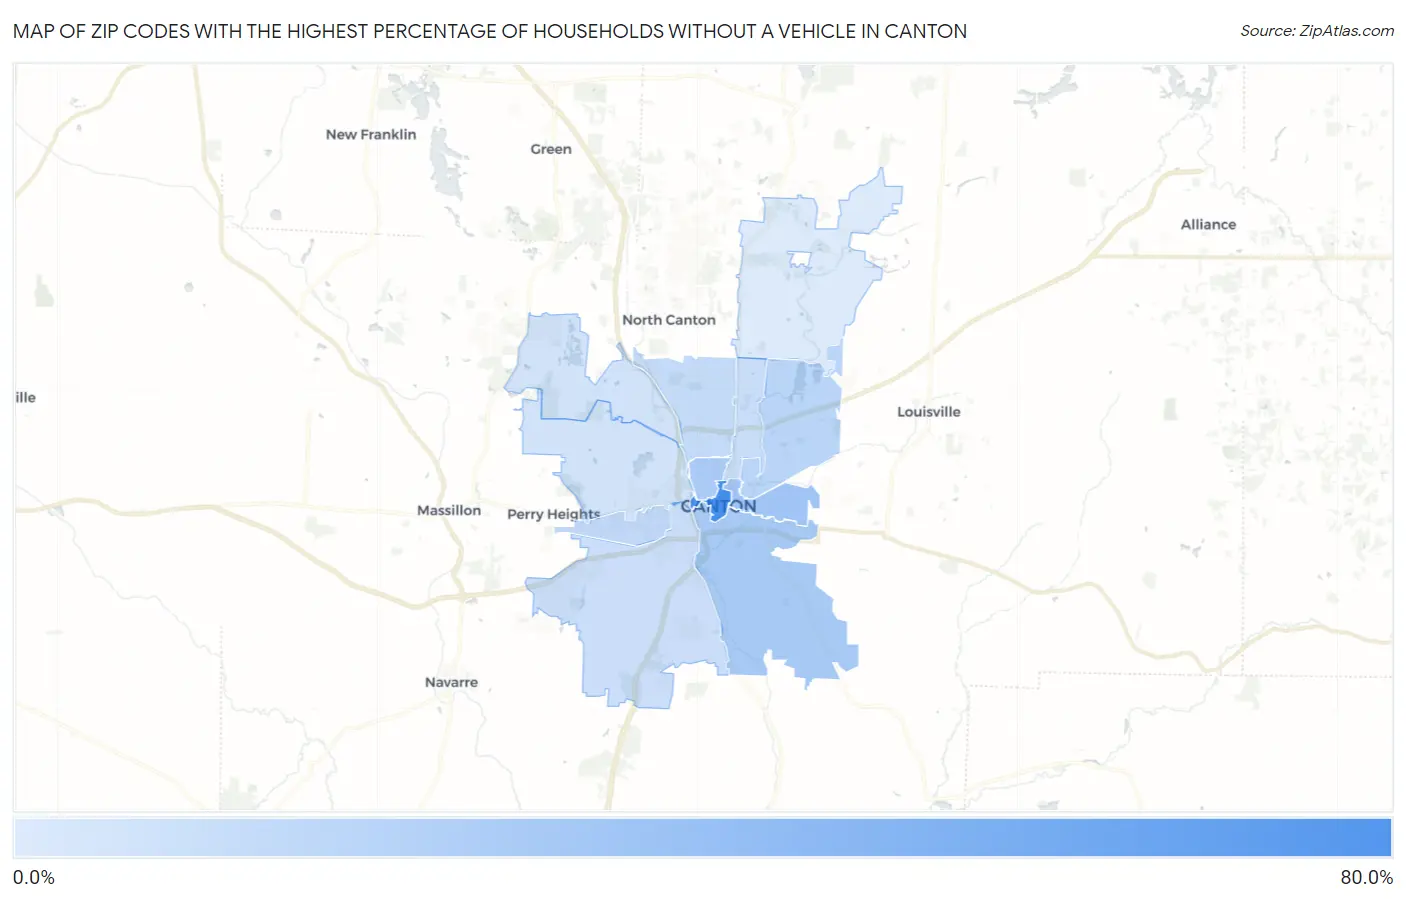
Map of Zip Codes with the Highest Percentage of Households Without a Vehicle in Canton
1.2%
63.3%
Zip Codes with the Highest Percentage of Households Without a Vehicle in Canton, OH
| Zip Code | Housholds Without a Car | vs State | vs National | |
| 1. | 44702 | 63.3% | 7.4%(+55.9)#3 | 8.3%(+55.0)#247 |
| 2. | 44704 | 22.2% | 7.4%(+14.8)#56 | 8.3%(+13.9)#1,287 |
| 3. | 44707 | 20.1% | 7.4%(+12.7)#63 | 8.3%(+11.8)#1,490 |
| 4. | 44703 | 19.0% | 7.4%(+11.6)#74 | 8.3%(+10.7)#1,629 |
| 5. | 44705 | 13.3% | 7.4%(+5.90)#140 | 8.3%(+5.00)#2,970 |
| 6. | 44710 | 10.4% | 7.4%(+3.00)#203 | 8.3%(+2.10)#4,553 |
| 7. | 44709 | 9.8% | 7.4%(+2.40)#226 | 8.3%(+1.50)#5,028 |
| 8. | 44714 | 7.9% | 7.4%(+0.500)#302 | 8.3%(-0.400)#7,137 |
| 9. | 44706 | 7.2% | 7.4%(-0.200)#336 | 8.3%(-1.10)#8,237 |
| 10. | 44718 | 5.2% | 7.4%(-2.20)#489 | 8.3%(-3.10)#12,400 |
| 11. | 44708 | 4.9% | 7.4%(-2.50)#514 | 8.3%(-3.40)#13,124 |
| 12. | 44721 | 1.2% | 7.4%(-6.20)#953 | 8.3%(-7.10)#25,081 |
1
Common Questions
What are the Top 10 Zip Codes with the Highest Percentage of Households Without a Vehicle in Canton, OH?
Top 10 Zip Codes with the Highest Percentage of Households Without a Vehicle in Canton, OH are:
What zip code has the Highest Percentage of Households Without a Vehicle in Canton, OH?
44702 has the Highest Percentage of Households Without a Vehicle in Canton, OH with 63.3%.
What is the Percentage of Households Without a Vehicle in Canton, OH?
Percentage of Households Without a Vehicle in Canton is 15.2%.
What is the Percentage of Households Without a Vehicle in Ohio?
Percentage of Households Without a Vehicle in Ohio is 7.4%.
What is the Percentage of Households Without a Vehicle in the United States?
Percentage of Households Without a Vehicle in the United States is 8.3%.