Zip Codes with the Highest Percentage of Population with a Degree in Visual and Performing Arts in Canton, OH
RELATED REPORTS & OPTIONS
Visual and Performing Arts
Canton
Compare Zip Codes
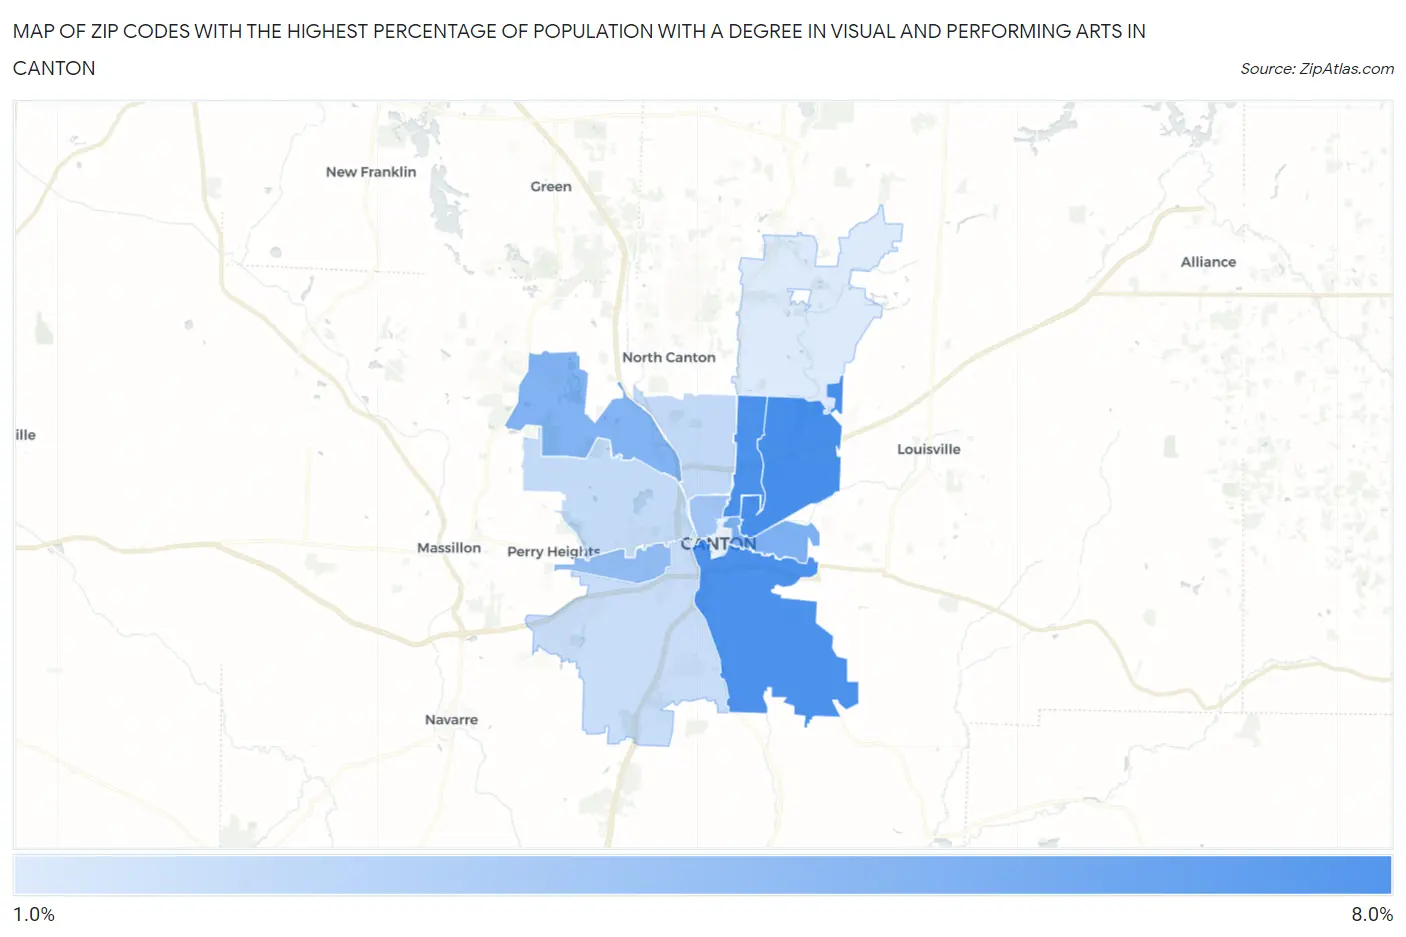
Map of Zip Codes with the Highest Percentage of Population with a Degree in Visual and Performing Arts in Canton
1.7%
7.0%
Zip Codes with the Highest Percentage of Population with a Degree in Visual and Performing Arts in Canton, OH
| Zip Code | % Graduates | vs State | vs National | |
| 1. | 44705 | 7.0% | 3.7%(+3.27)#135 | 4.3%(+2.73)#3,680 |
| 2. | 44707 | 6.8% | 3.7%(+3.11)#142 | 4.3%(+2.57)#3,850 |
| 3. | 44714 | 6.8% | 3.7%(+3.10)#143 | 4.3%(+2.56)#3,872 |
| 4. | 44704 | 5.1% | 3.7%(+1.37)#228 | 4.3%(+0.833)#6,445 |
| 5. | 44718 | 4.9% | 3.7%(+1.17)#244 | 4.3%(+0.633)#6,887 |
| 6. | 44710 | 4.3% | 3.7%(+0.621)#300 | 4.3%(+0.080)#8,261 |
| 7. | 44703 | 3.7% | 3.7%(+0.036)#358 | 4.3%(-0.505)#10,010 |
| 8. | 44709 | 2.7% | 3.7%(-1.01)#500 | 4.3%(-1.55)#13,907 |
| 9. | 44708 | 2.6% | 3.7%(-1.10)#514 | 4.3%(-1.64)#14,233 |
| 10. | 44706 | 2.4% | 3.7%(-1.32)#537 | 4.3%(-1.86)#15,017 |
| 11. | 44721 | 1.7% | 3.7%(-2.00)#644 | 4.3%(-2.54)#17,463 |
1
Common Questions
What are the Top 10 Zip Codes with the Highest Percentage of Population with a Degree in Visual and Performing Arts in Canton, OH?
Top 10 Zip Codes with the Highest Percentage of Population with a Degree in Visual and Performing Arts in Canton, OH are:
What zip code has the Highest Percentage of Population with a Degree in Visual and Performing Arts in Canton, OH?
44705 has the Highest Percentage of Population with a Degree in Visual and Performing Arts in Canton, OH with 7.0%.
What is the Percentage of Population with a Degree in Visual and Performing Arts in Canton, OH?
Percentage of Population with a Degree in Visual and Performing Arts in Canton is 4.3%.
What is the Percentage of Population with a Degree in Visual and Performing Arts in Ohio?
Percentage of Population with a Degree in Visual and Performing Arts in Ohio is 3.7%.
What is the Percentage of Population with a Degree in Visual and Performing Arts in the United States?
Percentage of Population with a Degree in Visual and Performing Arts in the United States is 4.3%.