Zip Codes with the Highest Percentage of Population Employed in Architecture & Engineering in High Point, NC
RELATED REPORTS & OPTIONS
Architecture & Engineering
High Point
Compare Zip Codes
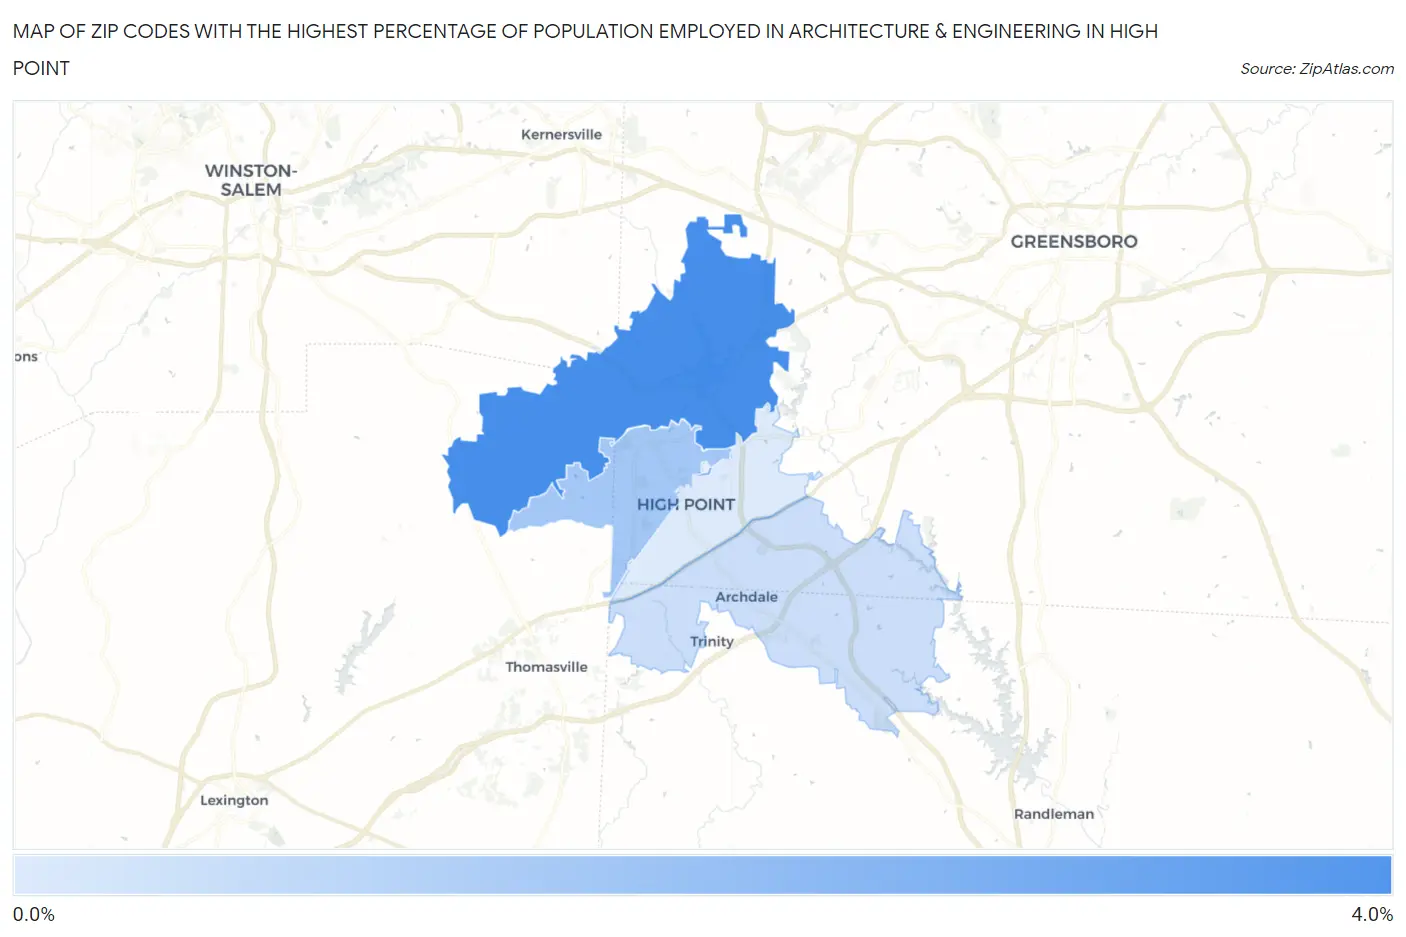
Map of Zip Codes with the Highest Percentage of Population Employed in Architecture & Engineering in High Point
0.64%
3.2%
Zip Codes with the Highest Percentage of Population Employed in Architecture & Engineering in High Point, NC
| Zip Code | % Employed | vs State | vs National | |
| 1. | 27265 | 3.2% | 1.9%(+1.34)#78 | 2.1%(+1.08)#4,392 |
| 2. | 27262 | 1.6% | 1.9%(-0.253)#278 | 2.1%(-0.514)#11,941 |
| 3. | 27263 | 0.93% | 1.9%(-0.956)#435 | 2.1%(-1.22)#17,106 |
| 4. | 27260 | 0.64% | 1.9%(-1.25)#498 | 2.1%(-1.51)#19,351 |
1
Common Questions
What are the Top 3 Zip Codes with the Highest Percentage of Population Employed in Architecture & Engineering in High Point, NC?
Top 3 Zip Codes with the Highest Percentage of Population Employed in Architecture & Engineering in High Point, NC are:
What zip code has the Highest Percentage of Population Employed in Architecture & Engineering in High Point, NC?
27265 has the Highest Percentage of Population Employed in Architecture & Engineering in High Point, NC with 3.2%.
What is the Percentage of Population Employed in Architecture & Engineering in High Point, NC?
Percentage of Population Employed in Architecture & Engineering in High Point is 2.4%.
What is the Percentage of Population Employed in Architecture & Engineering in North Carolina?
Percentage of Population Employed in Architecture & Engineering in North Carolina is 1.9%.
What is the Percentage of Population Employed in Architecture & Engineering in the United States?
Percentage of Population Employed in Architecture & Engineering in the United States is 2.1%.