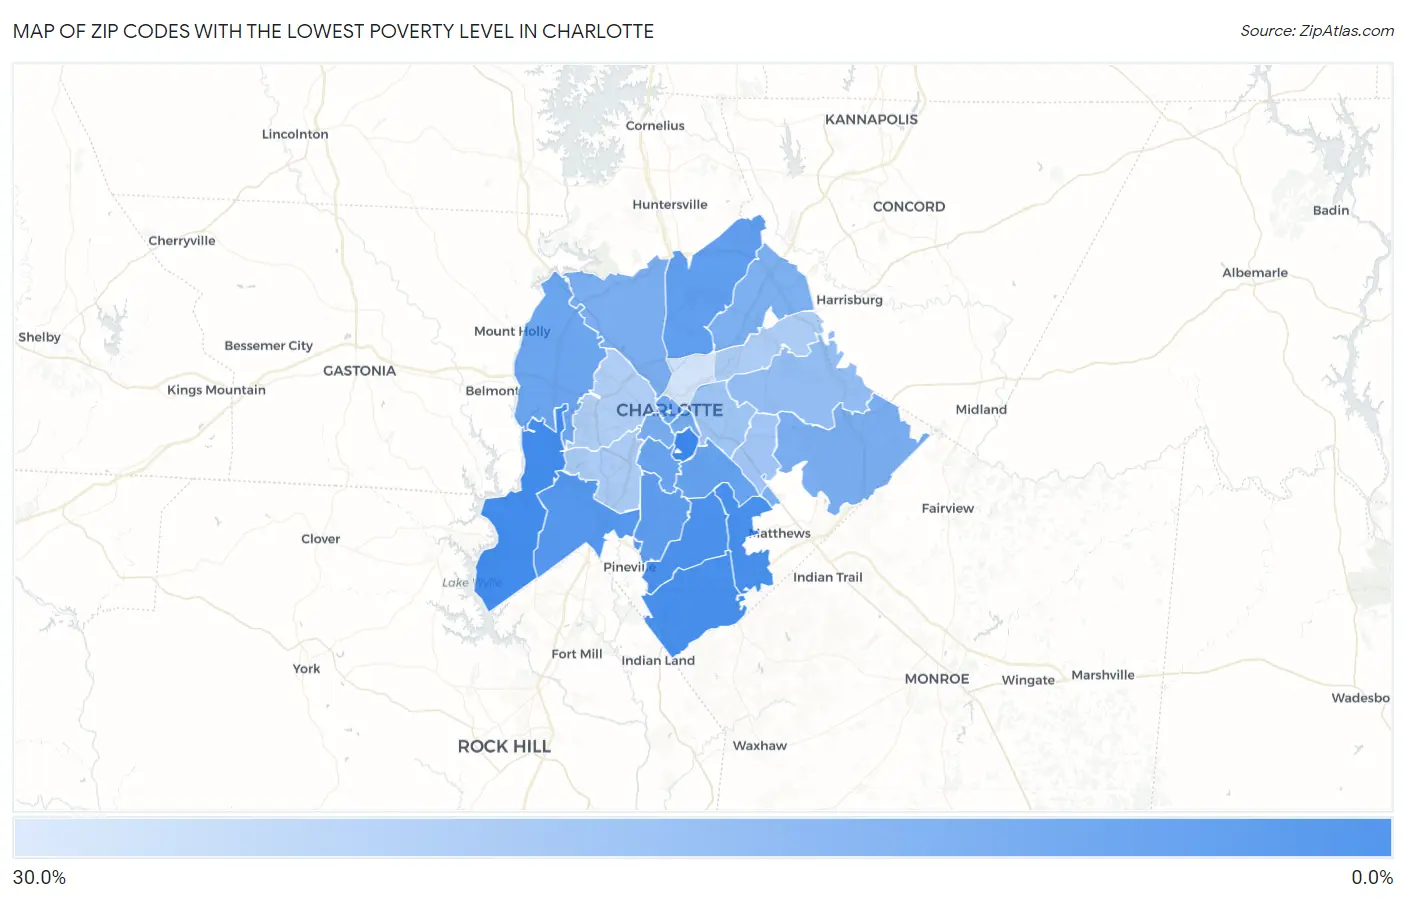
Zip Codes with the Lowest Poverty Level in Charlotte, NC
RELATED REPORTS & OPTIONS
Lowest Poverty
Charlotte
Compare Zip Codes
Map of Zip Codes with the Lowest Poverty Level in Charlotte
26.2%
2.6%
Zip Codes with the Lowest Poverty Level in Charlotte, NC
| Zip Code | Poverty | vs State | vs National | |
| 1. | 28207 | 2.6% | 13.3%(-10.7)#19 | 12.5%(-9.93)#1,360 |
| 2. | 28278 | 3.8% | 13.3%(-9.57)#40 | 12.5%(-8.78)#2,855 |
| 3. | 28277 | 4.2% | 13.3%(-9.14)#51 | 12.5%(-8.35)#3,483 |
| 4. | 28270 | 4.3% | 13.3%(-9.00)#56 | 12.5%(-8.21)#3,707 |
| 5. | 28226 | 5.1% | 13.3%(-8.25)#79 | 12.5%(-7.46)#4,962 |
| 6. | 28273 | 6.3% | 13.3%(-7.03)#114 | 12.5%(-6.24)#7,054 |
| 7. | 28210 | 7.7% | 13.3%(-5.65)#155 | 12.5%(-4.86)#9,599 |
| 8. | 28269 | 8.1% | 13.3%(-5.20)#168 | 12.5%(-4.40)#10,442 |
| 9. | 28211 | 8.7% | 13.3%(-4.61)#196 | 12.5%(-3.82)#11,521 |
| 10. | 28209 | 9.3% | 13.3%(-4.05)#216 | 12.5%(-3.26)#12,509 |
| 11. | 28214 | 9.6% | 13.3%(-3.75)#228 | 12.5%(-2.96)#13,040 |
| 12. | 28202 | 10.8% | 13.3%(-2.50)#272 | 12.5%(-1.71)#15,080 |
| 13. | 28204 | 11.0% | 13.3%(-2.36)#281 | 12.5%(-1.56)#15,315 |
| 14. | 28203 | 11.5% | 13.3%(-1.78)#313 | 12.5%(-0.989)#16,217 |
| 15. | 28227 | 11.7% | 13.3%(-1.63)#325 | 12.5%(-0.837)#16,474 |
| 16. | 28216 | 11.8% | 13.3%(-1.53)#328 | 12.5%(-0.741)#16,612 |
| 17. | 28262 | 12.5% | 13.3%(-0.847)#358 | 12.5%(-0.055)#17,589 |
| 18. | 28215 | 15.6% | 13.3%(+2.30)#483 | 12.5%(+3.09)#21,427 |
| 19. | 28205 | 17.6% | 13.3%(+4.28)#542 | 12.5%(+5.07)#23,289 |
| 20. | 28212 | 17.9% | 13.3%(+4.57)#555 | 12.5%(+5.36)#23,559 |
| 21. | 28217 | 19.6% | 13.3%(+6.26)#601 | 12.5%(+7.05)#24,826 |
| 22. | 28213 | 20.1% | 13.3%(+6.76)#615 | 12.5%(+7.56)#25,158 |
| 23. | 28208 | 20.5% | 13.3%(+7.17)#620 | 12.5%(+7.96)#25,417 |
| 24. | 28206 | 26.2% | 13.3%(+12.9)#710 | 12.5%(+13.7)#27,912 |
1
Common Questions
What are the Top 10 Zip Codes with the Lowest Poverty Level in Charlotte, NC?
Top 10 Zip Codes with the Lowest Poverty Level in Charlotte, NC are:
What zip code has the Lowest Poverty Level in Charlotte, NC?
28207 has the Lowest Poverty Level in Charlotte, NC with 2.6%.
What is the Poverty Level in Charlotte, NC?
Poverty Level in Charlotte is 11.7%.
What is the Poverty Level in North Carolina?
Poverty Level in North Carolina is 13.3%.
What is the Poverty Level in the United States?
Poverty Level in the United States is 12.5%.