Zip Codes with the Highest Percentage of Population Employed in Farming, Fishing & Forestry in Brandon, MS
RELATED REPORTS & OPTIONS
Farming, Fishing & Forestry
Brandon
Compare Zip Codes
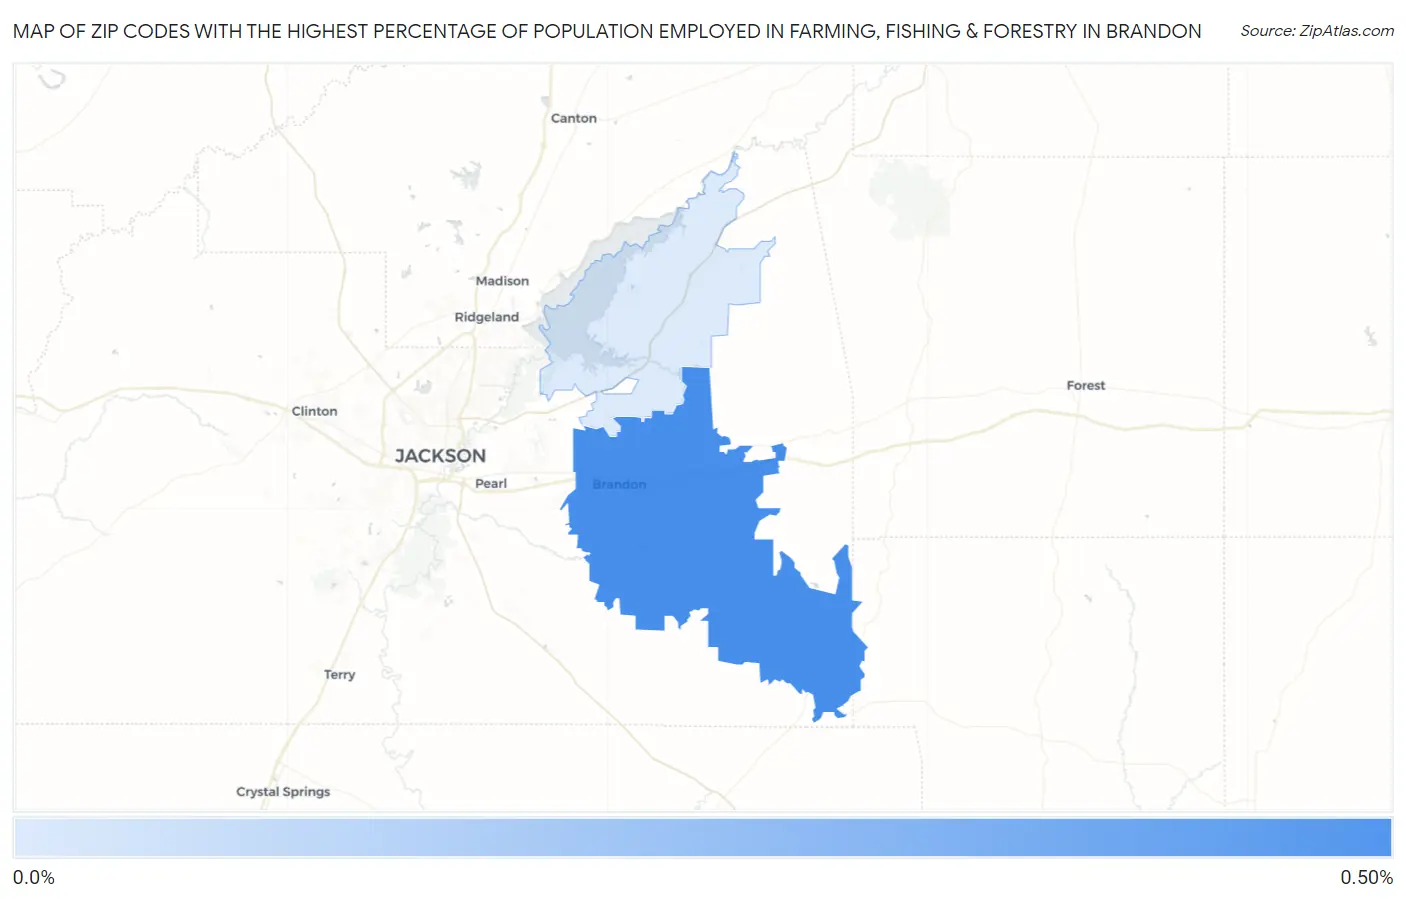
Map of Zip Codes with the Highest Percentage of Population Employed in Farming, Fishing & Forestry in Brandon
0.050%
0.42%
Zip Codes with the Highest Percentage of Population Employed in Farming, Fishing & Forestry in Brandon, MS
| Zip Code | % Employed | vs State | vs National | |
| 1. | 39042 | 0.42% | 0.63%(-0.214)#175 | 0.61%(-0.190)#13,624 |
| 2. | 39047 | 0.050% | 0.63%(-0.579)#211 | 0.61%(-0.556)#18,662 |
1
Common Questions
What are the Top Zip Codes with the Highest Percentage of Population Employed in Farming, Fishing & Forestry in Brandon, MS?
Top Zip Codes with the Highest Percentage of Population Employed in Farming, Fishing & Forestry in Brandon, MS are:
What zip code has the Highest Percentage of Population Employed in Farming, Fishing & Forestry in Brandon, MS?
39042 has the Highest Percentage of Population Employed in Farming, Fishing & Forestry in Brandon, MS with 0.42%.
What is the Percentage of Population Employed in Farming, Fishing & Forestry in Brandon, MS?
Percentage of Population Employed in Farming, Fishing & Forestry in Brandon is 0.41%.
What is the Percentage of Population Employed in Farming, Fishing & Forestry in Mississippi?
Percentage of Population Employed in Farming, Fishing & Forestry in Mississippi is 0.63%.
What is the Percentage of Population Employed in Farming, Fishing & Forestry in the United States?
Percentage of Population Employed in Farming, Fishing & Forestry in the United States is 0.61%.