Zip Codes with the Highest Percentage of Population Employed in Accommodation & Food Services in Brandon, MS
RELATED REPORTS & OPTIONS
Accommodation & Food Services
Brandon
Compare Zip Codes
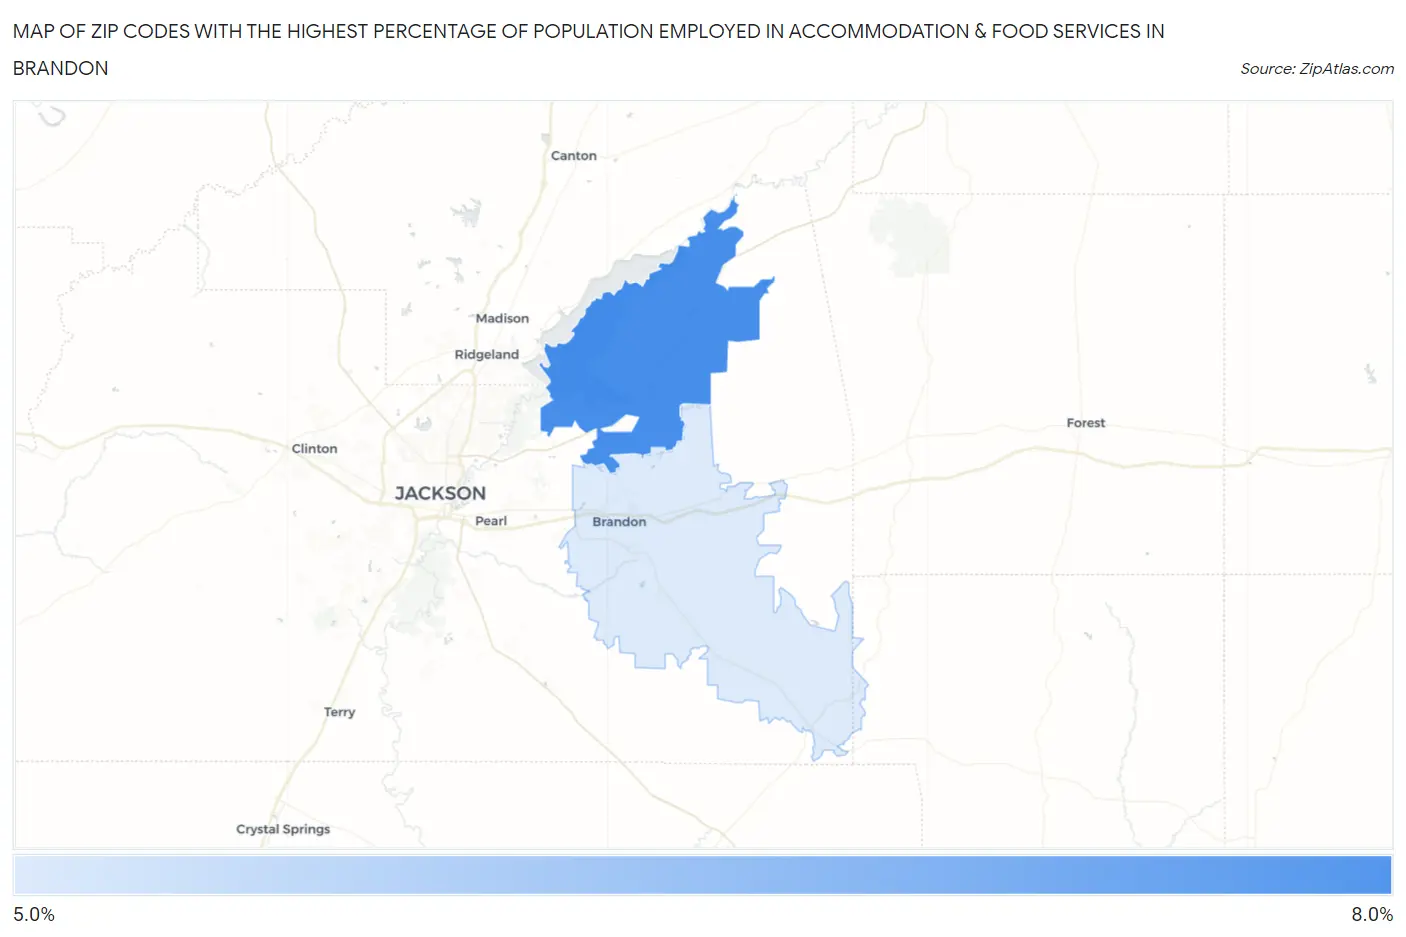
Map of Zip Codes with the Highest Percentage of Population Employed in Accommodation & Food Services in Brandon
5.1%
6.2%
Zip Codes with the Highest Percentage of Population Employed in Accommodation & Food Services in Brandon, MS
| Zip Code | % Employed | vs State | vs National | |
| 1. | 39047 | 6.2% | 6.9%(-0.707)#149 | 6.9%(-0.679)#12,790 |
| 2. | 39042 | 5.1% | 6.9%(-1.81)#199 | 6.9%(-1.78)#16,466 |
1
Common Questions
What are the Top Zip Codes with the Highest Percentage of Population Employed in Accommodation & Food Services in Brandon, MS?
Top Zip Codes with the Highest Percentage of Population Employed in Accommodation & Food Services in Brandon, MS are:
What zip code has the Highest Percentage of Population Employed in Accommodation & Food Services in Brandon, MS?
39047 has the Highest Percentage of Population Employed in Accommodation & Food Services in Brandon, MS with 6.2%.
What is the Percentage of Population Employed in Accommodation & Food Services in Brandon, MS?
Percentage of Population Employed in Accommodation & Food Services in Brandon is 3.6%.
What is the Percentage of Population Employed in Accommodation & Food Services in Mississippi?
Percentage of Population Employed in Accommodation & Food Services in Mississippi is 6.9%.
What is the Percentage of Population Employed in Accommodation & Food Services in the United States?
Percentage of Population Employed in Accommodation & Food Services in the United States is 6.9%.