Zip Codes with the Highest Percentage of Owner-Occupied Units in Brandon, MS
RELATED REPORTS & OPTIONS
Highest Owner-Occupied
Brandon
Compare Zip Codes
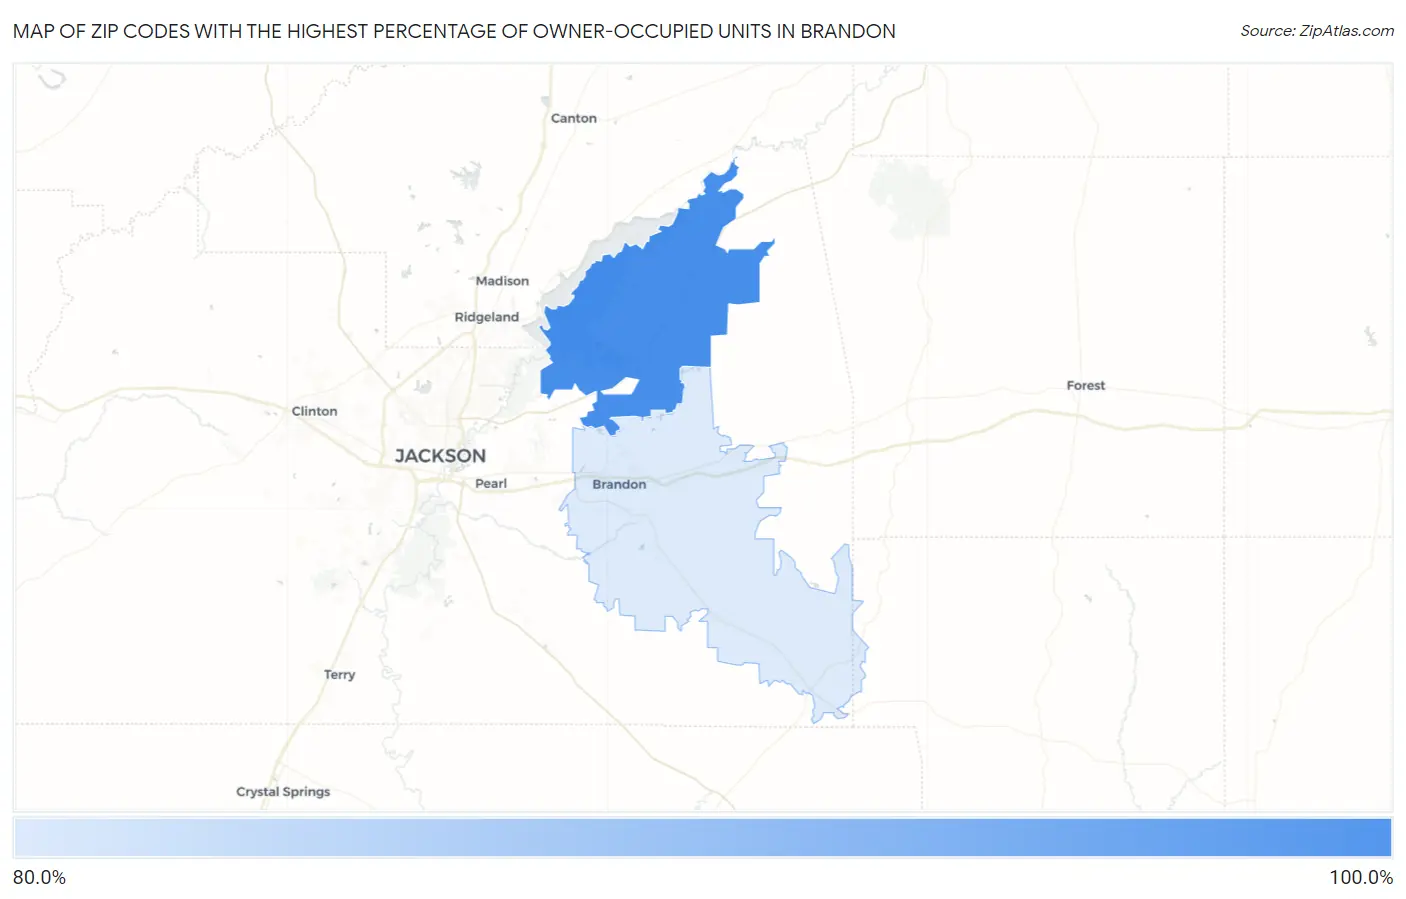
Map of Zip Codes with the Highest Percentage of Owner-Occupied Units in Brandon
83.3%
85.3%
Zip Codes with the Highest Percentage of Owner-Occupied Units in Brandon, MS
| Zip Code | % Owner-Occupied | vs State | vs National | |
| 1. | 39047 | 85.3% | 69.2%(+16.1)#98 | 64.8%(+20.4)#9,440 |
| 2. | 39042 | 83.3% | 69.2%(+14.2)#116 | 64.8%(+18.5)#11,362 |
1
Common Questions
What are the Top Zip Codes with the Highest Percentage of Owner-Occupied Units in Brandon, MS?
Top Zip Codes with the Highest Percentage of Owner-Occupied Units in Brandon, MS are:
What zip code has the Highest Percentage of Owner-Occupied Units in Brandon, MS?
39047 has the Highest Percentage of Owner-Occupied Units in Brandon, MS with 85.3%.
What is the Percentage of Owner-Occupied Units in Brandon, MS?
Percentage of Owner-Occupied Units in Brandon is 81.0%.
What is the Percentage of Owner-Occupied Units in Mississippi?
Percentage of Owner-Occupied Units in Mississippi is 69.2%.
What is the Percentage of Owner-Occupied Units in the United States?
Percentage of Owner-Occupied Units in the United States is 64.8%.