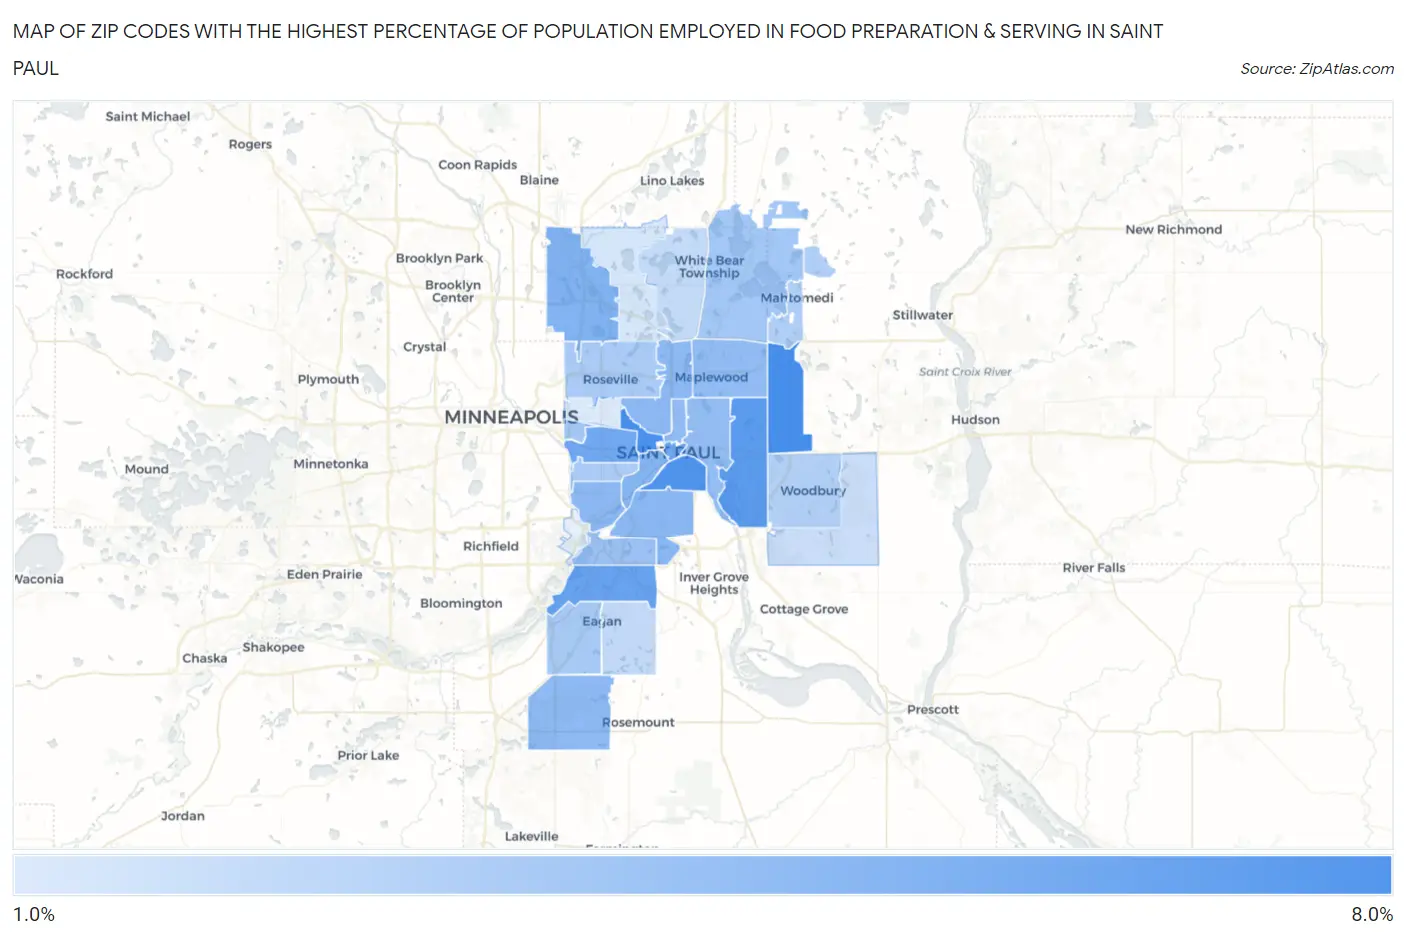
Zip Codes with the Highest Percentage of Population Employed in Food Preparation & Serving in Saint Paul, MN
RELATED REPORTS & OPTIONS
Food Preparation & Serving
Saint Paul
Compare Zip Codes
Map of Zip Codes with the Highest Percentage of Population Employed in Food Preparation & Serving in Saint Paul
1.9%
7.7%
Zip Codes with the Highest Percentage of Population Employed in Food Preparation & Serving in Saint Paul, MN
| Zip Code | % Employed | vs State | vs National | |
| 1. | 55128 | 7.7% | 4.7%(+2.92)#86 | 5.3%(+2.37)#5,292 |
| 2. | 55103 | 7.6% | 4.7%(+2.84)#89 | 5.3%(+2.29)#5,426 |
| 3. | 55107 | 7.3% | 4.7%(+2.60)#100 | 5.3%(+2.04)#5,882 |
| 4. | 55119 | 6.8% | 4.7%(+2.07)#124 | 5.3%(+1.51)#7,062 |
| 5. | 55121 | 6.4% | 4.7%(+1.62)#153 | 5.3%(+1.07)#8,264 |
| 6. | 55101 | 6.2% | 4.7%(+1.51)#161 | 5.3%(+0.953)#8,620 |
| 7. | 55104 | 6.1% | 4.7%(+1.33)#174 | 5.3%(+0.774)#9,146 |
| 8. | 55112 | 5.4% | 4.7%(+0.646)#242 | 5.3%(+0.091)#11,480 |
| 9. | 55102 | 5.2% | 4.7%(+0.457)#260 | 5.3%(-0.097)#12,192 |
| 10. | 55118 | 5.0% | 4.7%(+0.286)#272 | 5.3%(-0.268)#12,877 |
| 11. | 55116 | 5.0% | 4.7%(+0.248)#278 | 5.3%(-0.307)#13,031 |
| 12. | 55117 | 5.0% | 4.7%(+0.221)#281 | 5.3%(-0.333)#13,135 |
| 13. | 55124 | 4.9% | 4.7%(+0.174)#287 | 5.3%(-0.381)#13,322 |
| 14. | 55130 | 4.8% | 4.7%(+0.034)#309 | 5.3%(-0.521)#13,887 |
| 15. | 55109 | 4.7% | 4.7%(+0.009)#313 | 5.3%(-0.546)#13,987 |
| 16. | 55106 | 4.7% | 4.7%(-0.060)#324 | 5.3%(-0.614)#14,282 |
| 17. | 55120 | 4.4% | 4.7%(-0.358)#370 | 5.3%(-0.912)#15,539 |
| 18. | 55110 | 4.1% | 4.7%(-0.652)#419 | 5.3%(-1.21)#16,799 |
| 19. | 55114 | 4.0% | 4.7%(-0.774)#429 | 5.3%(-1.33)#17,302 |
| 20. | 55122 | 3.9% | 4.7%(-0.794)#430 | 5.3%(-1.35)#17,385 |
| 21. | 55113 | 3.8% | 4.7%(-0.885)#448 | 5.3%(-1.44)#17,749 |
| 22. | 55105 | 3.8% | 4.7%(-0.920)#455 | 5.3%(-1.48)#17,893 |
| 23. | 55115 | 3.5% | 4.7%(-1.19)#495 | 5.3%(-1.75)#19,050 |
| 24. | 55125 | 3.4% | 4.7%(-1.30)#508 | 5.3%(-1.85)#19,467 |
| 25. | 55123 | 2.9% | 4.7%(-1.81)#609 | 5.3%(-2.37)#21,555 |
| 26. | 55127 | 2.8% | 4.7%(-1.88)#619 | 5.3%(-2.44)#21,856 |
| 27. | 55129 | 2.6% | 4.7%(-2.15)#661 | 5.3%(-2.70)#22,841 |
| 28. | 55126 | 2.2% | 4.7%(-2.58)#719 | 5.3%(-3.14)#24,251 |
| 29. | 55108 | 1.9% | 4.7%(-2.83)#743 | 5.3%(-3.38)#24,989 |
1
Common Questions
What are the Top 10 Zip Codes with the Highest Percentage of Population Employed in Food Preparation & Serving in Saint Paul, MN?
Top 10 Zip Codes with the Highest Percentage of Population Employed in Food Preparation & Serving in Saint Paul, MN are:
What zip code has the Highest Percentage of Population Employed in Food Preparation & Serving in Saint Paul, MN?
55128 has the Highest Percentage of Population Employed in Food Preparation & Serving in Saint Paul, MN with 7.7%.
What is the Percentage of Population Employed in Food Preparation & Serving in Minnesota?
Percentage of Population Employed in Food Preparation & Serving in Minnesota is 4.7%.
What is the Percentage of Population Employed in Food Preparation & Serving in the United States?
Percentage of Population Employed in Food Preparation & Serving in the United States is 5.3%.