Zip Codes with the Highest Percentage of Population Employed in Food Preparation & Serving in Rochester, MN
RELATED REPORTS & OPTIONS
Food Preparation & Serving
Rochester
Compare Zip Codes
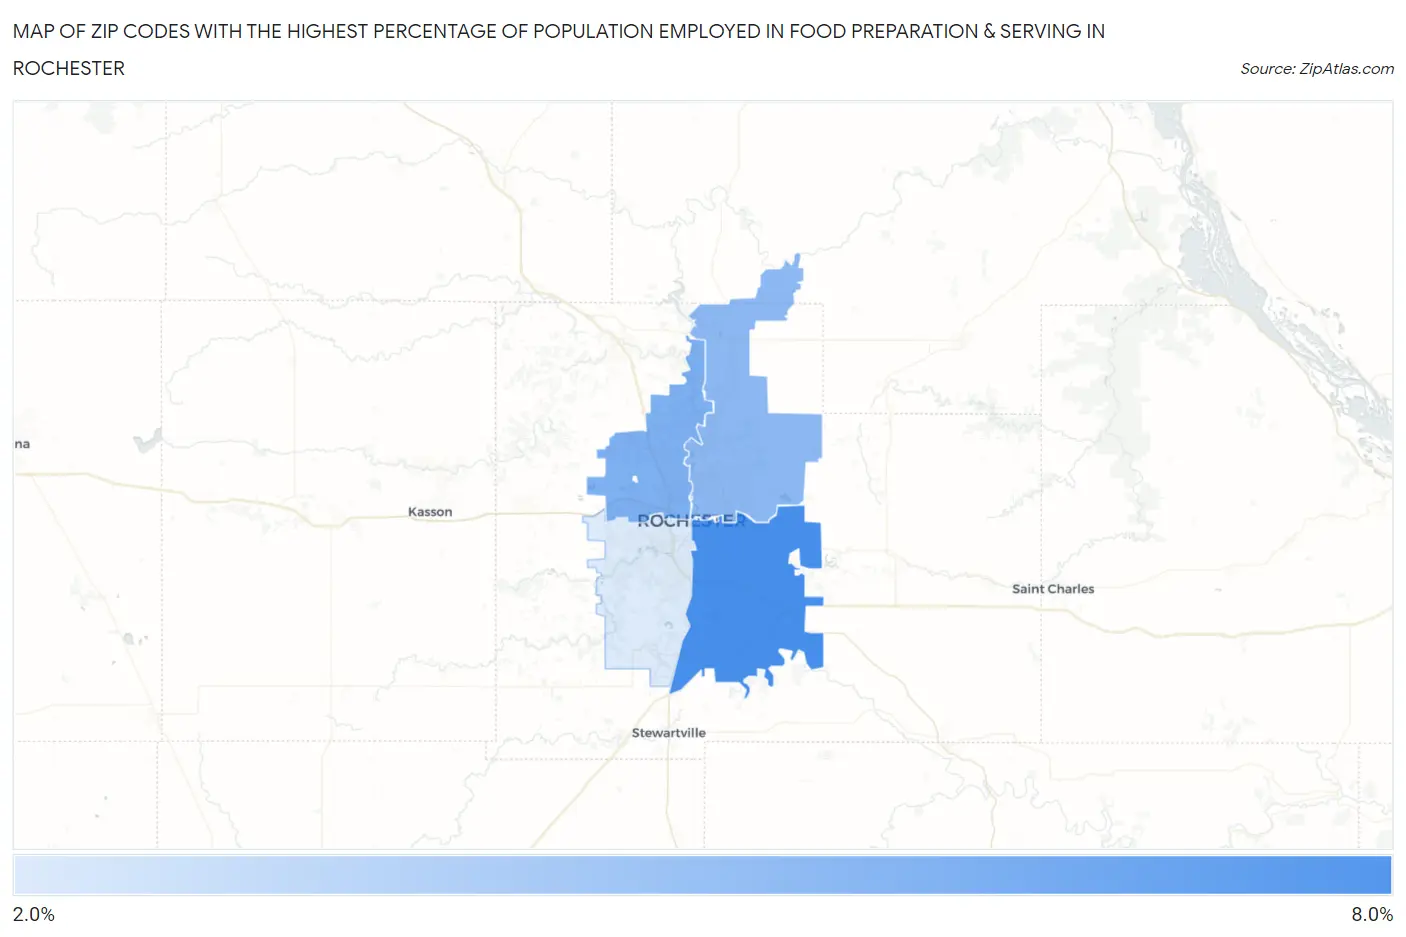
Map of Zip Codes with the Highest Percentage of Population Employed in Food Preparation & Serving in Rochester
3.0%
6.1%
Zip Codes with the Highest Percentage of Population Employed in Food Preparation & Serving in Rochester, MN
| Zip Code | % Employed | vs State | vs National | |
| 1. | 55904 | 6.1% | 4.7%(+1.37)#171 | 5.3%(+0.817)#9,013 |
| 2. | 55901 | 4.9% | 4.7%(+0.209)#282 | 5.3%(-0.346)#13,184 |
| 3. | 55906 | 4.7% | 4.7%(-0.070)#325 | 5.3%(-0.624)#14,320 |
| 4. | 55902 | 3.0% | 4.7%(-1.75)#594 | 5.3%(-2.31)#21,341 |
1
Common Questions
What are the Top 3 Zip Codes with the Highest Percentage of Population Employed in Food Preparation & Serving in Rochester, MN?
Top 3 Zip Codes with the Highest Percentage of Population Employed in Food Preparation & Serving in Rochester, MN are:
What zip code has the Highest Percentage of Population Employed in Food Preparation & Serving in Rochester, MN?
55904 has the Highest Percentage of Population Employed in Food Preparation & Serving in Rochester, MN with 6.1%.
What is the Percentage of Population Employed in Food Preparation & Serving in Rochester, MN?
Percentage of Population Employed in Food Preparation & Serving in Rochester is 5.0%.
What is the Percentage of Population Employed in Food Preparation & Serving in Minnesota?
Percentage of Population Employed in Food Preparation & Serving in Minnesota is 4.7%.
What is the Percentage of Population Employed in Food Preparation & Serving in the United States?
Percentage of Population Employed in Food Preparation & Serving in the United States is 5.3%.