Zip Codes with the Highest Percentage of Population Employed in Food Preparation & Serving in Elko New Market, MN
RELATED REPORTS & OPTIONS
Food Preparation & Serving
Elko New Market
Compare Zip Codes
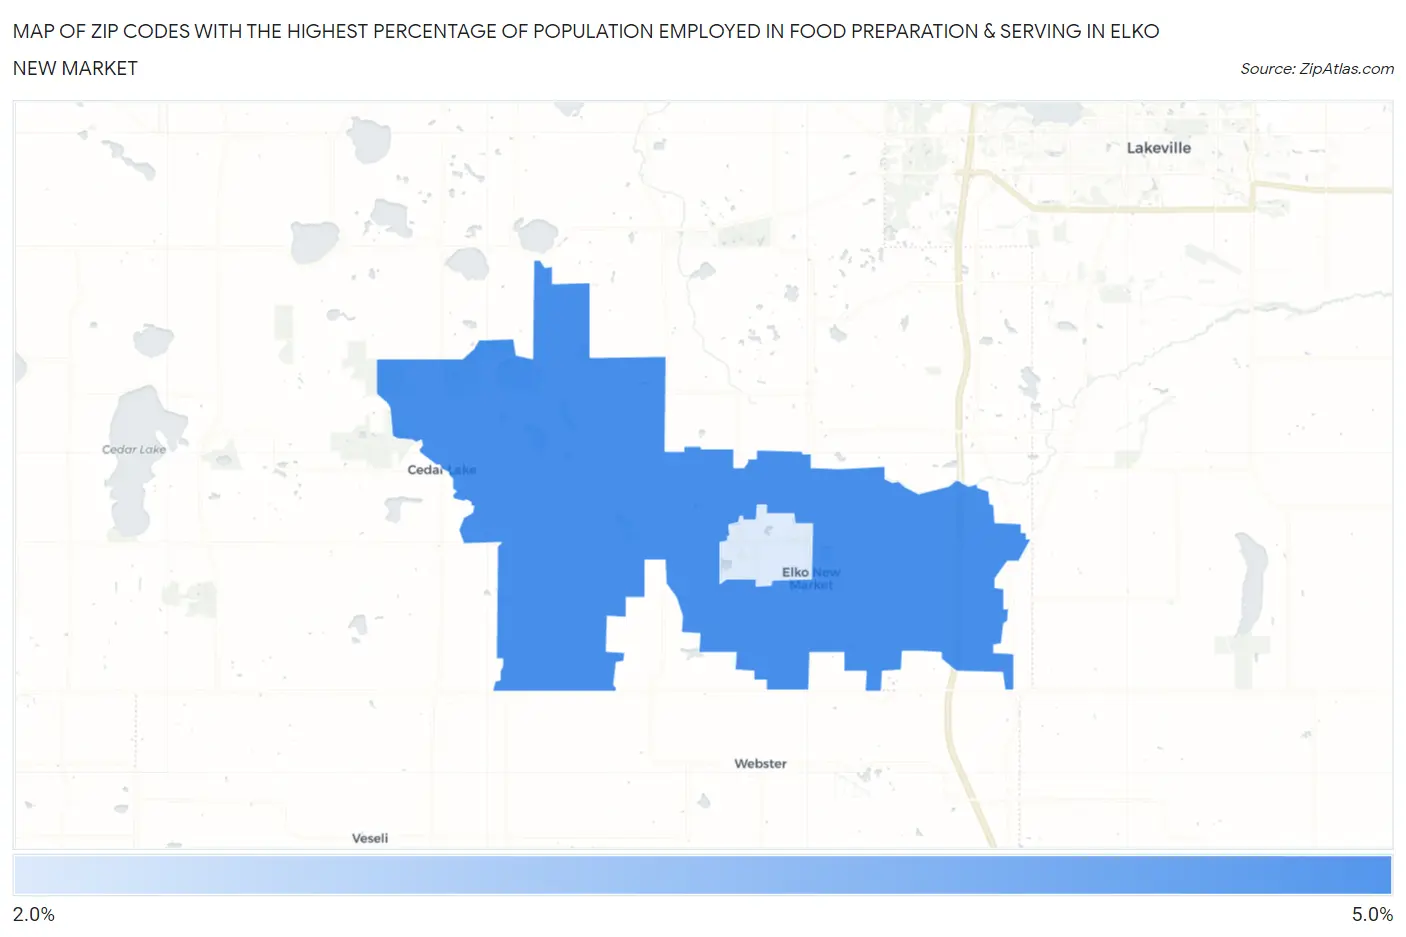
Map of Zip Codes with the Highest Percentage of Population Employed in Food Preparation & Serving in Elko New Market
2.8%
4.6%
Zip Codes with the Highest Percentage of Population Employed in Food Preparation & Serving in Elko New Market, MN
| Zip Code | % Employed | vs State | vs National | |
| 1. | 55020 | 4.6% | 4.7%(-0.104)#332 | 5.3%(-0.659)#14,465 |
| 2. | 55054 | 2.8% | 4.7%(-1.95)#626 | 5.3%(-2.51)#22,127 |
1
Common Questions
What are the Top Zip Codes with the Highest Percentage of Population Employed in Food Preparation & Serving in Elko New Market, MN?
Top Zip Codes with the Highest Percentage of Population Employed in Food Preparation & Serving in Elko New Market, MN are:
What zip code has the Highest Percentage of Population Employed in Food Preparation & Serving in Elko New Market, MN?
55020 has the Highest Percentage of Population Employed in Food Preparation & Serving in Elko New Market, MN with 4.6%.
What is the Percentage of Population Employed in Food Preparation & Serving in Elko New Market, MN?
Percentage of Population Employed in Food Preparation & Serving in Elko New Market is 2.8%.
What is the Percentage of Population Employed in Food Preparation & Serving in Minnesota?
Percentage of Population Employed in Food Preparation & Serving in Minnesota is 4.7%.
What is the Percentage of Population Employed in Food Preparation & Serving in the United States?
Percentage of Population Employed in Food Preparation & Serving in the United States is 5.3%.