Zip Codes with the Highest Percentage of Population Employed in Food Preparation & Serving in Saint Cloud, MN
RELATED REPORTS & OPTIONS
Food Preparation & Serving
Saint Cloud
Compare Zip Codes
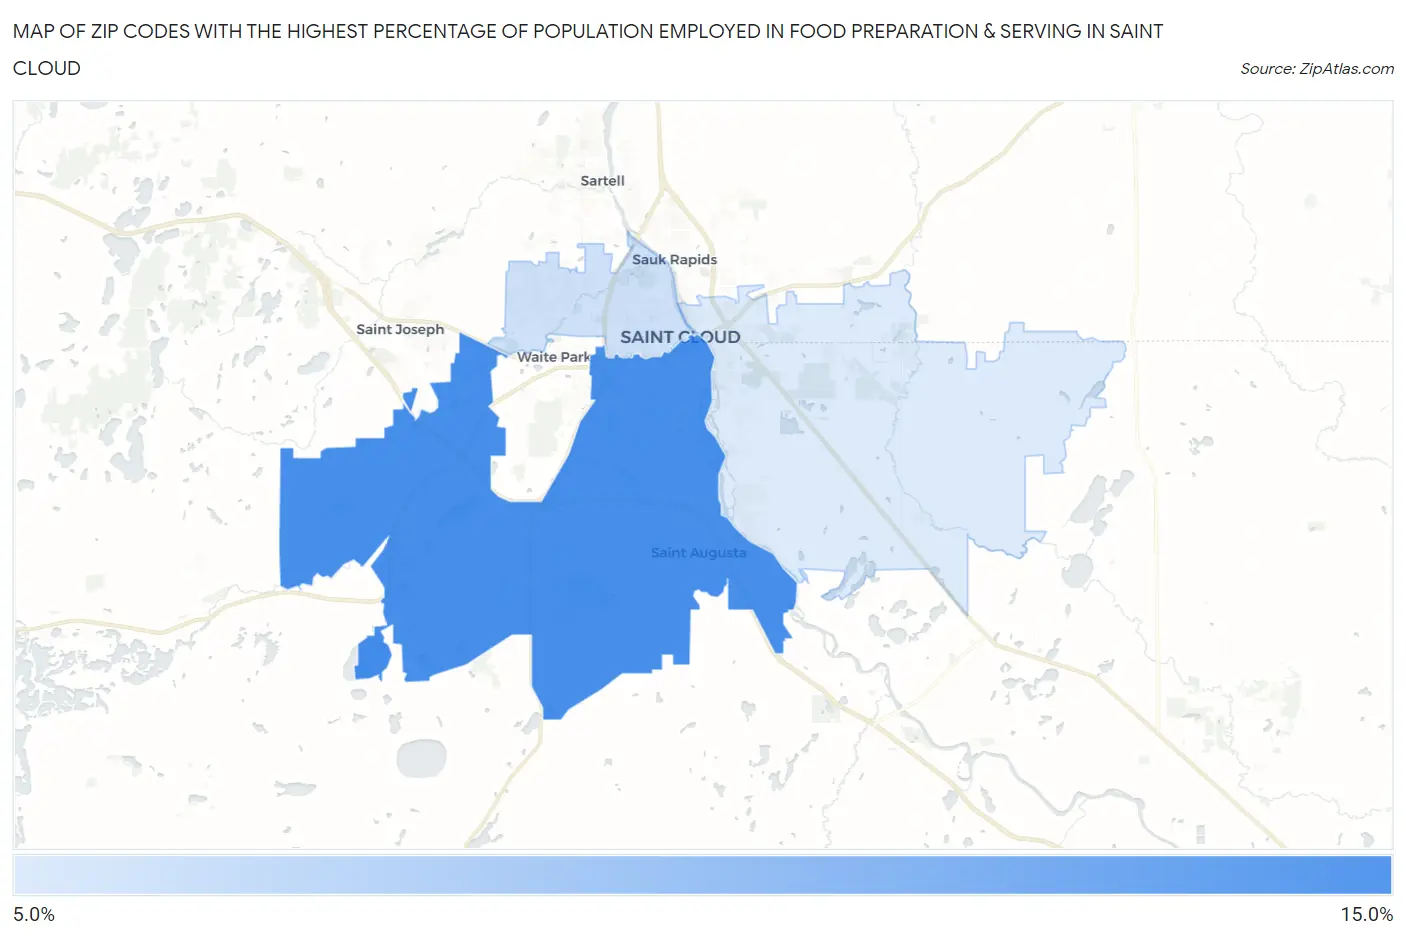
Map of Zip Codes with the Highest Percentage of Population Employed in Food Preparation & Serving in Saint Cloud
5.2%
10.1%
Zip Codes with the Highest Percentage of Population Employed in Food Preparation & Serving in Saint Cloud, MN
| Zip Code | % Employed | vs State | vs National | |
| 1. | 56301 | 10.1% | 4.7%(+5.34)#36 | 5.3%(+4.79)#2,577 |
| 2. | 56303 | 5.6% | 4.7%(+0.860)#217 | 5.3%(+0.305)#10,738 |
| 3. | 56304 | 5.2% | 4.7%(+0.428)#262 | 5.3%(-0.127)#12,327 |
1
Common Questions
What are the Top Zip Codes with the Highest Percentage of Population Employed in Food Preparation & Serving in Saint Cloud, MN?
Top Zip Codes with the Highest Percentage of Population Employed in Food Preparation & Serving in Saint Cloud, MN are:
What zip code has the Highest Percentage of Population Employed in Food Preparation & Serving in Saint Cloud, MN?
56301 has the Highest Percentage of Population Employed in Food Preparation & Serving in Saint Cloud, MN with 10.1%.
What is the Percentage of Population Employed in Food Preparation & Serving in Minnesota?
Percentage of Population Employed in Food Preparation & Serving in Minnesota is 4.7%.
What is the Percentage of Population Employed in Food Preparation & Serving in the United States?
Percentage of Population Employed in Food Preparation & Serving in the United States is 5.3%.