Zip Codes with the Highest Percentage of Population Employed in Food Preparation & Serving in Hopkins, MN
RELATED REPORTS & OPTIONS
Food Preparation & Serving
Hopkins
Compare Zip Codes
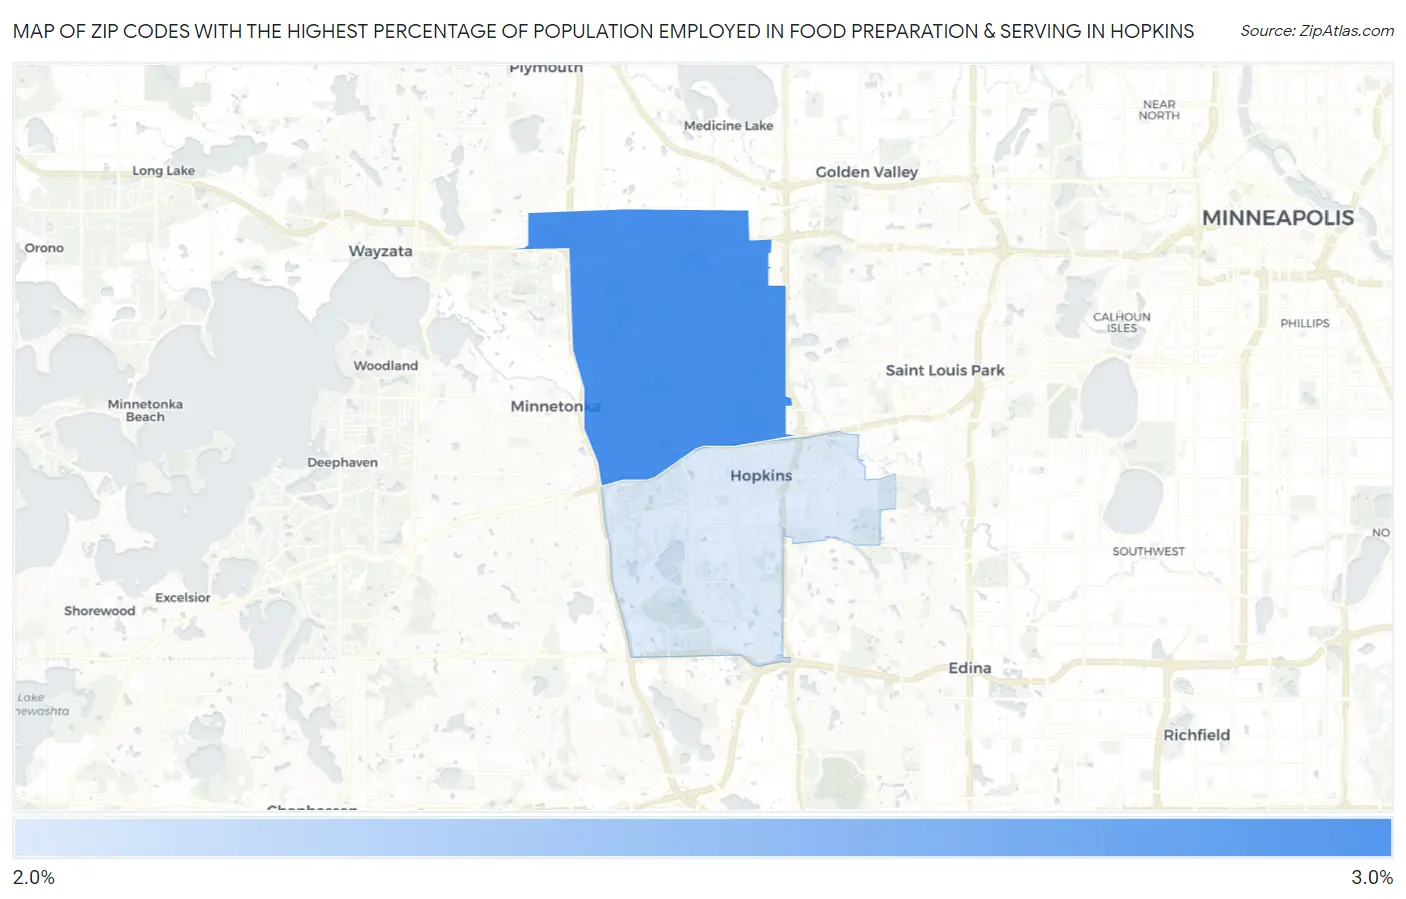
Map of Zip Codes with the Highest Percentage of Population Employed in Food Preparation & Serving in Hopkins
2.8%
3.0%
Zip Codes with the Highest Percentage of Population Employed in Food Preparation & Serving in Hopkins, MN
| Zip Code | % Employed | vs State | vs National | |
| 1. | 55305 | 3.0% | 4.7%(-1.76)#598 | 5.3%(-2.32)#21,374 |
| 2. | 55343 | 2.8% | 4.7%(-1.89)#620 | 5.3%(-2.44)#21,887 |
1
Common Questions
What are the Top Zip Codes with the Highest Percentage of Population Employed in Food Preparation & Serving in Hopkins, MN?
Top Zip Codes with the Highest Percentage of Population Employed in Food Preparation & Serving in Hopkins, MN are:
What zip code has the Highest Percentage of Population Employed in Food Preparation & Serving in Hopkins, MN?
55305 has the Highest Percentage of Population Employed in Food Preparation & Serving in Hopkins, MN with 3.0%.
What is the Percentage of Population Employed in Food Preparation & Serving in Hopkins, MN?
Percentage of Population Employed in Food Preparation & Serving in Hopkins is 2.7%.
What is the Percentage of Population Employed in Food Preparation & Serving in Minnesota?
Percentage of Population Employed in Food Preparation & Serving in Minnesota is 4.7%.
What is the Percentage of Population Employed in Food Preparation & Serving in the United States?
Percentage of Population Employed in Food Preparation & Serving in the United States is 5.3%.