Zip Codes with the Highest Percentage of Population Employed in Food Preparation & Serving in Mankato, MN
RELATED REPORTS & OPTIONS
Food Preparation & Serving
Mankato
Compare Zip Codes
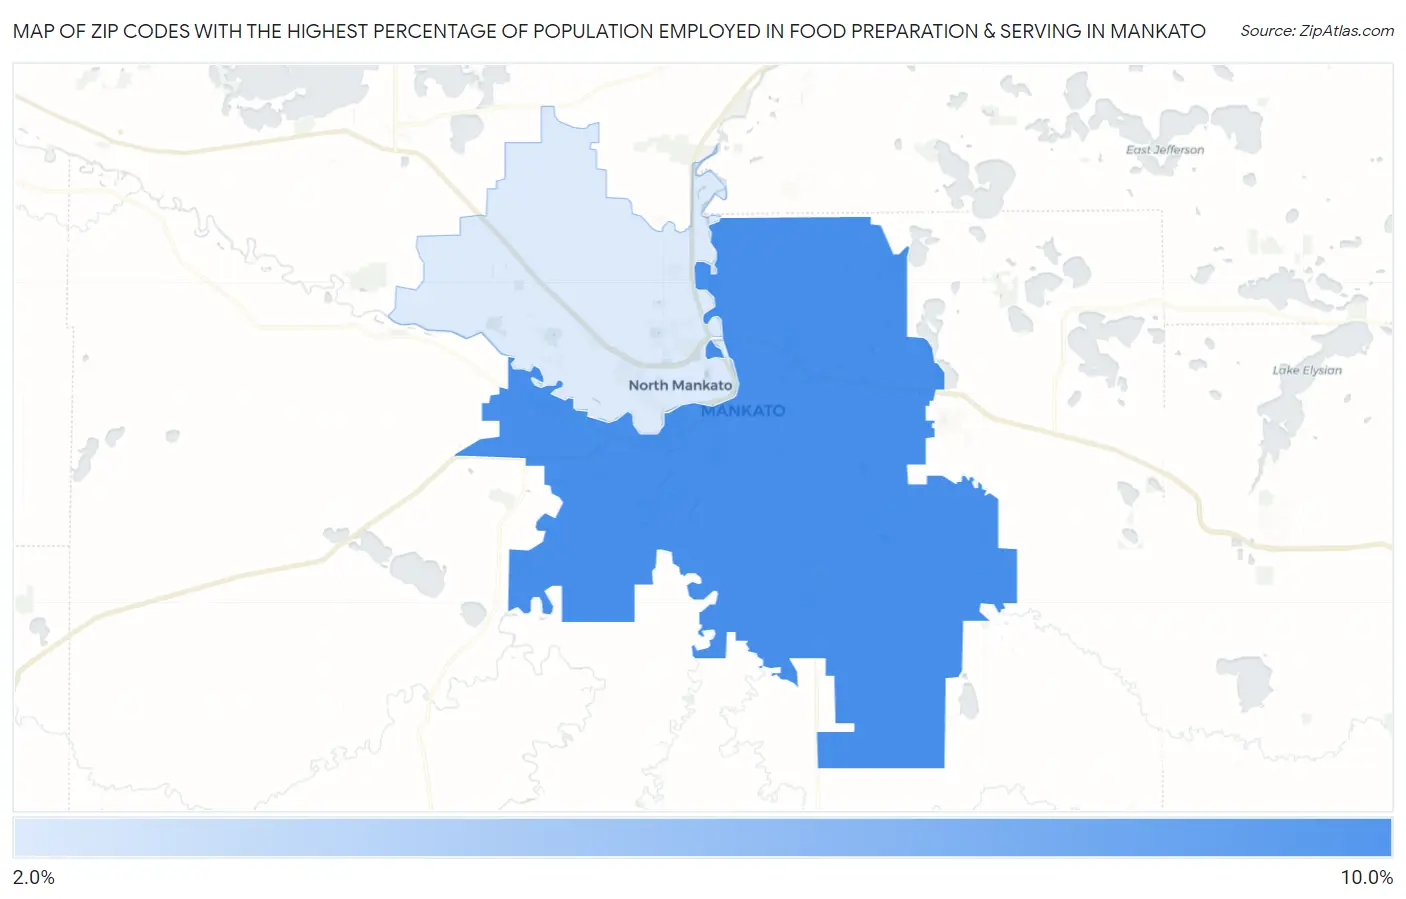
Map of Zip Codes with the Highest Percentage of Population Employed in Food Preparation & Serving in Mankato
2.7%
8.8%
Zip Codes with the Highest Percentage of Population Employed in Food Preparation & Serving in Mankato, MN
| Zip Code | % Employed | vs State | vs National | |
| 1. | 56001 | 8.8% | 4.7%(+4.05)#61 | 5.3%(+3.50)#3,743 |
| 2. | 56003 | 2.7% | 4.7%(-2.08)#648 | 5.3%(-2.63)#22,590 |
1
Common Questions
What are the Top Zip Codes with the Highest Percentage of Population Employed in Food Preparation & Serving in Mankato, MN?
Top Zip Codes with the Highest Percentage of Population Employed in Food Preparation & Serving in Mankato, MN are:
What zip code has the Highest Percentage of Population Employed in Food Preparation & Serving in Mankato, MN?
56001 has the Highest Percentage of Population Employed in Food Preparation & Serving in Mankato, MN with 8.8%.
What is the Percentage of Population Employed in Food Preparation & Serving in Mankato, MN?
Percentage of Population Employed in Food Preparation & Serving in Mankato is 9.5%.
What is the Percentage of Population Employed in Food Preparation & Serving in Minnesota?
Percentage of Population Employed in Food Preparation & Serving in Minnesota is 4.7%.
What is the Percentage of Population Employed in Food Preparation & Serving in the United States?
Percentage of Population Employed in Food Preparation & Serving in the United States is 5.3%.