Zip Codes with the Highest Percentage of Population with a Degree in Visual and Performing Arts in Houma, LA
RELATED REPORTS & OPTIONS
Visual and Performing Arts
Houma
Compare Zip Codes
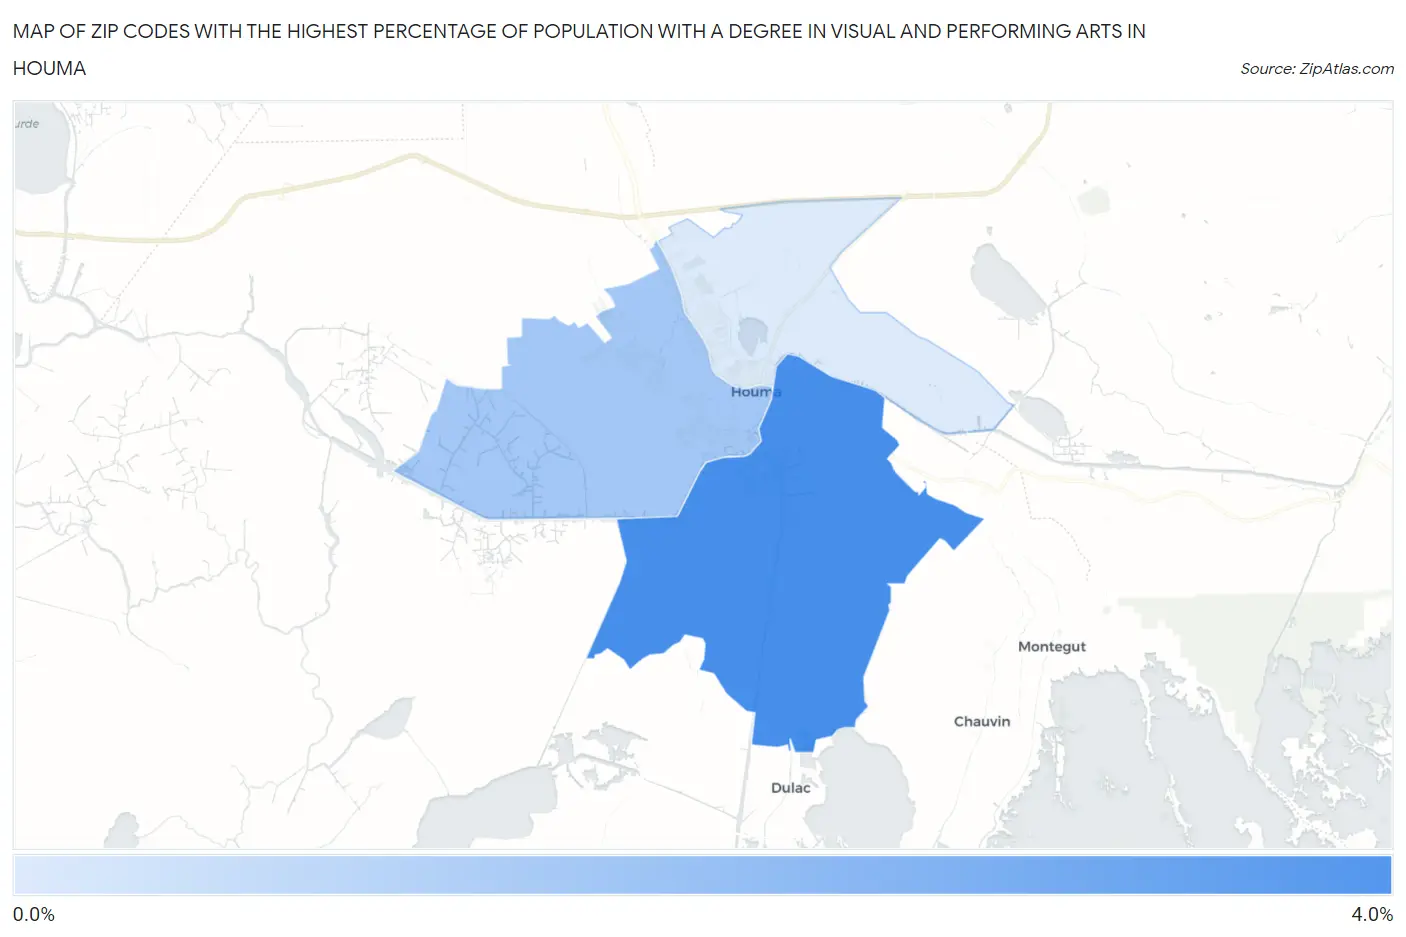
Map of Zip Codes with the Highest Percentage of Population with a Degree in Visual and Performing Arts in Houma
0.11%
3.9%
Zip Codes with the Highest Percentage of Population with a Degree in Visual and Performing Arts in Houma, LA
| Zip Code | % Graduates | vs State | vs National | |
| 1. | 70363 | 3.9% | 3.3%(+0.623)#70 | 4.3%(-0.348)#9,564 |
| 2. | 70360 | 1.5% | 3.3%(-1.74)#182 | 4.3%(-2.71)#18,050 |
| 3. | 70364 | 0.11% | 3.3%(-3.17)#241 | 4.3%(-4.14)#21,235 |
1
Common Questions
What are the Top Zip Codes with the Highest Percentage of Population with a Degree in Visual and Performing Arts in Houma, LA?
Top Zip Codes with the Highest Percentage of Population with a Degree in Visual and Performing Arts in Houma, LA are:
What zip code has the Highest Percentage of Population with a Degree in Visual and Performing Arts in Houma, LA?
70363 has the Highest Percentage of Population with a Degree in Visual and Performing Arts in Houma, LA with 3.9%.
What is the Percentage of Population with a Degree in Visual and Performing Arts in Houma, LA?
Percentage of Population with a Degree in Visual and Performing Arts in Houma is 1.8%.
What is the Percentage of Population with a Degree in Visual and Performing Arts in Louisiana?
Percentage of Population with a Degree in Visual and Performing Arts in Louisiana is 3.3%.
What is the Percentage of Population with a Degree in Visual and Performing Arts in the United States?
Percentage of Population with a Degree in Visual and Performing Arts in the United States is 4.3%.