Zip Codes with the Highest Percentage of Population Employed in Accommodation & Food Services in Houma, LA
RELATED REPORTS & OPTIONS
Accommodation & Food Services
Houma
Compare Zip Codes
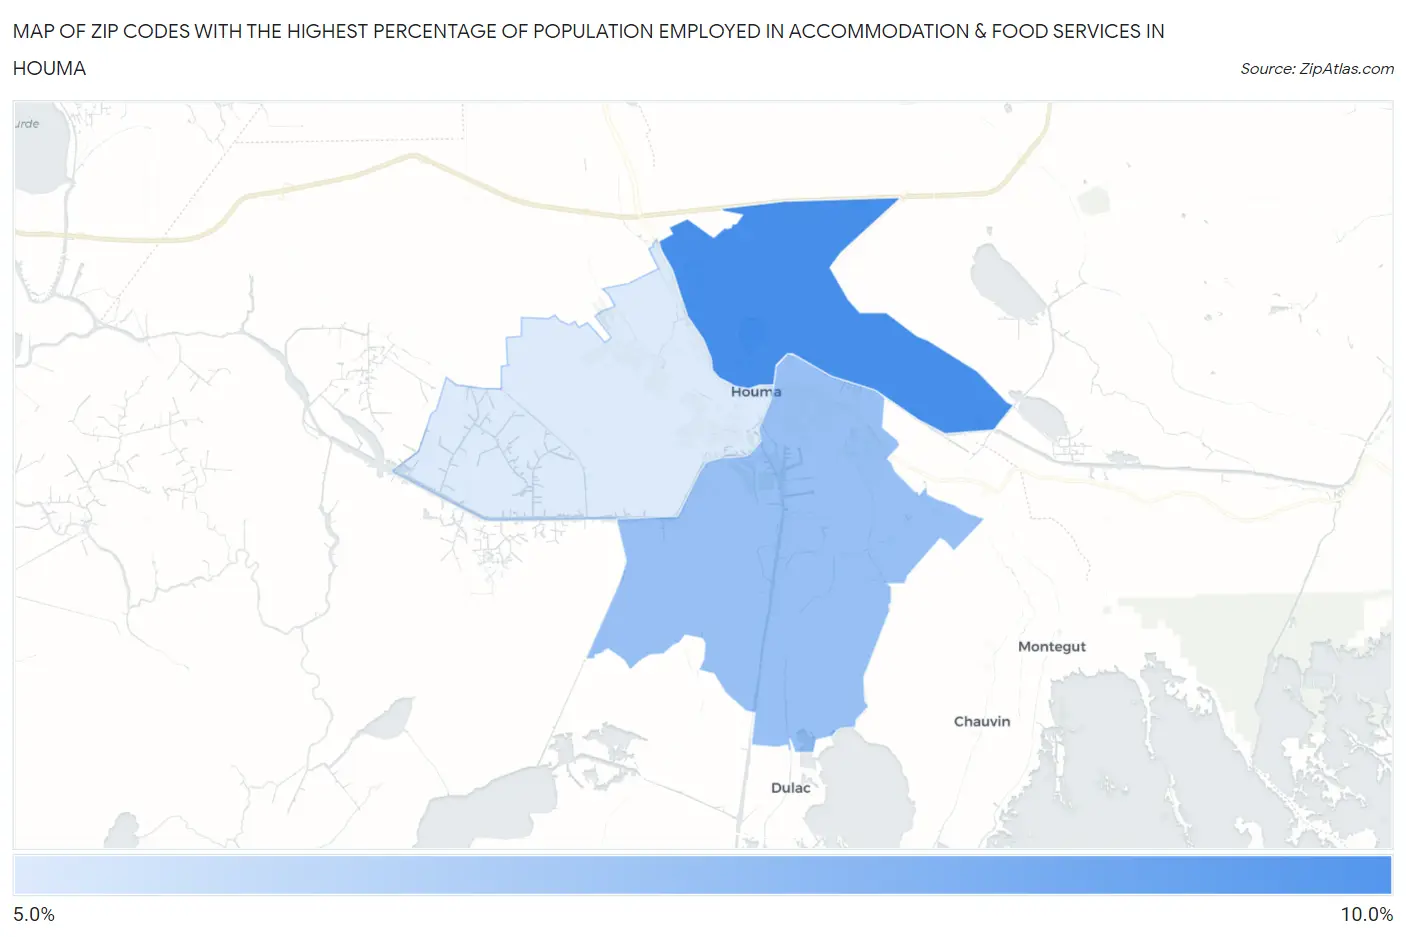
Map of Zip Codes with the Highest Percentage of Population Employed in Accommodation & Food Services in Houma
5.6%
9.0%
Zip Codes with the Highest Percentage of Population Employed in Accommodation & Food Services in Houma, LA
| Zip Code | % Employed | vs State | vs National | |
| 1. | 70364 | 9.0% | 7.6%(+1.39)#108 | 6.9%(+2.12)#5,951 |
| 2. | 70363 | 7.2% | 7.6%(-0.446)#179 | 6.9%(+0.282)#9,892 |
| 3. | 70360 | 5.6% | 7.6%(-1.98)#235 | 6.9%(-1.26)#14,607 |
1
Common Questions
What are the Top Zip Codes with the Highest Percentage of Population Employed in Accommodation & Food Services in Houma, LA?
Top Zip Codes with the Highest Percentage of Population Employed in Accommodation & Food Services in Houma, LA are:
What zip code has the Highest Percentage of Population Employed in Accommodation & Food Services in Houma, LA?
70364 has the Highest Percentage of Population Employed in Accommodation & Food Services in Houma, LA with 9.0%.
What is the Percentage of Population Employed in Accommodation & Food Services in Houma, LA?
Percentage of Population Employed in Accommodation & Food Services in Houma is 6.8%.
What is the Percentage of Population Employed in Accommodation & Food Services in Louisiana?
Percentage of Population Employed in Accommodation & Food Services in Louisiana is 7.6%.
What is the Percentage of Population Employed in Accommodation & Food Services in the United States?
Percentage of Population Employed in Accommodation & Food Services in the United States is 6.9%.