Zip Codes with the Highest Percentage of Population with a Degree in Liberal Arts and History in Houma, LA
RELATED REPORTS & OPTIONS
Liberal Arts and History
Houma
Compare Zip Codes
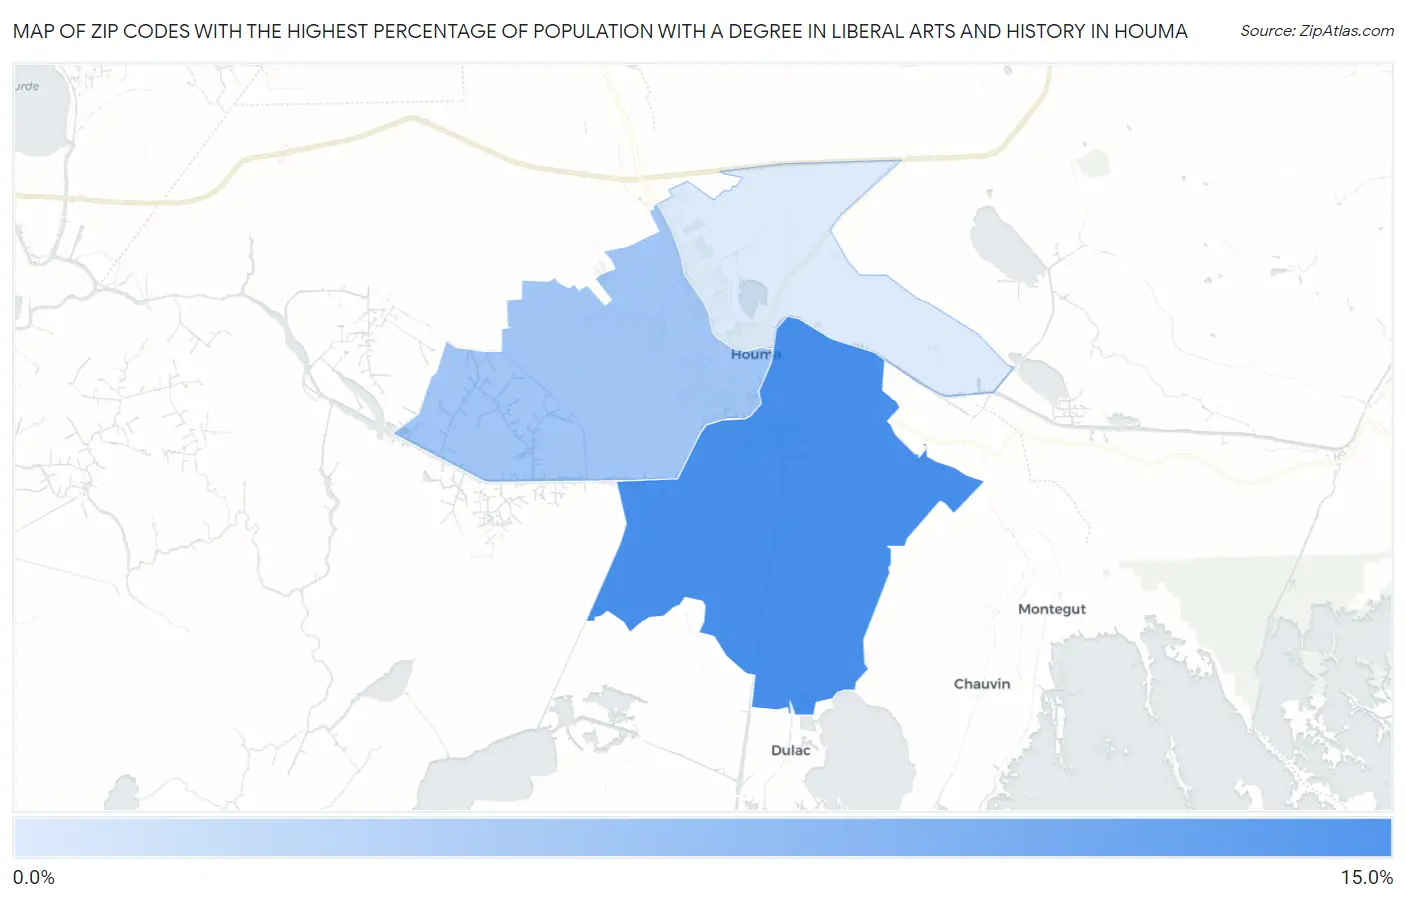
Map of Zip Codes with the Highest Percentage of Population with a Degree in Liberal Arts and History in Houma
3.5%
10.3%
Zip Codes with the Highest Percentage of Population with a Degree in Liberal Arts and History in Houma, LA
| Zip Code | % Graduates | vs State | vs National | |
| 1. | 70363 | 10.3% | 7.4%(+2.83)#108 | 4.9%(+5.41)#2,943 |
| 2. | 70360 | 6.1% | 7.4%(-1.35)#234 | 4.9%(+1.23)#8,266 |
| 3. | 70364 | 3.5% | 7.4%(-3.99)#319 | 4.9%(-1.42)#16,765 |
1
Common Questions
What are the Top Zip Codes with the Highest Percentage of Population with a Degree in Liberal Arts and History in Houma, LA?
Top Zip Codes with the Highest Percentage of Population with a Degree in Liberal Arts and History in Houma, LA are:
What zip code has the Highest Percentage of Population with a Degree in Liberal Arts and History in Houma, LA?
70363 has the Highest Percentage of Population with a Degree in Liberal Arts and History in Houma, LA with 10.3%.
What is the Percentage of Population with a Degree in Liberal Arts and History in Houma, LA?
Percentage of Population with a Degree in Liberal Arts and History in Houma is 7.2%.
What is the Percentage of Population with a Degree in Liberal Arts and History in Louisiana?
Percentage of Population with a Degree in Liberal Arts and History in Louisiana is 7.4%.
What is the Percentage of Population with a Degree in Liberal Arts and History in the United States?
Percentage of Population with a Degree in Liberal Arts and History in the United States is 4.9%.