Zip Codes with the Highest Percentage of Population Employed in Accommodation & Food Services in Nampa, ID
RELATED REPORTS & OPTIONS
Accommodation & Food Services
Nampa
Compare Zip Codes
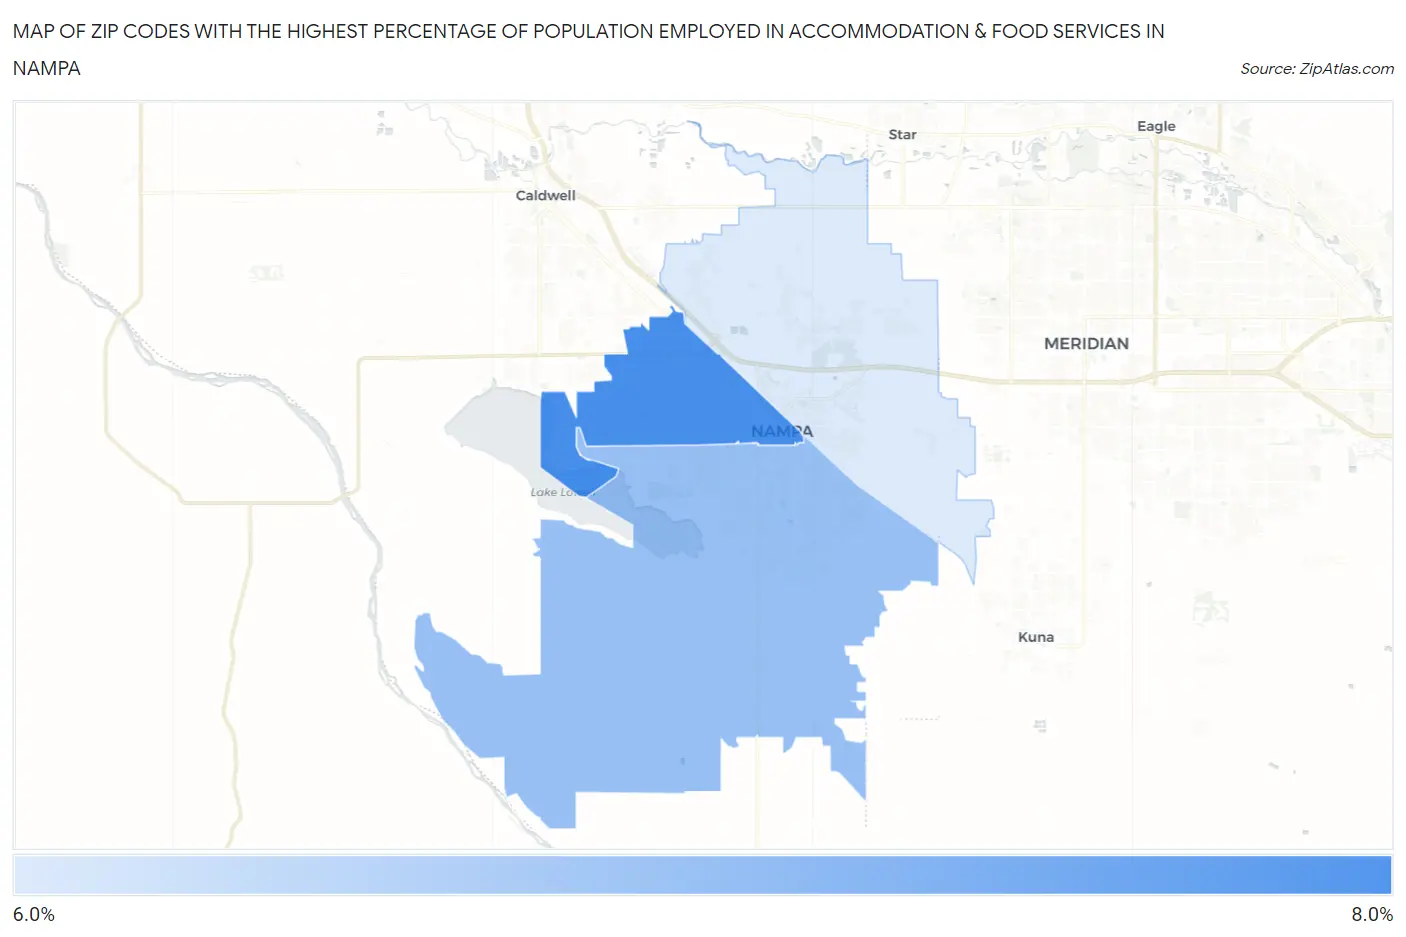
Map of Zip Codes with the Highest Percentage of Population Employed in Accommodation & Food Services in Nampa
6.3%
7.5%
Zip Codes with the Highest Percentage of Population Employed in Accommodation & Food Services in Nampa, ID
| Zip Code | % Employed | vs State | vs National | |
| 1. | 83651 | 7.5% | 7.1%(+0.427)#91 | 6.9%(+0.663)#8,877 |
| 2. | 83686 | 6.9% | 7.1%(-0.266)#95 | 6.9%(-0.030)#10,713 |
| 3. | 83687 | 6.3% | 7.1%(-0.844)#111 | 6.9%(-0.608)#12,565 |
1
Common Questions
What are the Top Zip Codes with the Highest Percentage of Population Employed in Accommodation & Food Services in Nampa, ID?
Top Zip Codes with the Highest Percentage of Population Employed in Accommodation & Food Services in Nampa, ID are:
What zip code has the Highest Percentage of Population Employed in Accommodation & Food Services in Nampa, ID?
83651 has the Highest Percentage of Population Employed in Accommodation & Food Services in Nampa, ID with 7.5%.
What is the Percentage of Population Employed in Accommodation & Food Services in Nampa, ID?
Percentage of Population Employed in Accommodation & Food Services in Nampa is 7.4%.
What is the Percentage of Population Employed in Accommodation & Food Services in Idaho?
Percentage of Population Employed in Accommodation & Food Services in Idaho is 7.1%.
What is the Percentage of Population Employed in Accommodation & Food Services in the United States?
Percentage of Population Employed in Accommodation & Food Services in the United States is 6.9%.