Zip Codes with the Highest Percentage of Population Employed in Installation, Maintenance & Repair in Nampa, ID
RELATED REPORTS & OPTIONS
Installation, Maintenance & Repair
Nampa
Compare Zip Codes
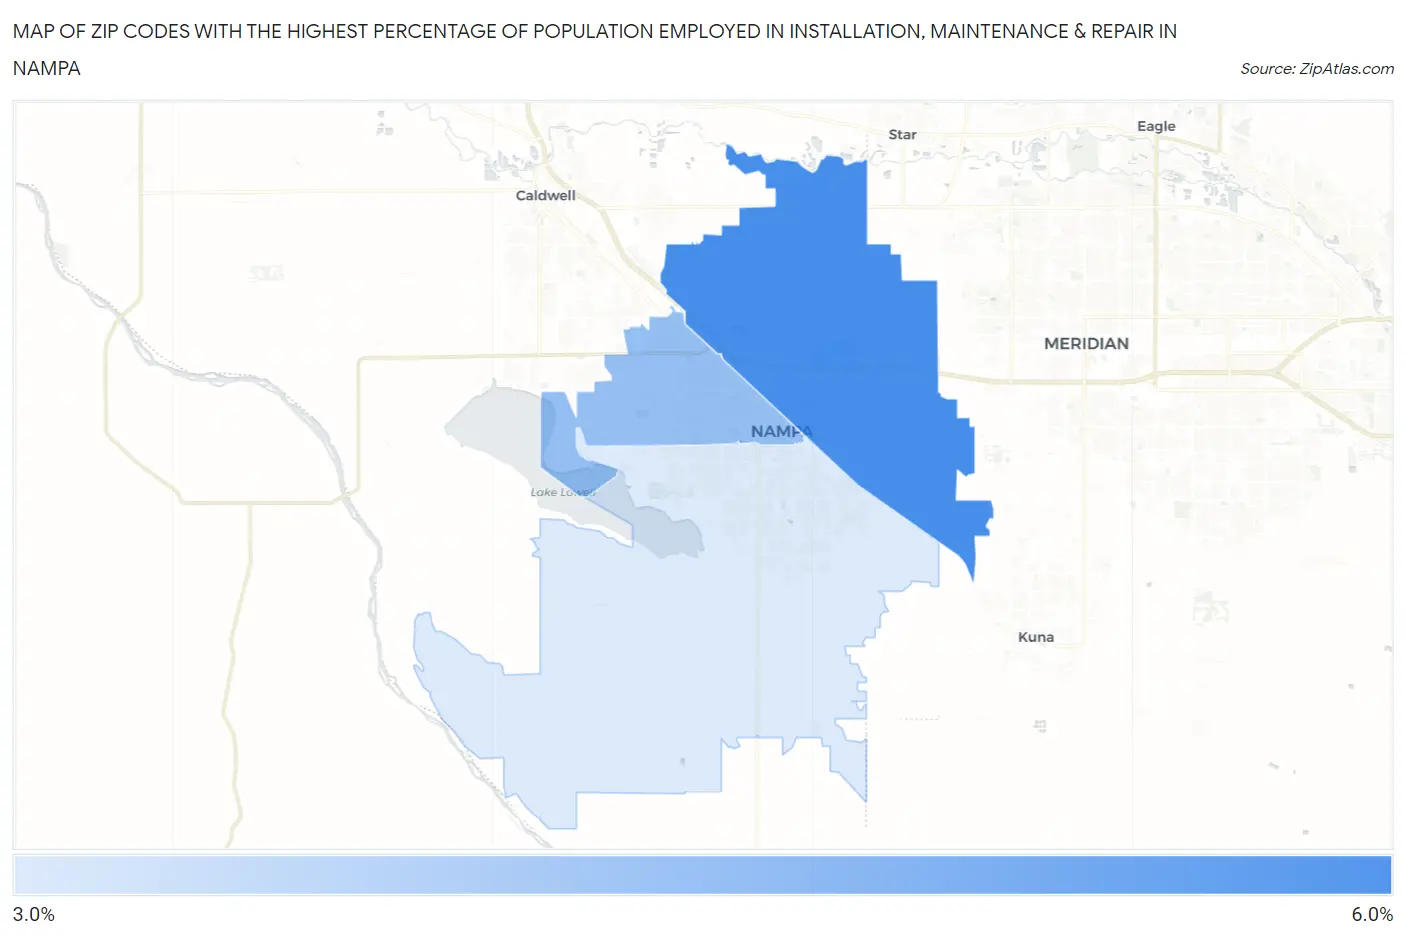
Map of Zip Codes with the Highest Percentage of Population Employed in Installation, Maintenance & Repair in Nampa
3.6%
5.2%
Zip Codes with the Highest Percentage of Population Employed in Installation, Maintenance & Repair in Nampa, ID
| Zip Code | % Employed | vs State | vs National | |
| 1. | 83687 | 5.2% | 3.5%(+1.67)#73 | 3.1%(+2.14)#8,064 |
| 2. | 83651 | 4.4% | 3.5%(+0.812)#103 | 3.1%(+1.28)#10,947 |
| 3. | 83686 | 3.6% | 3.5%(+0.021)#129 | 3.1%(+0.493)#14,329 |
1
Common Questions
What are the Top Zip Codes with the Highest Percentage of Population Employed in Installation, Maintenance & Repair in Nampa, ID?
Top Zip Codes with the Highest Percentage of Population Employed in Installation, Maintenance & Repair in Nampa, ID are:
What zip code has the Highest Percentage of Population Employed in Installation, Maintenance & Repair in Nampa, ID?
83687 has the Highest Percentage of Population Employed in Installation, Maintenance & Repair in Nampa, ID with 5.2%.
What is the Percentage of Population Employed in Installation, Maintenance & Repair in Nampa, ID?
Percentage of Population Employed in Installation, Maintenance & Repair in Nampa is 4.2%.
What is the Percentage of Population Employed in Installation, Maintenance & Repair in Idaho?
Percentage of Population Employed in Installation, Maintenance & Repair in Idaho is 3.5%.
What is the Percentage of Population Employed in Installation, Maintenance & Repair in the United States?
Percentage of Population Employed in Installation, Maintenance & Repair in the United States is 3.1%.