Zip Codes with the Highest Inequality / Gini Index in Commerce, GA
On this page
RELATED REPORTS & OPTIONS
Highest Inequality / Gini Index
Population
Highest PopulationHighest Population DensityLowest Population DensityMale / Female RatioFemale / Male RatioOldest PopulationOldest Population | MaleOldest Population | FemaleYoungest PopulationYoungest Population | MaleYoungest Population | Female
Families and Households
Largest Family SizeLargest Household SizeMost Single FathersMost Single MothersFewest Single FathersFewest Single MothersSmallest Family SizeSmallest Household Size
Female Fertility
Highest Birth Rate | All WomenHighest Birth Rate | Below PovertyHighest Birth Rate | Public IncomeHighest Birth Rate | In Labor ForceLowest Birth Rate | All WomenLowest Birth Rate | Below PovertyLowest Birth Rate | Public IncomeLowest Birth Rate | In Labor Force
Race (Community Size)
Race (Percentage)
Ancestry (Community Size)
AmericanCentral AmericanCzechDutchEastern EuropeanEnglishEuropeanFrenchGermanIndian (Asian)IrishItalianKoreanMexicanNorwegianPolishPuerto RicanSalvadoranScotch-IrishScottish
Ancestry (Percentage)
AmericanCentral AmericanCzechDutchEastern EuropeanEnglishEuropeanFrenchGermanIndian (Asian)IrishItalianKoreanMexicanNorwegianPolishPuerto RicanSalvadoranScotch-IrishScottish
Immigrant Origin (Total)
AsiaCentral AmericaChinaEastern AsiaEl SalvadorEuropeLatin AmericaMexicoPhilippinesSouth Eastern AsiaWestern Europe
Immigrant Origin (Percentage)
AsiaCentral AmericaChinaEastern AsiaEl SalvadorEuropeLatin AmericaMexicoPhilippinesSouth Eastern AsiaWestern Europe
Income
Highest Per Capita IncomeHighest Earnings | MaleHighest Earnings | FemaleHighest Wage/Income Gap ($)Highest Wage/Income Gap (%)Highest Inequality / Gini IndexLowest Per Capita IncomeLowest Earnings | MaleLowest Earnings | FemaleLowest Wage/Income Gap ($)Lowest Wage/Income Gap (%)Lowest Inequality / Gini Index
Income (Families)
Highest Family IncomeLowest Family IncomeFamily Income | $0-10kFamily Income | $100k+Family Income | $200k+
Income (Households)
Highest Household IncomeLowest Household IncomeHousehold Income | $0-10kHousehold Income | $200k+Household Income | $100k+
Poverty
Highest PovertyHighest Poverty | MaleHighest Poverty | FemaleHighest Poverty | Female 18-24Highest Poverty | Female 25-34Highest Poverty | Child 0-5Highest Poverty | Child 0-16Highest Poverty | Boys 0-16Highest Poverty | Girls 0-16Highest Poverty | Seniors 65+Highest Poverty | Seniors 75+ Lowest PovertyLowest Poverty | MaleLowest Poverty | FemaleLowest Poverty | Child 0-5Lowest Poverty | Child 0-16Lowest Poverty | Boys 0-16Lowest Poverty | Girls 0-16Lowest Poverty | Seniors 65+Lowest Poverty | Seniors 75+
Poverty (Families)
Highest Family PovertyHighest Poverty | Married CoupleHighest Poverty | Single FemaleHighest Poverty | Single MotherLowest Family PovertyLowest Poverty | Married CoupleLowest Poverty | Single FemaleLowest Poverty | Single Mother
Unemployment
Employment Occupations
Architecture & EngineeringArts, Media & EntertainmentBusiness & FinancialCleaning & MaintenanceCommunity & Social Service Computer & MathematicsComputer, Engineering & ScienceConstruction & ExtractionEducation Instruction & LibraryEducation, Arts & MediaFarming, Fishing & ForestryFirefighting & PreventionFood Preparation & ServingHealth Diagnosing & TreatingHealth TechnologistsHealthcare SupportInstallation, Maintenance & RepairLaw EnforcementLife, Physical & Social ScienceManagementMaterial MovingOffice & AdministrationPersonal Care and ServiceProductionSales & RelatedSecurity & ProtectionTransportation
Employment Industries
Accommodation & Food ServicesAdministrative & Support ServicesAgriculture, Fishing & HuntingArts, Entertainment & RecreationConstructionEducational ServicesFinance & InsuranceHealth Care & Social AssistanceInformation & TechnologyManufacturingProfessional & Scientific ServicesPublic AdministrationReal Estate, Rental & LeasingRetail TradeTransportation & WarehousingUtilitiesWholesale Trade
Employer Class
Private Company EmployeesSelf-Employed / IncorporatedSelf-Employed / Not IncorporatedNot-for-profit OrganizationsLocal Government EmployeesState Government EmployeesFederal Government Employees
Commute Time
Longest CommuteLongest Commute | MaleLongest Commute | FemaleShortest CommuteShortest Commute | MaleShortest Commute | Female
Commute Means
School Enrollment
Education by Degree Field
Computers and MathematicsBio, Nature & AgriculturalPsychologySocial SciencesEngineeringScience and EngineeringBusinessEducationLiterature and LanguagesLiberal Arts and HistoryVisual and Performing ArtsCommunicationsArts and Humanities
Occupancy
Finances
Highest Median Housing CostsHighest Property PricesHighest Owner Housing CostsHighest Renter Housing CostsHighest Housing Costs / IncomeLowest Median Housing CostsLowest Property PricesLowest Owner Housing CostsLowest Renter Housing CostsLowest Housing Costs / Income
Physical Characteristics
Commerce
States
AlabamaAlaskaArizonaArkansasCaliforniaColoradoConnecticutDelawareDistrict Of ColumbiaFloridaGeorgiaHawaiiIdahoIllinoisIndianaIowaKansasKentuckyLouisianaMaineMarylandMassachusettsMichiganMinnesotaMississippiMissouriMontanaNebraskaNevadaNew HampshireNew JerseyNew MexicoNew YorkNorth CarolinaNorth DakotaOhioOklahomaOregonPennsylvaniaPuerto RicoRhode IslandSouth CarolinaSouth DakotaTennesseeTexasUtahVermontVirginiaWashingtonWest VirginiaWisconsinWyoming
Georgia Cities
AcworthAlbanyAlpharettaAmericusAthensAtlantaAugustaAustellBainbridgeBrunswickBufordCairoCantonCarrolltonCartersvilleColumbusCommerceConyersCovingtonCummingDallasDaltonDecaturDouglasDouglasvilleDuluthEllijayFayettevilleGainesvilleGriffinJesupJonesboroKennesawLagrangeLawrencevilleLithoniaMaconMariettaMc Rae HelenaMcdonoughMonroeMoultrieNewnanNorcrossRiverdaleRomeRoswellSavannahSmyrnaSnellvilleStatesboroStone MountainThomasvilleTiftonValdostaWarner RobinsWaycrossWoodstock
Compare Zip Codes
Comparison Subject
Compare StatesCompare CitiesCompare Zip Codes
Map of Zip Codes with the Highest Inequality / Gini Index in Commerce
0.36
0.45
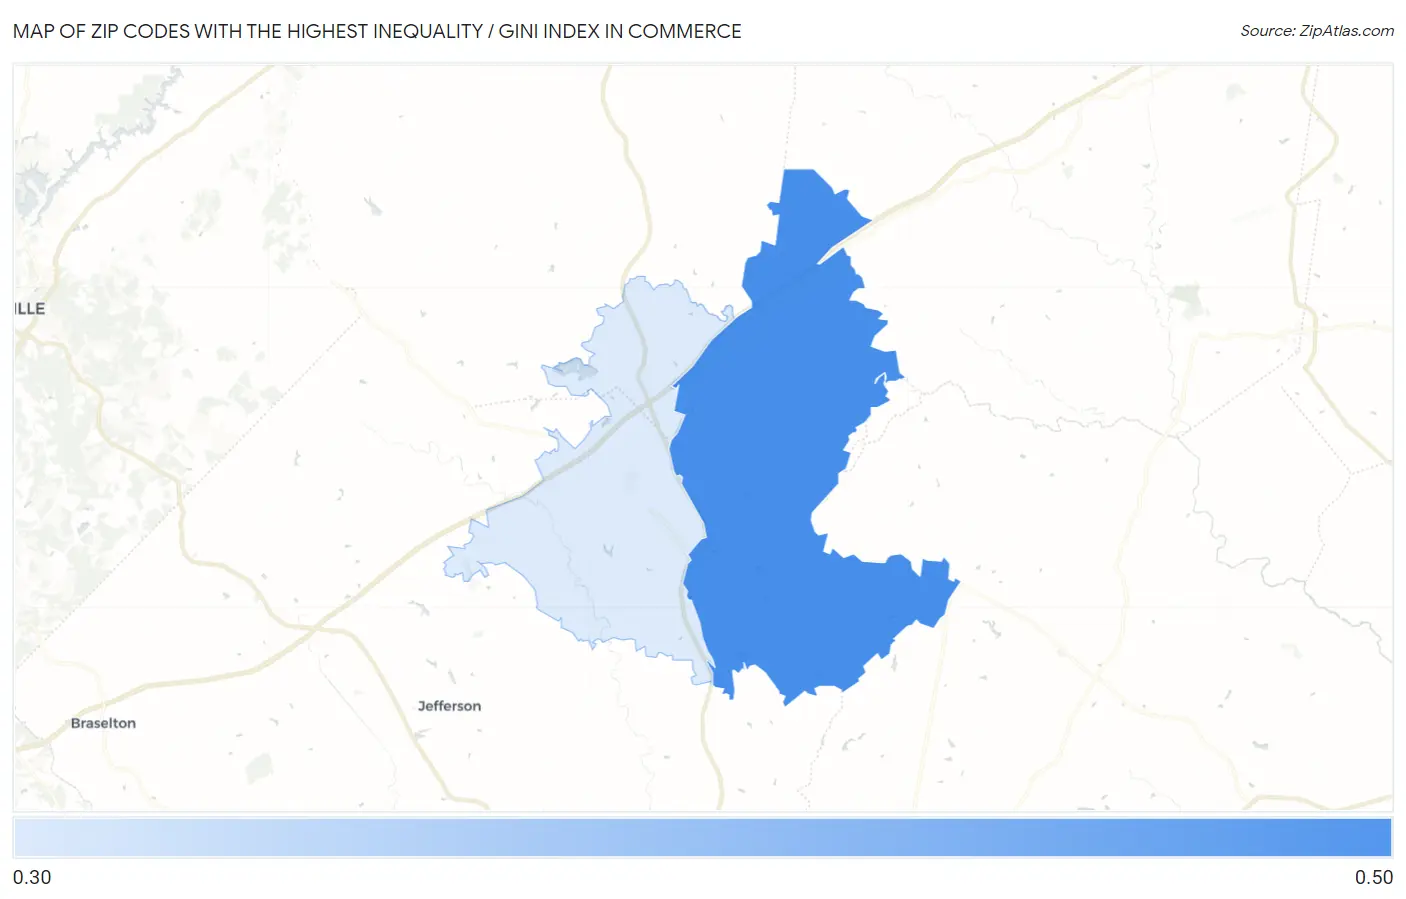
Zip Codes with the Highest Inequality / Gini Index in Commerce, GA
| Zip Code | Inequality / Gini Index | vs State | vs National | |
| 1. | 30530 | 0.45 | 0.48(-0.034)#305 | 0.48(-0.038)#10,509 |
| 2. | 30529 | 0.36 | 0.48(-0.118)#638 | 0.48(-0.123)#26,189 |
1
Common Questions
What are the Top Zip Codes with the Highest Inequality / Gini Index in Commerce, GA?
Top Zip Codes with the Highest Inequality / Gini Index in Commerce, GA are:
What zip code has the Highest Inequality / Gini Index in Commerce, GA?
30530 has the Highest Inequality / Gini Index in Commerce, GA with 0.45.
What is the Inequality / Gini Index in Commerce, GA?
Inequality / Gini Index in Commerce is 0.37.
What is the Inequality / Gini Index in Georgia?
Inequality / Gini Index in Georgia is 0.48.
What is the Inequality / Gini Index in the United States?
Inequality / Gini Index in the United States is 0.48.