Zip Codes with the Highest Percentage of Population Employed in Accommodation & Food Services in Brunswick, GA
RELATED REPORTS & OPTIONS
Accommodation & Food Services
Brunswick
Compare Zip Codes
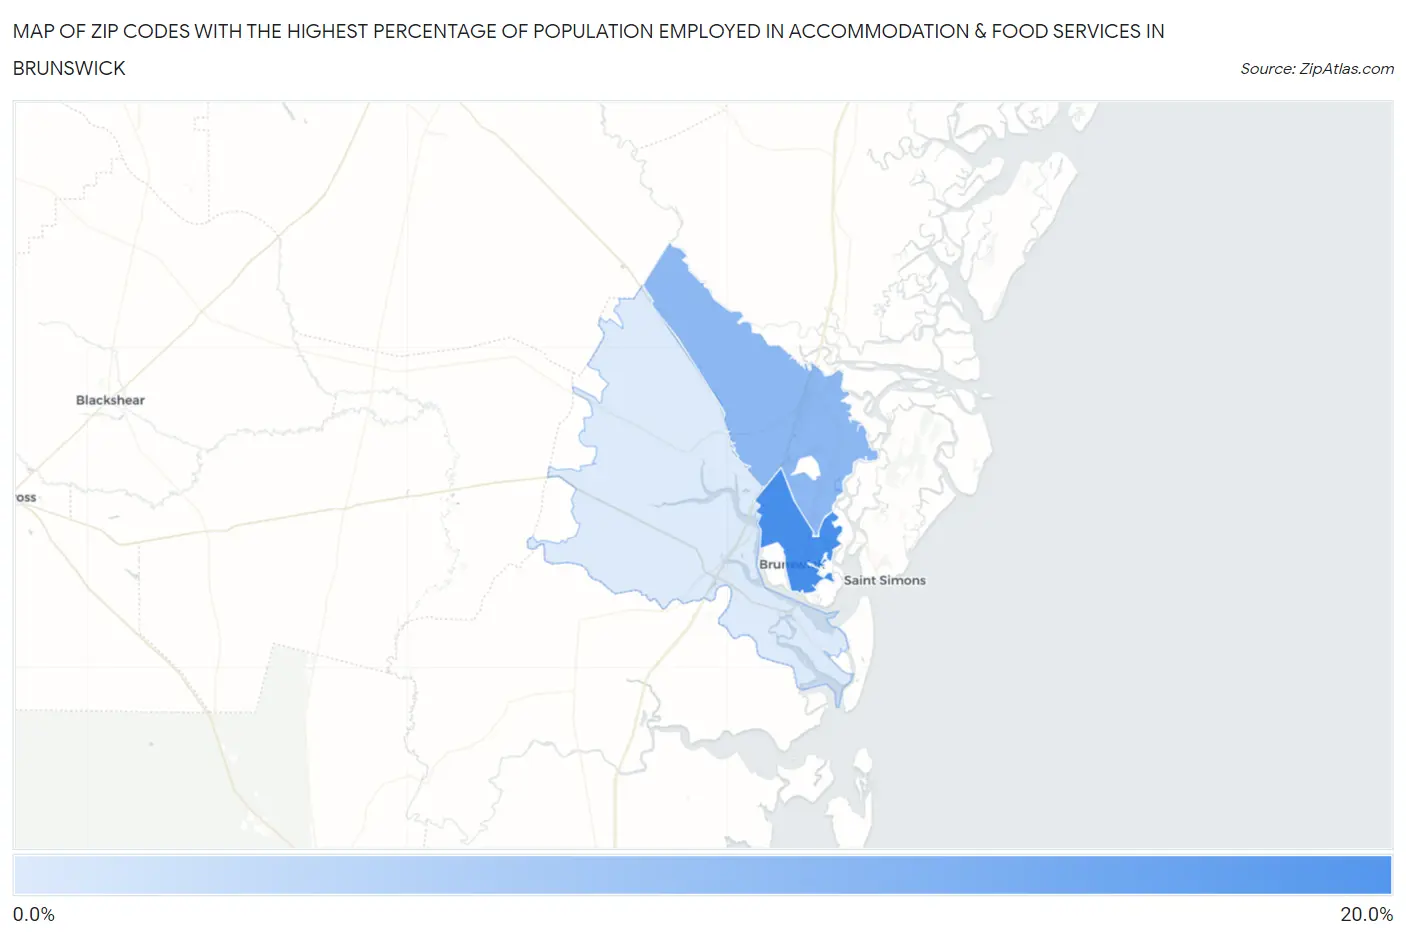
Map of Zip Codes with the Highest Percentage of Population Employed in Accommodation & Food Services in Brunswick
3.2%
18.1%
Zip Codes with the Highest Percentage of Population Employed in Accommodation & Food Services in Brunswick, GA
| Zip Code | % Employed | vs State | vs National | |
| 1. | 31520 | 18.1% | 7.2%(+10.9)#15 | 6.9%(+11.2)#1,076 |
| 2. | 31525 | 11.1% | 7.2%(+3.86)#72 | 6.9%(+4.18)#3,501 |
| 3. | 31523 | 3.2% | 7.2%(-4.00)#568 | 6.9%(-3.67)#22,686 |
1
Common Questions
What are the Top Zip Codes with the Highest Percentage of Population Employed in Accommodation & Food Services in Brunswick, GA?
Top Zip Codes with the Highest Percentage of Population Employed in Accommodation & Food Services in Brunswick, GA are:
What zip code has the Highest Percentage of Population Employed in Accommodation & Food Services in Brunswick, GA?
31520 has the Highest Percentage of Population Employed in Accommodation & Food Services in Brunswick, GA with 18.1%.
What is the Percentage of Population Employed in Accommodation & Food Services in Brunswick, GA?
Percentage of Population Employed in Accommodation & Food Services in Brunswick is 14.6%.
What is the Percentage of Population Employed in Accommodation & Food Services in Georgia?
Percentage of Population Employed in Accommodation & Food Services in Georgia is 7.2%.
What is the Percentage of Population Employed in Accommodation & Food Services in the United States?
Percentage of Population Employed in Accommodation & Food Services in the United States is 6.9%.