Guamanian/Chamorro vs Aleut Disability Age Over 75
COMPARE
Guamanian/Chamorro
Aleut
Disability Age Over 75
Disability Age Over 75 Comparison
Guamanians/Chamorros
Aleuts
49.4%
DISABILITY AGE OVER 75
0.0/ 100
METRIC RATING
279th/ 347
METRIC RANK
50.6%
DISABILITY AGE OVER 75
0.0/ 100
METRIC RATING
309th/ 347
METRIC RANK
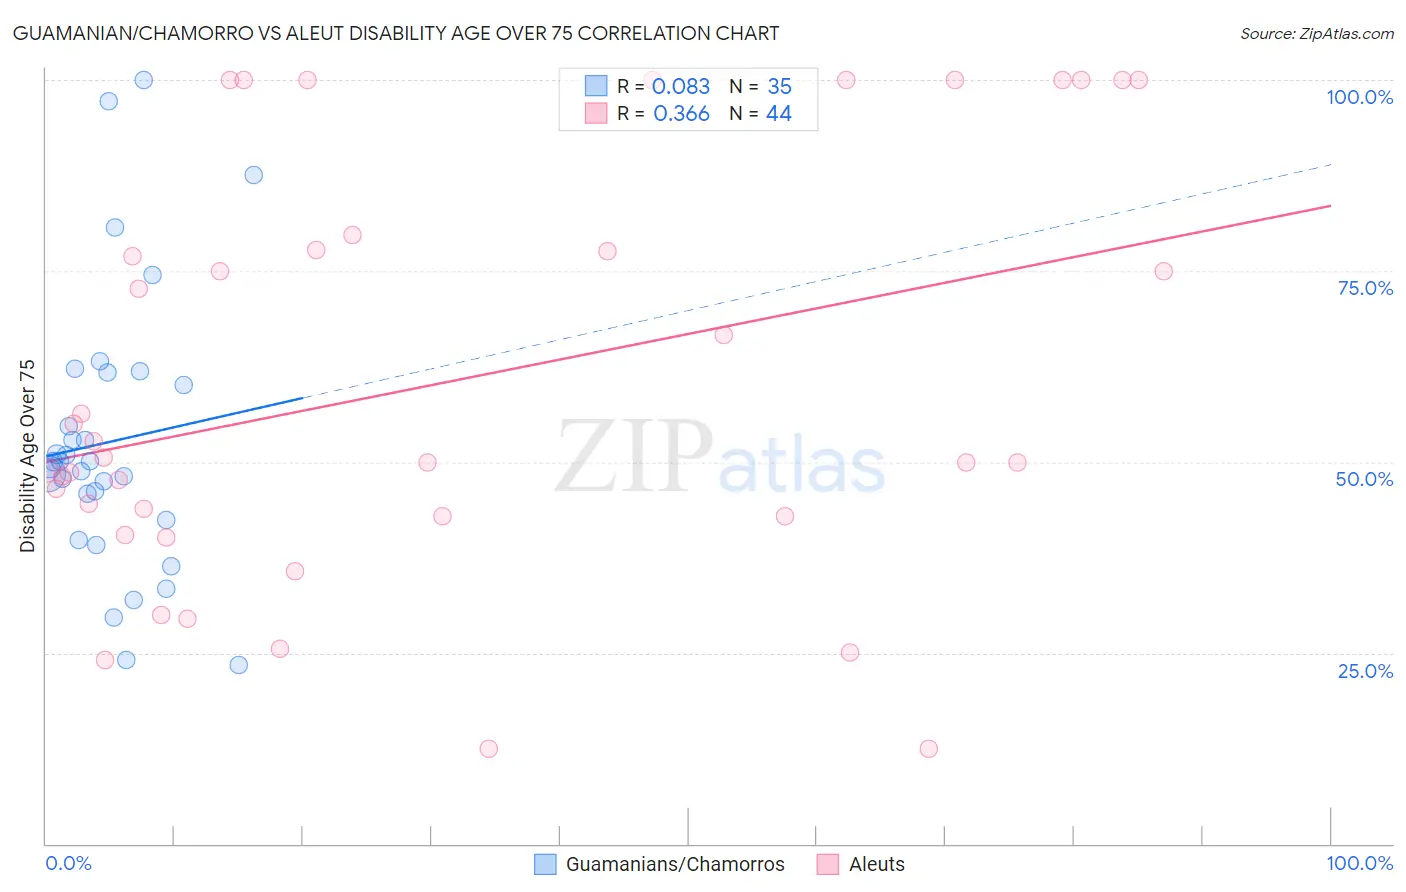
Guamanian/Chamorro vs Aleut Disability Age Over 75 Correlation Chart
The statistical analysis conducted on geographies consisting of 221,408,393 people shows a slight positive correlation between the proportion of Guamanians/Chamorros and percentage of population with a disability over the age of 75 in the United States with a correlation coefficient (R) of 0.083 and weighted average of 49.4%. Similarly, the statistical analysis conducted on geographies consisting of 61,756,409 people shows a mild positive correlation between the proportion of Aleuts and percentage of population with a disability over the age of 75 in the United States with a correlation coefficient (R) of 0.366 and weighted average of 50.6%, a difference of 2.4%.
Disability Age Over 75 Correlation Summary
| Measurement | Guamanian/Chamorro | Aleut |
| Minimum | 23.3% | 12.5% |
| Maximum | 100.0% | 100.0% |
| Range | 76.7% | 87.5% |
| Mean | 52.7% | 60.3% |
| Median | 50.0% | 50.3% |
| Interquartile 25% (IQ1) | 42.4% | 42.9% |
| Interquartile 75% (IQ3) | 61.7% | 78.7% |
| Interquartile Range (IQR) | 19.3% | 35.9% |
| Standard Deviation (Sample) | 18.1% | 27.1% |
| Standard Deviation (Population) | 17.8% | 26.8% |
Similar Demographics by Disability Age Over 75
Demographics Similar to Guamanians/Chamorros by Disability Age Over 75
In terms of disability age over 75, the demographic groups most similar to Guamanians/Chamorros are Bangladeshi (49.4%, a difference of 0.060%), Belizean (49.4%, a difference of 0.070%), Black/African American (49.5%, a difference of 0.21%), Samoan (49.5%, a difference of 0.24%), and Immigrants from Latin America (49.5%, a difference of 0.29%).
| Demographics | Rating | Rank | Disability Age Over 75 |
| Assyrians/Chaldeans/Syriacs | 0.2 /100 | #272 | Tragic 49.1% |
| Immigrants | Iraq | 0.1 /100 | #273 | Tragic 49.1% |
| Immigrants | Guatemala | 0.1 /100 | #274 | Tragic 49.1% |
| Immigrants | Dominica | 0.1 /100 | #275 | Tragic 49.1% |
| Immigrants | Uzbekistan | 0.1 /100 | #276 | Tragic 49.2% |
| Hawaiians | 0.1 /100 | #277 | Tragic 49.2% |
| Immigrants | Laos | 0.1 /100 | #278 | Tragic 49.2% |
| Guamanians/Chamorros | 0.0 /100 | #279 | Tragic 49.4% |
| Bangladeshis | 0.0 /100 | #280 | Tragic 49.4% |
| Belizeans | 0.0 /100 | #281 | Tragic 49.4% |
| Blacks/African Americans | 0.0 /100 | #282 | Tragic 49.5% |
| Samoans | 0.0 /100 | #283 | Tragic 49.5% |
| Immigrants | Latin America | 0.0 /100 | #284 | Tragic 49.5% |
| Crow | 0.0 /100 | #285 | Tragic 49.6% |
| Immigrants | Belize | 0.0 /100 | #286 | Tragic 49.6% |
Demographics Similar to Aleuts by Disability Age Over 75
In terms of disability age over 75, the demographic groups most similar to Aleuts are Hispanic or Latino (50.6%, a difference of 0.0%), Immigrants from Fiji (50.6%, a difference of 0.030%), Tlingit-Haida (50.6%, a difference of 0.040%), Immigrants from Central America (50.5%, a difference of 0.080%), and Cajun (50.7%, a difference of 0.14%).
| Demographics | Rating | Rank | Disability Age Over 75 |
| Cherokee | 0.0 /100 | #302 | Tragic 50.2% |
| Japanese | 0.0 /100 | #303 | Tragic 50.2% |
| Immigrants | Dominican Republic | 0.0 /100 | #304 | Tragic 50.3% |
| Central American Indians | 0.0 /100 | #305 | Tragic 50.5% |
| Immigrants | Central America | 0.0 /100 | #306 | Tragic 50.5% |
| Immigrants | Fiji | 0.0 /100 | #307 | Tragic 50.6% |
| Hispanics or Latinos | 0.0 /100 | #308 | Tragic 50.6% |
| Aleuts | 0.0 /100 | #309 | Tragic 50.6% |
| Tlingit-Haida | 0.0 /100 | #310 | Tragic 50.6% |
| Cajuns | 0.0 /100 | #311 | Tragic 50.7% |
| Cheyenne | 0.0 /100 | #312 | Tragic 50.9% |
| Immigrants | Azores | 0.0 /100 | #313 | Tragic 50.9% |
| Immigrants | Mexico | 0.0 /100 | #314 | Tragic 51.1% |
| Mexicans | 0.0 /100 | #315 | Tragic 51.1% |
| Chickasaw | 0.0 /100 | #316 | Tragic 51.2% |