Guamanian/Chamorro vs Immigrants from Philippines Disability Age Over 75
COMPARE
Guamanian/Chamorro
Immigrants from Philippines
Disability Age Over 75
Disability Age Over 75 Comparison
Guamanians/Chamorros
Immigrants from Philippines
49.4%
DISABILITY AGE OVER 75
0.0/ 100
METRIC RATING
279th/ 347
METRIC RANK
48.8%
DISABILITY AGE OVER 75
0.4/ 100
METRIC RATING
258th/ 347
METRIC RANK
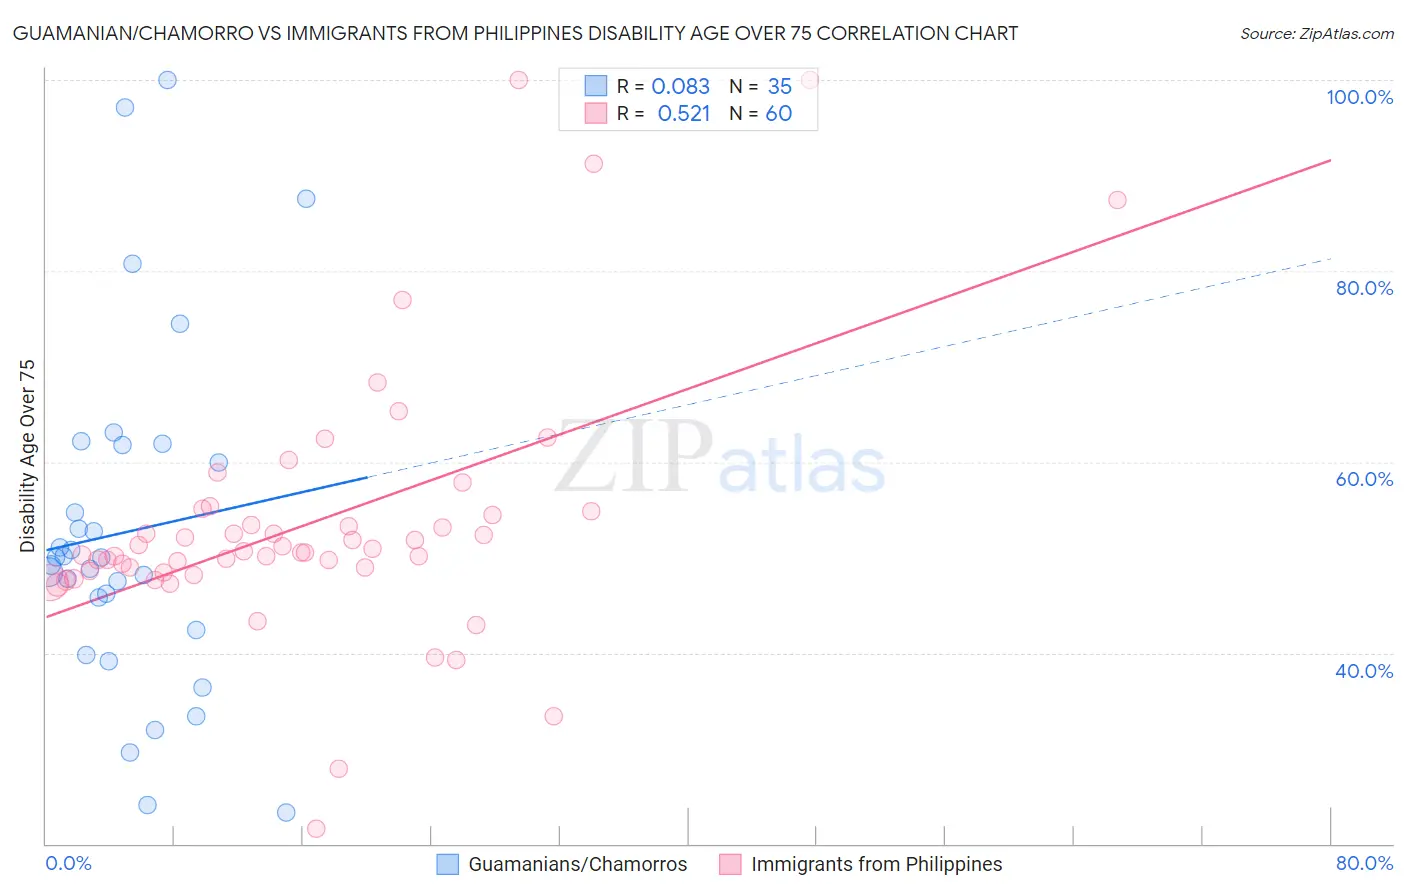
Guamanian/Chamorro vs Immigrants from Philippines Disability Age Over 75 Correlation Chart
The statistical analysis conducted on geographies consisting of 221,408,393 people shows a slight positive correlation between the proportion of Guamanians/Chamorros and percentage of population with a disability over the age of 75 in the United States with a correlation coefficient (R) of 0.083 and weighted average of 49.4%. Similarly, the statistical analysis conducted on geographies consisting of 470,204,891 people shows a substantial positive correlation between the proportion of Immigrants from Philippines and percentage of population with a disability over the age of 75 in the United States with a correlation coefficient (R) of 0.521 and weighted average of 48.8%, a difference of 1.3%.
Disability Age Over 75 Correlation Summary
| Measurement | Guamanian/Chamorro | Immigrants from Philippines |
| Minimum | 23.3% | 21.6% |
| Maximum | 100.0% | 100.0% |
| Range | 76.7% | 78.4% |
| Mean | 52.7% | 53.6% |
| Median | 50.0% | 50.6% |
| Interquartile 25% (IQ1) | 42.4% | 48.5% |
| Interquartile 75% (IQ3) | 61.7% | 54.6% |
| Interquartile Range (IQR) | 19.3% | 6.2% |
| Standard Deviation (Sample) | 18.1% | 13.8% |
| Standard Deviation (Population) | 17.8% | 13.7% |
Similar Demographics by Disability Age Over 75
Demographics Similar to Guamanians/Chamorros by Disability Age Over 75
In terms of disability age over 75, the demographic groups most similar to Guamanians/Chamorros are Bangladeshi (49.4%, a difference of 0.060%), Belizean (49.4%, a difference of 0.070%), Black/African American (49.5%, a difference of 0.21%), Samoan (49.5%, a difference of 0.24%), and Immigrants from Latin America (49.5%, a difference of 0.29%).
| Demographics | Rating | Rank | Disability Age Over 75 |
| Assyrians/Chaldeans/Syriacs | 0.2 /100 | #272 | Tragic 49.1% |
| Immigrants | Iraq | 0.1 /100 | #273 | Tragic 49.1% |
| Immigrants | Guatemala | 0.1 /100 | #274 | Tragic 49.1% |
| Immigrants | Dominica | 0.1 /100 | #275 | Tragic 49.1% |
| Immigrants | Uzbekistan | 0.1 /100 | #276 | Tragic 49.2% |
| Hawaiians | 0.1 /100 | #277 | Tragic 49.2% |
| Immigrants | Laos | 0.1 /100 | #278 | Tragic 49.2% |
| Guamanians/Chamorros | 0.0 /100 | #279 | Tragic 49.4% |
| Bangladeshis | 0.0 /100 | #280 | Tragic 49.4% |
| Belizeans | 0.0 /100 | #281 | Tragic 49.4% |
| Blacks/African Americans | 0.0 /100 | #282 | Tragic 49.5% |
| Samoans | 0.0 /100 | #283 | Tragic 49.5% |
| Immigrants | Latin America | 0.0 /100 | #284 | Tragic 49.5% |
| Crow | 0.0 /100 | #285 | Tragic 49.6% |
| Immigrants | Belize | 0.0 /100 | #286 | Tragic 49.6% |
Demographics Similar to Immigrants from Philippines by Disability Age Over 75
In terms of disability age over 75, the demographic groups most similar to Immigrants from Philippines are Blackfeet (48.8%, a difference of 0.040%), Central American (48.8%, a difference of 0.070%), Immigrants from Congo (48.7%, a difference of 0.090%), Chinese (48.7%, a difference of 0.10%), and Immigrants from Afghanistan (48.8%, a difference of 0.11%).
| Demographics | Rating | Rank | Disability Age Over 75 |
| Koreans | 0.8 /100 | #251 | Tragic 48.6% |
| Immigrants | South Eastern Asia | 0.7 /100 | #252 | Tragic 48.7% |
| British West Indians | 0.6 /100 | #253 | Tragic 48.7% |
| Immigrants | Vietnam | 0.6 /100 | #254 | Tragic 48.7% |
| Chinese | 0.5 /100 | #255 | Tragic 48.7% |
| Immigrants | Congo | 0.5 /100 | #256 | Tragic 48.7% |
| Blackfeet | 0.5 /100 | #257 | Tragic 48.8% |
| Immigrants | Philippines | 0.4 /100 | #258 | Tragic 48.8% |
| Central Americans | 0.4 /100 | #259 | Tragic 48.8% |
| Immigrants | Afghanistan | 0.4 /100 | #260 | Tragic 48.8% |
| Africans | 0.3 /100 | #261 | Tragic 48.9% |
| Immigrants | West Indies | 0.3 /100 | #262 | Tragic 48.9% |
| Salvadorans | 0.3 /100 | #263 | Tragic 48.9% |
| Immigrants | Honduras | 0.3 /100 | #264 | Tragic 48.9% |
| Hondurans | 0.3 /100 | #265 | Tragic 48.9% |