Guamanian/Chamorro vs Immigrants from Ghana Disability Age Over 75
COMPARE
Guamanian/Chamorro
Immigrants from Ghana
Disability Age Over 75
Disability Age Over 75 Comparison
Guamanians/Chamorros
Immigrants from Ghana
49.4%
DISABILITY AGE OVER 75
0.0/ 100
METRIC RATING
279th/ 347
METRIC RANK
47.7%
DISABILITY AGE OVER 75
19.1/ 100
METRIC RATING
205th/ 347
METRIC RANK
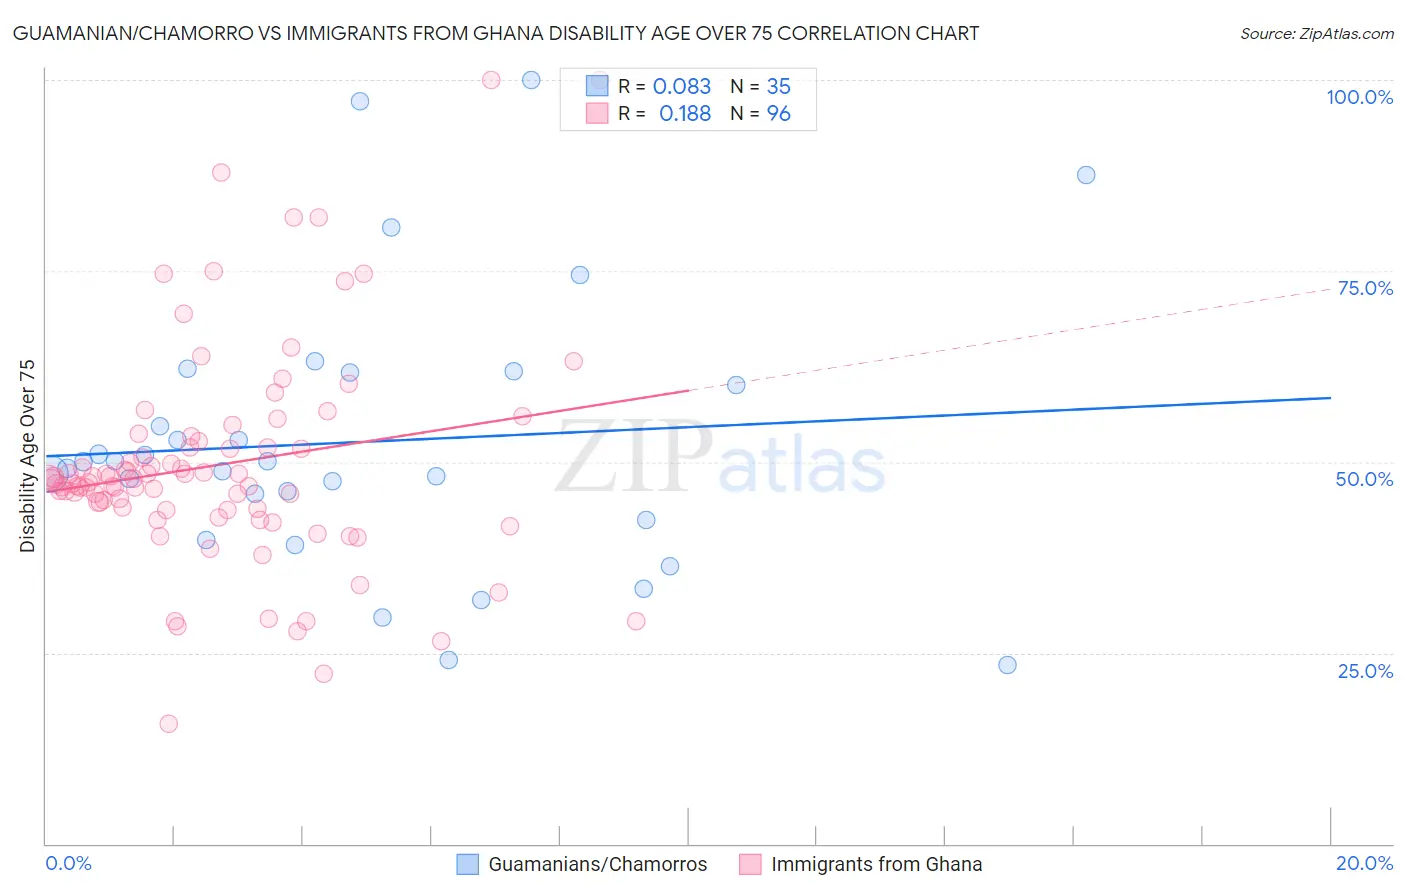
Guamanian/Chamorro vs Immigrants from Ghana Disability Age Over 75 Correlation Chart
The statistical analysis conducted on geographies consisting of 221,408,393 people shows a slight positive correlation between the proportion of Guamanians/Chamorros and percentage of population with a disability over the age of 75 in the United States with a correlation coefficient (R) of 0.083 and weighted average of 49.4%. Similarly, the statistical analysis conducted on geographies consisting of 199,494,871 people shows a poor positive correlation between the proportion of Immigrants from Ghana and percentage of population with a disability over the age of 75 in the United States with a correlation coefficient (R) of 0.188 and weighted average of 47.7%, a difference of 3.5%.
Disability Age Over 75 Correlation Summary
| Measurement | Guamanian/Chamorro | Immigrants from Ghana |
| Minimum | 23.3% | 15.7% |
| Maximum | 100.0% | 100.0% |
| Range | 76.7% | 84.3% |
| Mean | 52.7% | 49.6% |
| Median | 50.0% | 47.4% |
| Interquartile 25% (IQ1) | 42.4% | 43.8% |
| Interquartile 75% (IQ3) | 61.7% | 52.3% |
| Interquartile Range (IQR) | 19.3% | 8.6% |
| Standard Deviation (Sample) | 18.1% | 14.4% |
| Standard Deviation (Population) | 17.8% | 14.3% |
Similar Demographics by Disability Age Over 75
Demographics Similar to Guamanians/Chamorros by Disability Age Over 75
In terms of disability age over 75, the demographic groups most similar to Guamanians/Chamorros are Bangladeshi (49.4%, a difference of 0.060%), Belizean (49.4%, a difference of 0.070%), Black/African American (49.5%, a difference of 0.21%), Samoan (49.5%, a difference of 0.24%), and Immigrants from Latin America (49.5%, a difference of 0.29%).
| Demographics | Rating | Rank | Disability Age Over 75 |
| Assyrians/Chaldeans/Syriacs | 0.2 /100 | #272 | Tragic 49.1% |
| Immigrants | Iraq | 0.1 /100 | #273 | Tragic 49.1% |
| Immigrants | Guatemala | 0.1 /100 | #274 | Tragic 49.1% |
| Immigrants | Dominica | 0.1 /100 | #275 | Tragic 49.1% |
| Immigrants | Uzbekistan | 0.1 /100 | #276 | Tragic 49.2% |
| Hawaiians | 0.1 /100 | #277 | Tragic 49.2% |
| Immigrants | Laos | 0.1 /100 | #278 | Tragic 49.2% |
| Guamanians/Chamorros | 0.0 /100 | #279 | Tragic 49.4% |
| Bangladeshis | 0.0 /100 | #280 | Tragic 49.4% |
| Belizeans | 0.0 /100 | #281 | Tragic 49.4% |
| Blacks/African Americans | 0.0 /100 | #282 | Tragic 49.5% |
| Samoans | 0.0 /100 | #283 | Tragic 49.5% |
| Immigrants | Latin America | 0.0 /100 | #284 | Tragic 49.5% |
| Crow | 0.0 /100 | #285 | Tragic 49.6% |
| Immigrants | Belize | 0.0 /100 | #286 | Tragic 49.6% |
Demographics Similar to Immigrants from Ghana by Disability Age Over 75
In terms of disability age over 75, the demographic groups most similar to Immigrants from Ghana are Jamaican (47.7%, a difference of 0.0%), Nigerian (47.7%, a difference of 0.010%), Trinidadian and Tobagonian (47.7%, a difference of 0.030%), Immigrants from Cuba (47.7%, a difference of 0.060%), and Immigrants from Bahamas (47.7%, a difference of 0.060%).
| Demographics | Rating | Rank | Disability Age Over 75 |
| Immigrants | Ukraine | 23.2 /100 | #198 | Fair 47.7% |
| Immigrants | Eritrea | 22.4 /100 | #199 | Fair 47.7% |
| Immigrants | Somalia | 21.4 /100 | #200 | Fair 47.7% |
| Immigrants | Cuba | 20.9 /100 | #201 | Fair 47.7% |
| Immigrants | Bahamas | 20.7 /100 | #202 | Fair 47.7% |
| Trinidadians and Tobagonians | 20.0 /100 | #203 | Fair 47.7% |
| Nigerians | 19.2 /100 | #204 | Poor 47.7% |
| Immigrants | Ghana | 19.1 /100 | #205 | Poor 47.7% |
| Jamaicans | 19.0 /100 | #206 | Poor 47.7% |
| Immigrants | Syria | 17.4 /100 | #207 | Poor 47.8% |
| Immigrants | Senegal | 16.9 /100 | #208 | Poor 47.8% |
| Immigrants | Indonesia | 14.2 /100 | #209 | Poor 47.8% |
| Vietnamese | 11.9 /100 | #210 | Poor 47.9% |
| Panamanians | 11.8 /100 | #211 | Poor 47.9% |
| Immigrants | Burma/Myanmar | 11.7 /100 | #212 | Poor 47.9% |