Guamanian/Chamorro vs Immigrants from Honduras Disability Age Over 75
COMPARE
Guamanian/Chamorro
Immigrants from Honduras
Disability Age Over 75
Disability Age Over 75 Comparison
Guamanians/Chamorros
Immigrants from Honduras
49.4%
DISABILITY AGE OVER 75
0.0/ 100
METRIC RATING
279th/ 347
METRIC RANK
48.9%
DISABILITY AGE OVER 75
0.3/ 100
METRIC RATING
264th/ 347
METRIC RANK
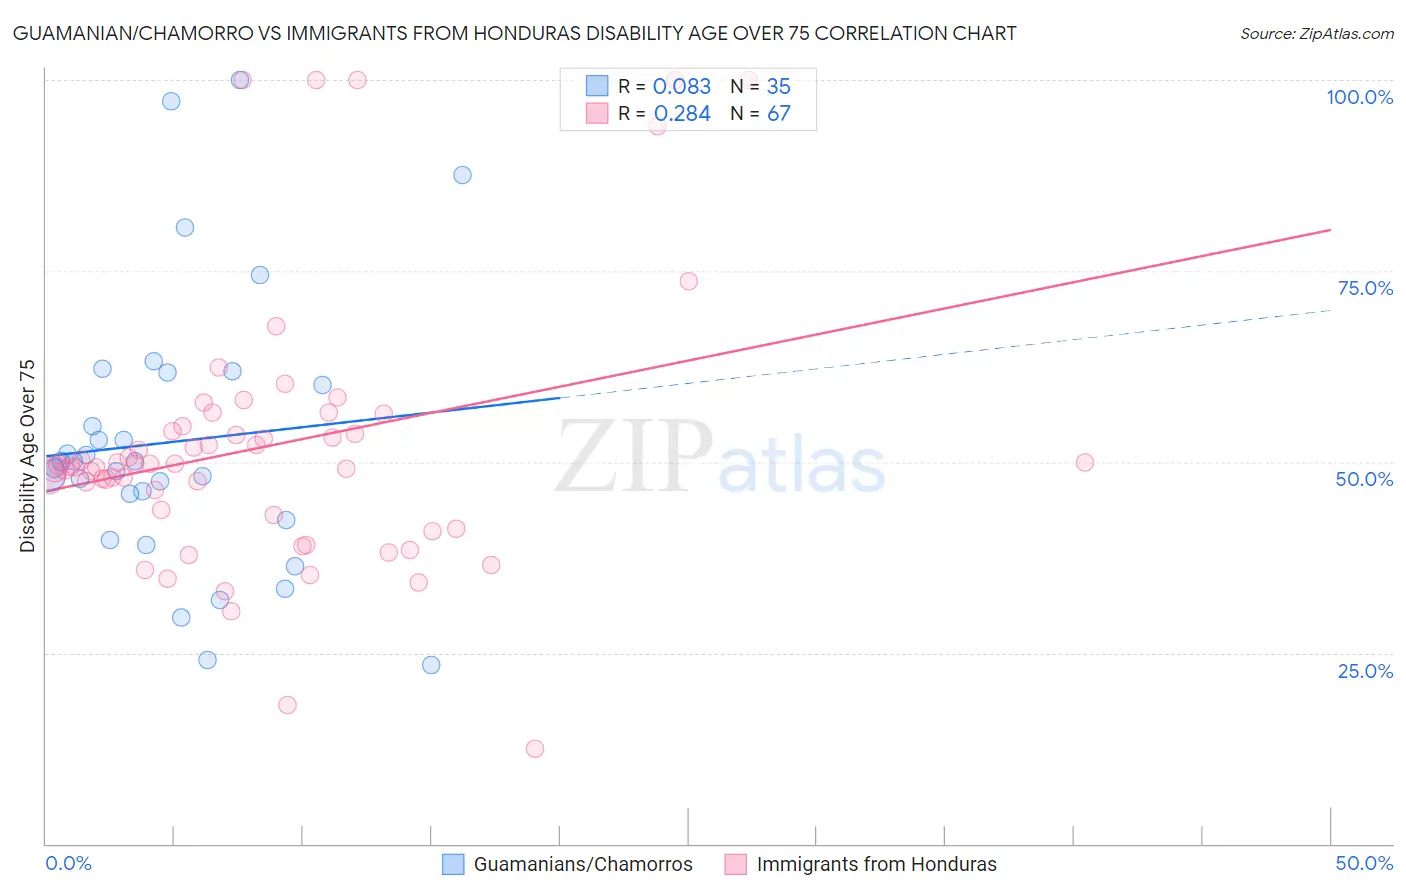
Guamanian/Chamorro vs Immigrants from Honduras Disability Age Over 75 Correlation Chart
The statistical analysis conducted on geographies consisting of 221,408,393 people shows a slight positive correlation between the proportion of Guamanians/Chamorros and percentage of population with a disability over the age of 75 in the United States with a correlation coefficient (R) of 0.083 and weighted average of 49.4%. Similarly, the statistical analysis conducted on geographies consisting of 322,249,415 people shows a weak positive correlation between the proportion of Immigrants from Honduras and percentage of population with a disability over the age of 75 in the United States with a correlation coefficient (R) of 0.284 and weighted average of 48.9%, a difference of 0.96%.
Disability Age Over 75 Correlation Summary
| Measurement | Guamanian/Chamorro | Immigrants from Honduras |
| Minimum | 23.3% | 12.5% |
| Maximum | 100.0% | 100.0% |
| Range | 76.7% | 87.5% |
| Mean | 52.7% | 52.1% |
| Median | 50.0% | 49.6% |
| Interquartile 25% (IQ1) | 42.4% | 43.1% |
| Interquartile 75% (IQ3) | 61.7% | 54.6% |
| Interquartile Range (IQR) | 19.3% | 11.5% |
| Standard Deviation (Sample) | 18.1% | 17.8% |
| Standard Deviation (Population) | 17.8% | 17.6% |
Demographics Similar to Guamanians/Chamorros and Immigrants from Honduras by Disability Age Over 75
In terms of disability age over 75, the demographic groups most similar to Guamanians/Chamorros are Bangladeshi (49.4%, a difference of 0.060%), Belizean (49.4%, a difference of 0.070%), Immigrants from Laos (49.2%, a difference of 0.38%), Hawaiian (49.2%, a difference of 0.42%), and Immigrants from Uzbekistan (49.2%, a difference of 0.44%). Similarly, the demographic groups most similar to Immigrants from Honduras are Honduran (48.9%, a difference of 0.010%), U.S. Virgin Islander (48.9%, a difference of 0.040%), Salvadoran (48.9%, a difference of 0.050%), Immigrants from West Indies (48.9%, a difference of 0.070%), and African (48.9%, a difference of 0.13%).
| Demographics | Rating | Rank | Disability Age Over 75 |
| Africans | 0.3 /100 | #261 | Tragic 48.9% |
| Immigrants | West Indies | 0.3 /100 | #262 | Tragic 48.9% |
| Salvadorans | 0.3 /100 | #263 | Tragic 48.9% |
| Immigrants | Honduras | 0.3 /100 | #264 | Tragic 48.9% |
| Hondurans | 0.3 /100 | #265 | Tragic 48.9% |
| U.S. Virgin Islanders | 0.2 /100 | #266 | Tragic 48.9% |
| Malaysians | 0.2 /100 | #267 | Tragic 49.0% |
| Guatemalans | 0.2 /100 | #268 | Tragic 49.0% |
| Immigrants | El Salvador | 0.2 /100 | #269 | Tragic 49.0% |
| Potawatomi | 0.2 /100 | #270 | Tragic 49.0% |
| Fijians | 0.2 /100 | #271 | Tragic 49.0% |
| Assyrians/Chaldeans/Syriacs | 0.2 /100 | #272 | Tragic 49.1% |
| Immigrants | Iraq | 0.1 /100 | #273 | Tragic 49.1% |
| Immigrants | Guatemala | 0.1 /100 | #274 | Tragic 49.1% |
| Immigrants | Dominica | 0.1 /100 | #275 | Tragic 49.1% |
| Immigrants | Uzbekistan | 0.1 /100 | #276 | Tragic 49.2% |
| Hawaiians | 0.1 /100 | #277 | Tragic 49.2% |
| Immigrants | Laos | 0.1 /100 | #278 | Tragic 49.2% |
| Guamanians/Chamorros | 0.0 /100 | #279 | Tragic 49.4% |
| Bangladeshis | 0.0 /100 | #280 | Tragic 49.4% |
| Belizeans | 0.0 /100 | #281 | Tragic 49.4% |