Guamanian/Chamorro vs Spaniard Disability Age Over 75
COMPARE
Guamanian/Chamorro
Spaniard
Disability Age Over 75
Disability Age Over 75 Comparison
Guamanians/Chamorros
Spaniards
49.4%
DISABILITY AGE OVER 75
0.0/ 100
METRIC RATING
279th/ 347
METRIC RANK
48.1%
DISABILITY AGE OVER 75
5.7/ 100
METRIC RATING
229th/ 347
METRIC RANK
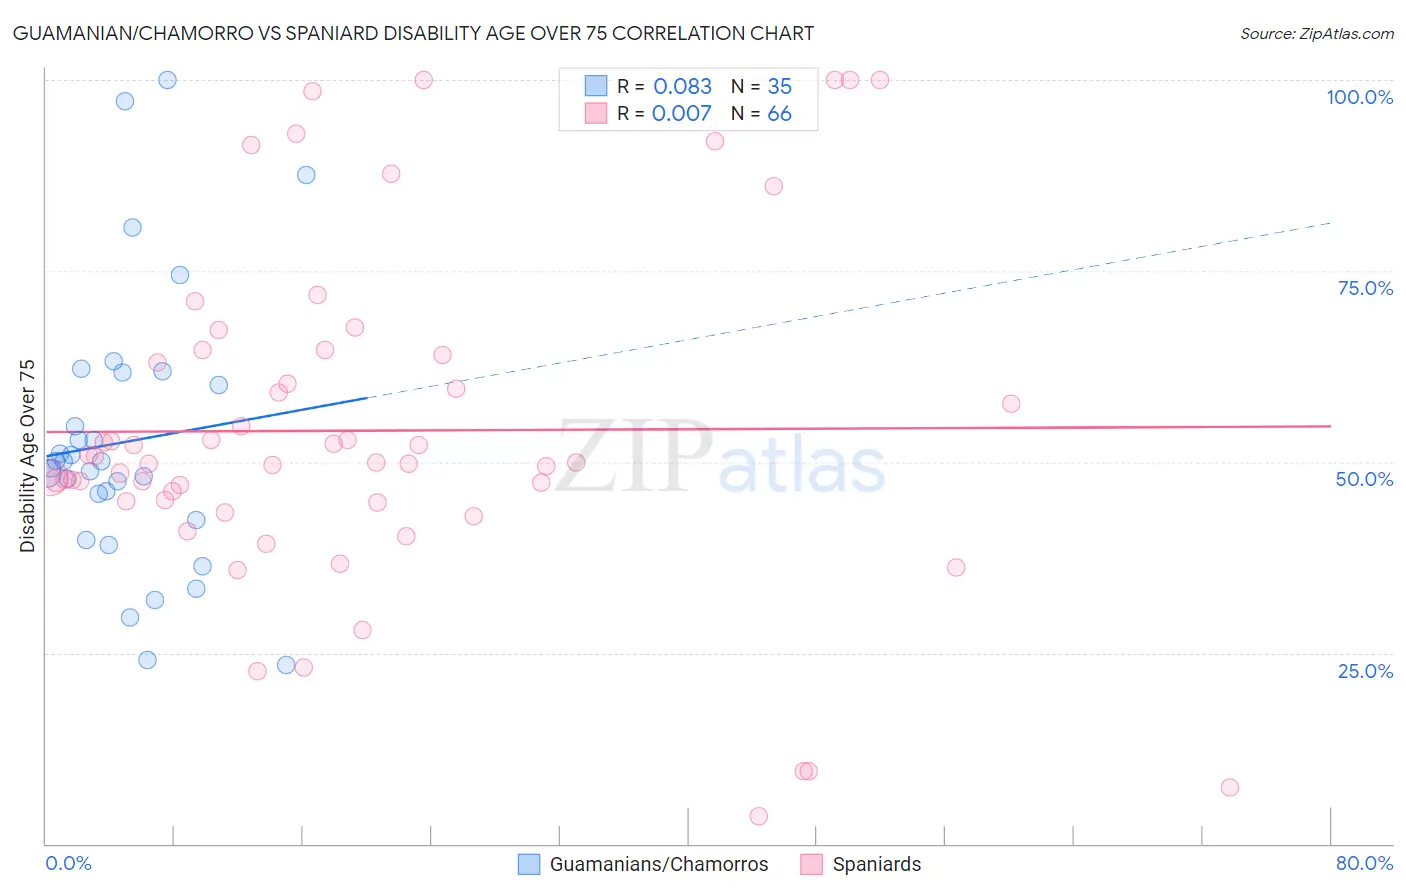
Guamanian/Chamorro vs Spaniard Disability Age Over 75 Correlation Chart
The statistical analysis conducted on geographies consisting of 221,408,393 people shows a slight positive correlation between the proportion of Guamanians/Chamorros and percentage of population with a disability over the age of 75 in the United States with a correlation coefficient (R) of 0.083 and weighted average of 49.4%. Similarly, the statistical analysis conducted on geographies consisting of 442,367,902 people shows no correlation between the proportion of Spaniards and percentage of population with a disability over the age of 75 in the United States with a correlation coefficient (R) of 0.007 and weighted average of 48.1%, a difference of 2.7%.
Disability Age Over 75 Correlation Summary
| Measurement | Guamanian/Chamorro | Spaniard |
| Minimum | 23.3% | 3.6% |
| Maximum | 100.0% | 100.0% |
| Range | 76.7% | 96.4% |
| Mean | 52.7% | 54.1% |
| Median | 50.0% | 50.0% |
| Interquartile 25% (IQ1) | 42.4% | 44.8% |
| Interquartile 75% (IQ3) | 61.7% | 64.0% |
| Interquartile Range (IQR) | 19.3% | 19.1% |
| Standard Deviation (Sample) | 18.1% | 22.3% |
| Standard Deviation (Population) | 17.8% | 22.1% |
Similar Demographics by Disability Age Over 75
Demographics Similar to Guamanians/Chamorros by Disability Age Over 75
In terms of disability age over 75, the demographic groups most similar to Guamanians/Chamorros are Bangladeshi (49.4%, a difference of 0.060%), Belizean (49.4%, a difference of 0.070%), Black/African American (49.5%, a difference of 0.21%), Samoan (49.5%, a difference of 0.24%), and Immigrants from Latin America (49.5%, a difference of 0.29%).
| Demographics | Rating | Rank | Disability Age Over 75 |
| Assyrians/Chaldeans/Syriacs | 0.2 /100 | #272 | Tragic 49.1% |
| Immigrants | Iraq | 0.1 /100 | #273 | Tragic 49.1% |
| Immigrants | Guatemala | 0.1 /100 | #274 | Tragic 49.1% |
| Immigrants | Dominica | 0.1 /100 | #275 | Tragic 49.1% |
| Immigrants | Uzbekistan | 0.1 /100 | #276 | Tragic 49.2% |
| Hawaiians | 0.1 /100 | #277 | Tragic 49.2% |
| Immigrants | Laos | 0.1 /100 | #278 | Tragic 49.2% |
| Guamanians/Chamorros | 0.0 /100 | #279 | Tragic 49.4% |
| Bangladeshis | 0.0 /100 | #280 | Tragic 49.4% |
| Belizeans | 0.0 /100 | #281 | Tragic 49.4% |
| Blacks/African Americans | 0.0 /100 | #282 | Tragic 49.5% |
| Samoans | 0.0 /100 | #283 | Tragic 49.5% |
| Immigrants | Latin America | 0.0 /100 | #284 | Tragic 49.5% |
| Crow | 0.0 /100 | #285 | Tragic 49.6% |
| Immigrants | Belize | 0.0 /100 | #286 | Tragic 49.6% |
Demographics Similar to Spaniards by Disability Age Over 75
In terms of disability age over 75, the demographic groups most similar to Spaniards are Immigrants from Liberia (48.1%, a difference of 0.020%), Nonimmigrants (48.0%, a difference of 0.070%), Zimbabwean (48.1%, a difference of 0.070%), Spanish (48.0%, a difference of 0.080%), and Liberian (48.0%, a difference of 0.090%).
| Demographics | Rating | Rank | Disability Age Over 75 |
| Barbadians | 6.8 /100 | #222 | Tragic 48.0% |
| Immigrants | Bangladesh | 6.8 /100 | #223 | Tragic 48.0% |
| Liberians | 6.7 /100 | #224 | Tragic 48.0% |
| Spanish | 6.5 /100 | #225 | Tragic 48.0% |
| Immigrants | Nonimmigrants | 6.5 /100 | #226 | Tragic 48.0% |
| Zimbabweans | 6.4 /100 | #227 | Tragic 48.1% |
| Immigrants | Liberia | 5.9 /100 | #228 | Tragic 48.1% |
| Spaniards | 5.7 /100 | #229 | Tragic 48.1% |
| Taiwanese | 4.4 /100 | #230 | Tragic 48.2% |
| Immigrants | Immigrants | 4.3 /100 | #231 | Tragic 48.2% |
| Indonesians | 4.2 /100 | #232 | Tragic 48.2% |
| Cree | 4.2 /100 | #233 | Tragic 48.2% |
| Sub-Saharan Africans | 3.8 /100 | #234 | Tragic 48.2% |
| Hmong | 3.8 /100 | #235 | Tragic 48.2% |
| Immigrants | Nicaragua | 3.2 /100 | #236 | Tragic 48.2% |