Guamanian/Chamorro vs Dutch Disability Age Over 75
COMPARE
Guamanian/Chamorro
Dutch
Disability Age Over 75
Disability Age Over 75 Comparison
Guamanians/Chamorros
Dutch
49.4%
DISABILITY AGE OVER 75
0.0/ 100
METRIC RATING
279th/ 347
METRIC RANK
46.5%
DISABILITY AGE OVER 75
95.9/ 100
METRIC RATING
114th/ 347
METRIC RANK
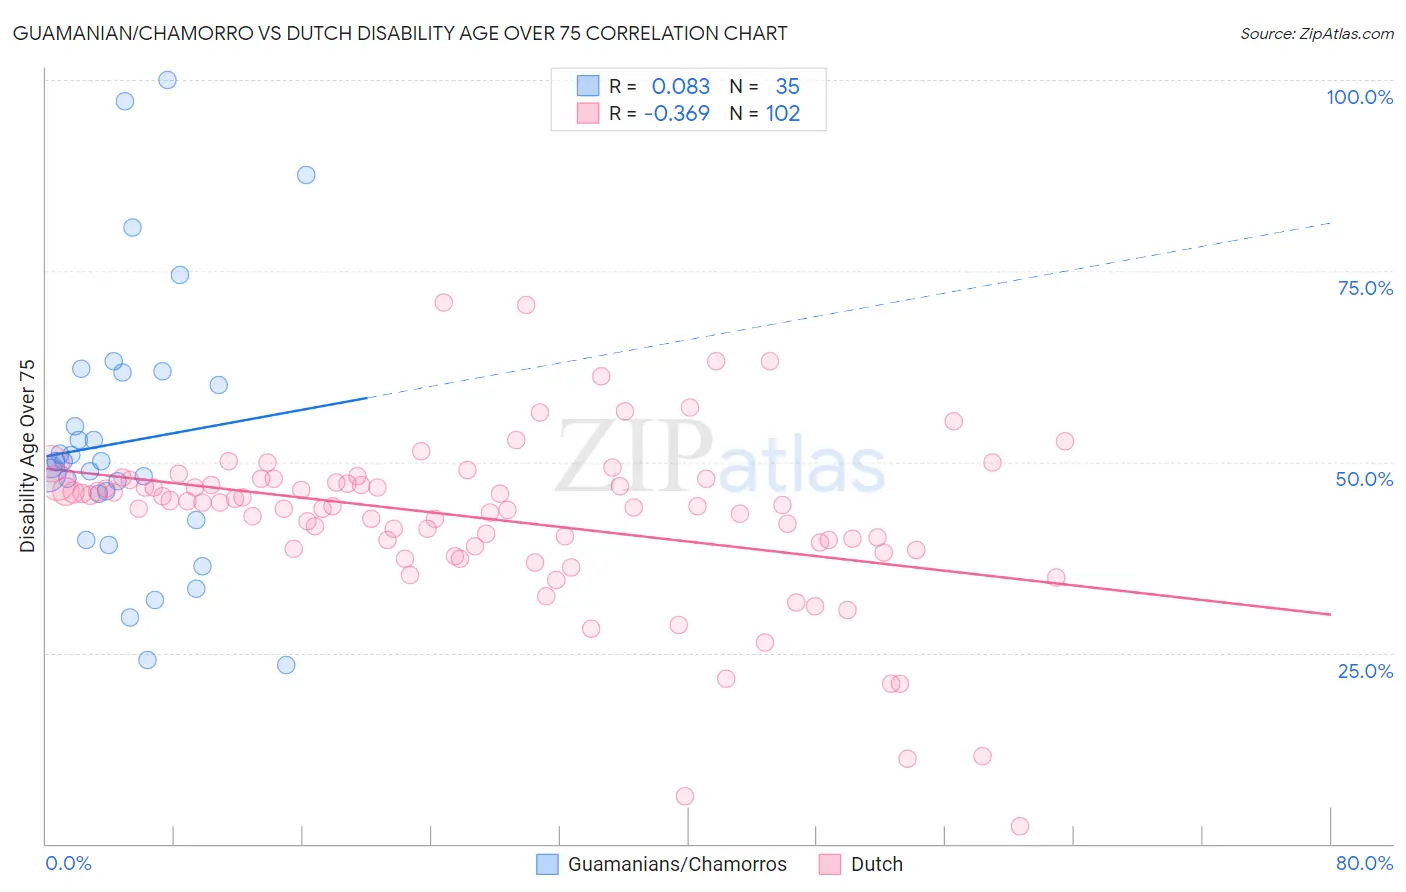
Guamanian/Chamorro vs Dutch Disability Age Over 75 Correlation Chart
The statistical analysis conducted on geographies consisting of 221,408,393 people shows a slight positive correlation between the proportion of Guamanians/Chamorros and percentage of population with a disability over the age of 75 in the United States with a correlation coefficient (R) of 0.083 and weighted average of 49.4%. Similarly, the statistical analysis conducted on geographies consisting of 552,623,660 people shows a mild negative correlation between the proportion of Dutch and percentage of population with a disability over the age of 75 in the United States with a correlation coefficient (R) of -0.369 and weighted average of 46.5%, a difference of 6.2%.
Disability Age Over 75 Correlation Summary
| Measurement | Guamanian/Chamorro | Dutch |
| Minimum | 23.3% | 2.2% |
| Maximum | 100.0% | 70.9% |
| Range | 76.7% | 68.6% |
| Mean | 52.7% | 42.6% |
| Median | 50.0% | 44.5% |
| Interquartile 25% (IQ1) | 42.4% | 39.0% |
| Interquartile 75% (IQ3) | 61.7% | 47.3% |
| Interquartile Range (IQR) | 19.3% | 8.4% |
| Standard Deviation (Sample) | 18.1% | 11.2% |
| Standard Deviation (Population) | 17.8% | 11.1% |
Similar Demographics by Disability Age Over 75
Demographics Similar to Guamanians/Chamorros by Disability Age Over 75
In terms of disability age over 75, the demographic groups most similar to Guamanians/Chamorros are Bangladeshi (49.4%, a difference of 0.060%), Belizean (49.4%, a difference of 0.070%), Black/African American (49.5%, a difference of 0.21%), Samoan (49.5%, a difference of 0.24%), and Immigrants from Latin America (49.5%, a difference of 0.29%).
| Demographics | Rating | Rank | Disability Age Over 75 |
| Assyrians/Chaldeans/Syriacs | 0.2 /100 | #272 | Tragic 49.1% |
| Immigrants | Iraq | 0.1 /100 | #273 | Tragic 49.1% |
| Immigrants | Guatemala | 0.1 /100 | #274 | Tragic 49.1% |
| Immigrants | Dominica | 0.1 /100 | #275 | Tragic 49.1% |
| Immigrants | Uzbekistan | 0.1 /100 | #276 | Tragic 49.2% |
| Hawaiians | 0.1 /100 | #277 | Tragic 49.2% |
| Immigrants | Laos | 0.1 /100 | #278 | Tragic 49.2% |
| Guamanians/Chamorros | 0.0 /100 | #279 | Tragic 49.4% |
| Bangladeshis | 0.0 /100 | #280 | Tragic 49.4% |
| Belizeans | 0.0 /100 | #281 | Tragic 49.4% |
| Blacks/African Americans | 0.0 /100 | #282 | Tragic 49.5% |
| Samoans | 0.0 /100 | #283 | Tragic 49.5% |
| Immigrants | Latin America | 0.0 /100 | #284 | Tragic 49.5% |
| Crow | 0.0 /100 | #285 | Tragic 49.6% |
| Immigrants | Belize | 0.0 /100 | #286 | Tragic 49.6% |
Demographics Similar to Dutch by Disability Age Over 75
In terms of disability age over 75, the demographic groups most similar to Dutch are Irish (46.5%, a difference of 0.010%), British (46.5%, a difference of 0.020%), Immigrants from Pakistan (46.5%, a difference of 0.030%), Indian (Asian) (46.5%, a difference of 0.030%), and Immigrants from Hong Kong (46.5%, a difference of 0.070%).
| Demographics | Rating | Rank | Disability Age Over 75 |
| Immigrants | Uruguay | 96.7 /100 | #107 | Exceptional 46.4% |
| Brazilians | 96.6 /100 | #108 | Exceptional 46.5% |
| Chileans | 96.4 /100 | #109 | Exceptional 46.5% |
| Immigrants | Hong Kong | 96.4 /100 | #110 | Exceptional 46.5% |
| Immigrants | Chile | 96.4 /100 | #111 | Exceptional 46.5% |
| Immigrants | Pakistan | 96.1 /100 | #112 | Exceptional 46.5% |
| Irish | 96.0 /100 | #113 | Exceptional 46.5% |
| Dutch | 95.9 /100 | #114 | Exceptional 46.5% |
| British | 95.7 /100 | #115 | Exceptional 46.5% |
| Indians (Asian) | 95.7 /100 | #116 | Exceptional 46.5% |
| Hungarians | 95.3 /100 | #117 | Exceptional 46.5% |
| Czechoslovakians | 94.7 /100 | #118 | Exceptional 46.6% |
| Canadians | 94.4 /100 | #119 | Exceptional 46.6% |
| Immigrants | Nepal | 94.1 /100 | #120 | Exceptional 46.6% |
| Scandinavians | 93.6 /100 | #121 | Exceptional 46.6% |