Guamanian/Chamorro vs Finnish Disability Age Over 75
COMPARE
Guamanian/Chamorro
Finnish
Disability Age Over 75
Disability Age Over 75 Comparison
Guamanians/Chamorros
Finns
49.4%
DISABILITY AGE OVER 75
0.0/ 100
METRIC RATING
279th/ 347
METRIC RANK
46.3%
DISABILITY AGE OVER 75
97.9/ 100
METRIC RATING
97th/ 347
METRIC RANK
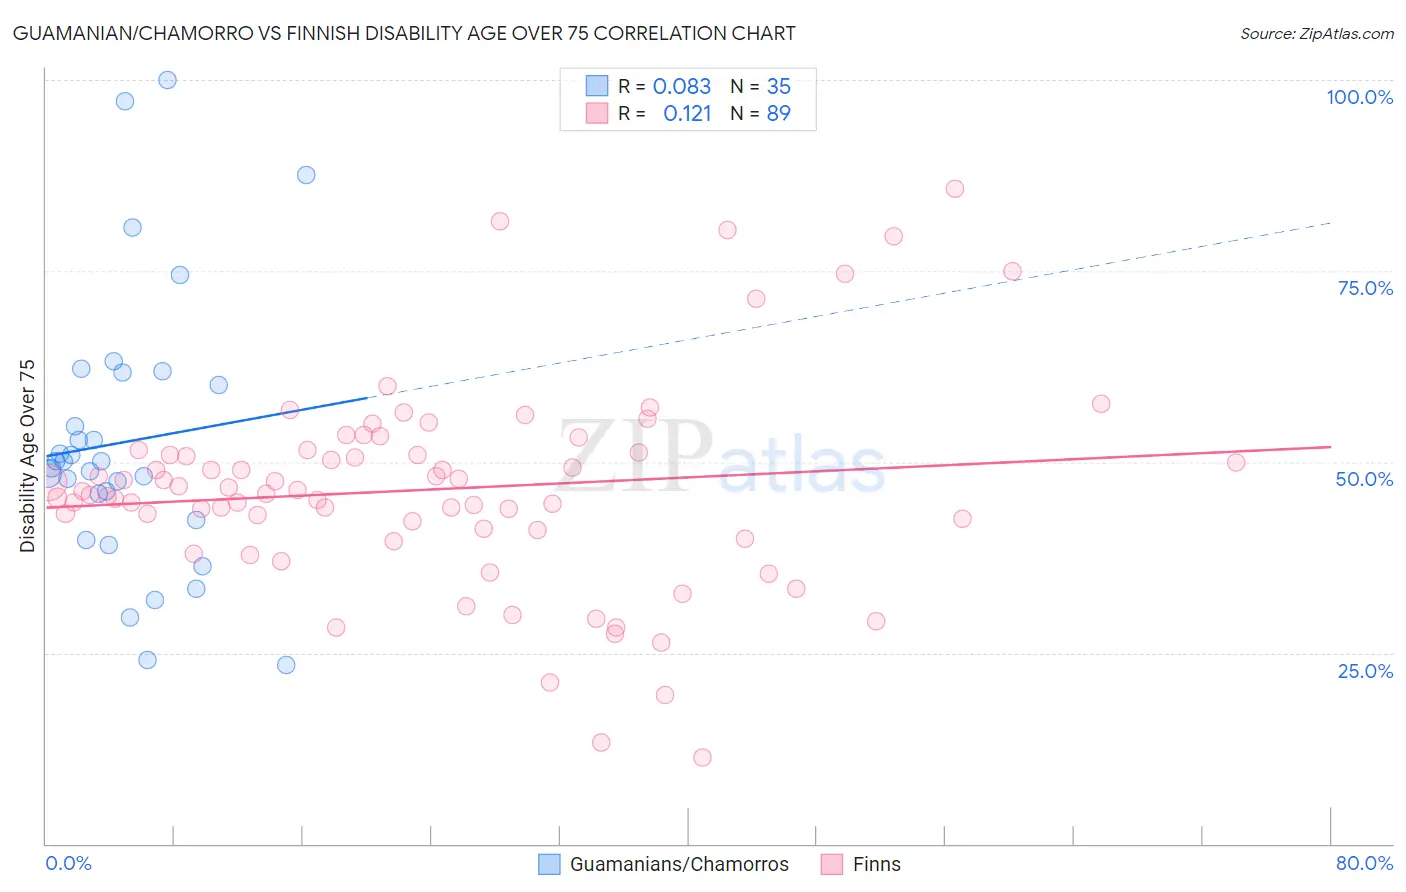
Guamanian/Chamorro vs Finnish Disability Age Over 75 Correlation Chart
The statistical analysis conducted on geographies consisting of 221,408,393 people shows a slight positive correlation between the proportion of Guamanians/Chamorros and percentage of population with a disability over the age of 75 in the United States with a correlation coefficient (R) of 0.083 and weighted average of 49.4%. Similarly, the statistical analysis conducted on geographies consisting of 404,104,832 people shows a poor positive correlation between the proportion of Finns and percentage of population with a disability over the age of 75 in the United States with a correlation coefficient (R) of 0.121 and weighted average of 46.3%, a difference of 6.6%.
Disability Age Over 75 Correlation Summary
| Measurement | Guamanian/Chamorro | Finnish |
| Minimum | 23.3% | 11.3% |
| Maximum | 100.0% | 85.7% |
| Range | 76.7% | 74.4% |
| Mean | 52.7% | 46.4% |
| Median | 50.0% | 46.1% |
| Interquartile 25% (IQ1) | 42.4% | 41.1% |
| Interquartile 75% (IQ3) | 61.7% | 51.3% |
| Interquartile Range (IQR) | 19.3% | 10.2% |
| Standard Deviation (Sample) | 18.1% | 13.5% |
| Standard Deviation (Population) | 17.8% | 13.4% |
Similar Demographics by Disability Age Over 75
Demographics Similar to Guamanians/Chamorros by Disability Age Over 75
In terms of disability age over 75, the demographic groups most similar to Guamanians/Chamorros are Bangladeshi (49.4%, a difference of 0.060%), Belizean (49.4%, a difference of 0.070%), Black/African American (49.5%, a difference of 0.21%), Samoan (49.5%, a difference of 0.24%), and Immigrants from Latin America (49.5%, a difference of 0.29%).
| Demographics | Rating | Rank | Disability Age Over 75 |
| Assyrians/Chaldeans/Syriacs | 0.2 /100 | #272 | Tragic 49.1% |
| Immigrants | Iraq | 0.1 /100 | #273 | Tragic 49.1% |
| Immigrants | Guatemala | 0.1 /100 | #274 | Tragic 49.1% |
| Immigrants | Dominica | 0.1 /100 | #275 | Tragic 49.1% |
| Immigrants | Uzbekistan | 0.1 /100 | #276 | Tragic 49.2% |
| Hawaiians | 0.1 /100 | #277 | Tragic 49.2% |
| Immigrants | Laos | 0.1 /100 | #278 | Tragic 49.2% |
| Guamanians/Chamorros | 0.0 /100 | #279 | Tragic 49.4% |
| Bangladeshis | 0.0 /100 | #280 | Tragic 49.4% |
| Belizeans | 0.0 /100 | #281 | Tragic 49.4% |
| Blacks/African Americans | 0.0 /100 | #282 | Tragic 49.5% |
| Samoans | 0.0 /100 | #283 | Tragic 49.5% |
| Immigrants | Latin America | 0.0 /100 | #284 | Tragic 49.5% |
| Crow | 0.0 /100 | #285 | Tragic 49.6% |
| Immigrants | Belize | 0.0 /100 | #286 | Tragic 49.6% |
Demographics Similar to Finns by Disability Age Over 75
In terms of disability age over 75, the demographic groups most similar to Finns are Immigrants from Japan (46.3%, a difference of 0.010%), Immigrants from China (46.3%, a difference of 0.020%), Immigrants from Brazil (46.3%, a difference of 0.030%), Albanian (46.3%, a difference of 0.050%), and Palestinian (46.3%, a difference of 0.050%).
| Demographics | Rating | Rank | Disability Age Over 75 |
| Northern Europeans | 98.3 /100 | #90 | Exceptional 46.3% |
| Immigrants | Egypt | 98.3 /100 | #91 | Exceptional 46.3% |
| Germans | 98.2 /100 | #92 | Exceptional 46.3% |
| Ugandans | 98.2 /100 | #93 | Exceptional 46.3% |
| Albanians | 98.1 /100 | #94 | Exceptional 46.3% |
| Immigrants | Brazil | 98.0 /100 | #95 | Exceptional 46.3% |
| Immigrants | China | 98.0 /100 | #96 | Exceptional 46.3% |
| Finns | 97.9 /100 | #97 | Exceptional 46.3% |
| Immigrants | Japan | 97.8 /100 | #98 | Exceptional 46.3% |
| Palestinians | 97.7 /100 | #99 | Exceptional 46.3% |
| Immigrants | Eastern Europe | 97.7 /100 | #100 | Exceptional 46.3% |
| Mongolians | 97.7 /100 | #101 | Exceptional 46.3% |
| Immigrants | Malaysia | 97.1 /100 | #102 | Exceptional 46.4% |
| Ukrainians | 97.1 /100 | #103 | Exceptional 46.4% |
| Israelis | 97.0 /100 | #104 | Exceptional 46.4% |