Guamanian/Chamorro vs Ethiopian Disability Age Over 75
COMPARE
Guamanian/Chamorro
Ethiopian
Disability Age Over 75
Disability Age Over 75 Comparison
Guamanians/Chamorros
Ethiopians
49.4%
DISABILITY AGE OVER 75
0.0/ 100
METRIC RATING
279th/ 347
METRIC RANK
46.8%
DISABILITY AGE OVER 75
88.9/ 100
METRIC RATING
135th/ 347
METRIC RANK
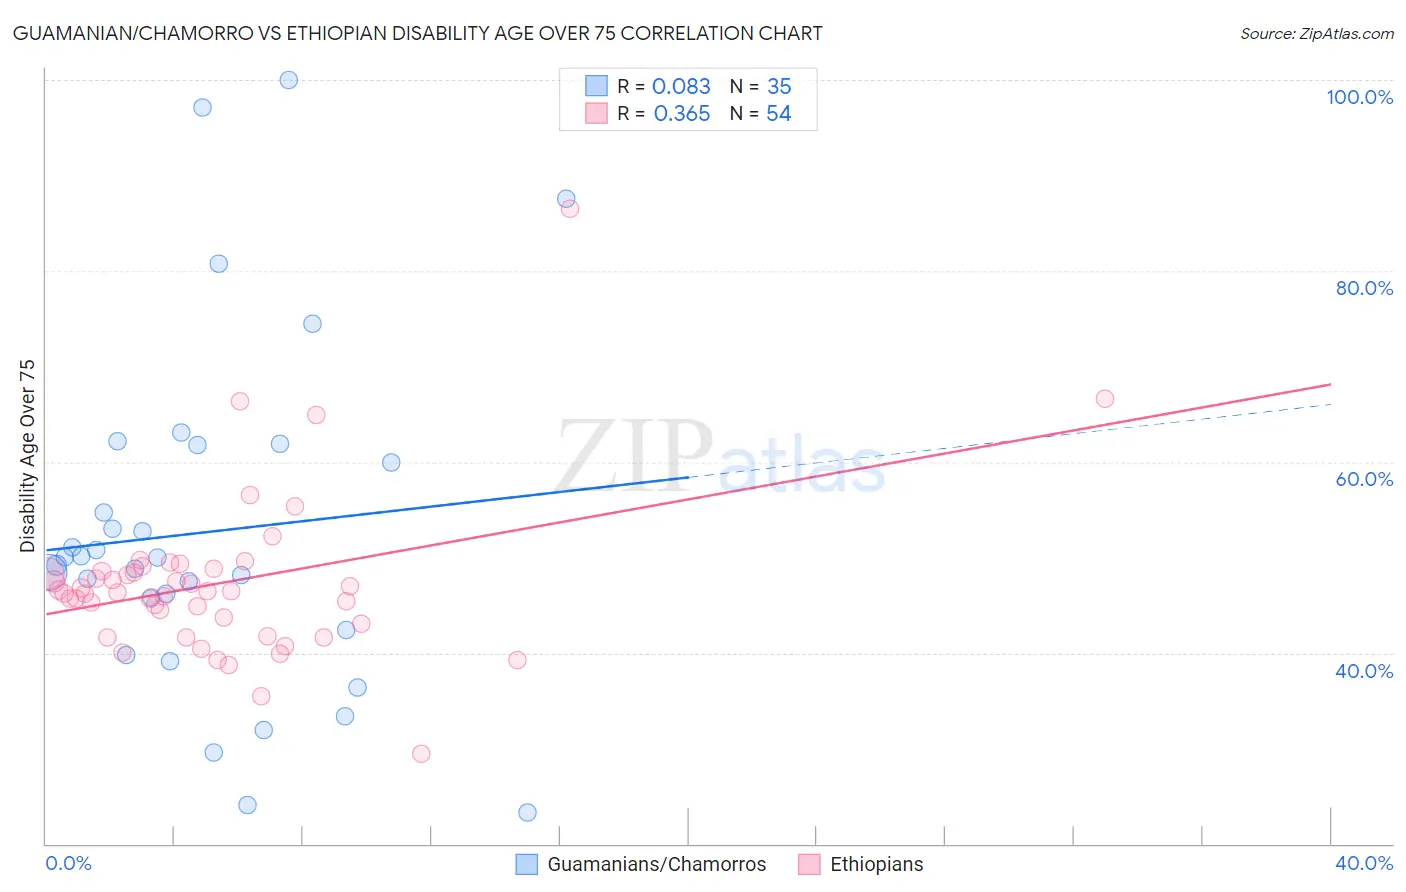
Guamanian/Chamorro vs Ethiopian Disability Age Over 75 Correlation Chart
The statistical analysis conducted on geographies consisting of 221,408,393 people shows a slight positive correlation between the proportion of Guamanians/Chamorros and percentage of population with a disability over the age of 75 in the United States with a correlation coefficient (R) of 0.083 and weighted average of 49.4%. Similarly, the statistical analysis conducted on geographies consisting of 222,925,097 people shows a mild positive correlation between the proportion of Ethiopians and percentage of population with a disability over the age of 75 in the United States with a correlation coefficient (R) of 0.365 and weighted average of 46.8%, a difference of 5.6%.
Disability Age Over 75 Correlation Summary
| Measurement | Guamanian/Chamorro | Ethiopian |
| Minimum | 23.3% | 29.5% |
| Maximum | 100.0% | 86.5% |
| Range | 76.7% | 57.0% |
| Mean | 52.7% | 47.3% |
| Median | 50.0% | 46.4% |
| Interquartile 25% (IQ1) | 42.4% | 43.0% |
| Interquartile 75% (IQ3) | 61.7% | 48.6% |
| Interquartile Range (IQR) | 19.3% | 5.5% |
| Standard Deviation (Sample) | 18.1% | 8.5% |
| Standard Deviation (Population) | 17.8% | 8.4% |
Similar Demographics by Disability Age Over 75
Demographics Similar to Guamanians/Chamorros by Disability Age Over 75
In terms of disability age over 75, the demographic groups most similar to Guamanians/Chamorros are Bangladeshi (49.4%, a difference of 0.060%), Belizean (49.4%, a difference of 0.070%), Black/African American (49.5%, a difference of 0.21%), Samoan (49.5%, a difference of 0.24%), and Immigrants from Latin America (49.5%, a difference of 0.29%).
| Demographics | Rating | Rank | Disability Age Over 75 |
| Assyrians/Chaldeans/Syriacs | 0.2 /100 | #272 | Tragic 49.1% |
| Immigrants | Iraq | 0.1 /100 | #273 | Tragic 49.1% |
| Immigrants | Guatemala | 0.1 /100 | #274 | Tragic 49.1% |
| Immigrants | Dominica | 0.1 /100 | #275 | Tragic 49.1% |
| Immigrants | Uzbekistan | 0.1 /100 | #276 | Tragic 49.2% |
| Hawaiians | 0.1 /100 | #277 | Tragic 49.2% |
| Immigrants | Laos | 0.1 /100 | #278 | Tragic 49.2% |
| Guamanians/Chamorros | 0.0 /100 | #279 | Tragic 49.4% |
| Bangladeshis | 0.0 /100 | #280 | Tragic 49.4% |
| Belizeans | 0.0 /100 | #281 | Tragic 49.4% |
| Blacks/African Americans | 0.0 /100 | #282 | Tragic 49.5% |
| Samoans | 0.0 /100 | #283 | Tragic 49.5% |
| Immigrants | Latin America | 0.0 /100 | #284 | Tragic 49.5% |
| Crow | 0.0 /100 | #285 | Tragic 49.6% |
| Immigrants | Belize | 0.0 /100 | #286 | Tragic 49.6% |
Demographics Similar to Ethiopians by Disability Age Over 75
In terms of disability age over 75, the demographic groups most similar to Ethiopians are Immigrants from Ethiopia (46.8%, a difference of 0.010%), Immigrants from Venezuela (46.8%, a difference of 0.010%), Immigrants from Uganda (46.8%, a difference of 0.020%), Immigrants from Bosnia and Herzegovina (46.8%, a difference of 0.020%), and Yugoslavian (46.8%, a difference of 0.020%).
| Demographics | Rating | Rank | Disability Age Over 75 |
| Icelanders | 90.9 /100 | #128 | Exceptional 46.7% |
| Immigrants | Germany | 90.8 /100 | #129 | Exceptional 46.7% |
| Immigrants | Northern Africa | 90.7 /100 | #130 | Exceptional 46.7% |
| Scottish | 90.5 /100 | #131 | Exceptional 46.7% |
| South Americans | 90.0 /100 | #132 | Excellent 46.8% |
| English | 89.4 /100 | #133 | Excellent 46.8% |
| Immigrants | Ethiopia | 89.1 /100 | #134 | Excellent 46.8% |
| Ethiopians | 88.9 /100 | #135 | Excellent 46.8% |
| Immigrants | Venezuela | 88.6 /100 | #136 | Excellent 46.8% |
| Immigrants | Uganda | 88.5 /100 | #137 | Excellent 46.8% |
| Immigrants | Bosnia and Herzegovina | 88.5 /100 | #138 | Excellent 46.8% |
| Yugoslavians | 88.5 /100 | #139 | Excellent 46.8% |
| Immigrants | Costa Rica | 87.4 /100 | #140 | Excellent 46.8% |
| Lebanese | 87.0 /100 | #141 | Excellent 46.8% |
| Peruvians | 86.5 /100 | #142 | Excellent 46.8% |