Guamanian/Chamorro vs Alaska Native Disability Age Over 75
COMPARE
Guamanian/Chamorro
Alaska Native
Disability Age Over 75
Disability Age Over 75 Comparison
Guamanians/Chamorros
Alaska Natives
49.4%
DISABILITY AGE OVER 75
0.0/ 100
METRIC RATING
279th/ 347
METRIC RANK
52.8%
DISABILITY AGE OVER 75
0.0/ 100
METRIC RATING
329th/ 347
METRIC RANK
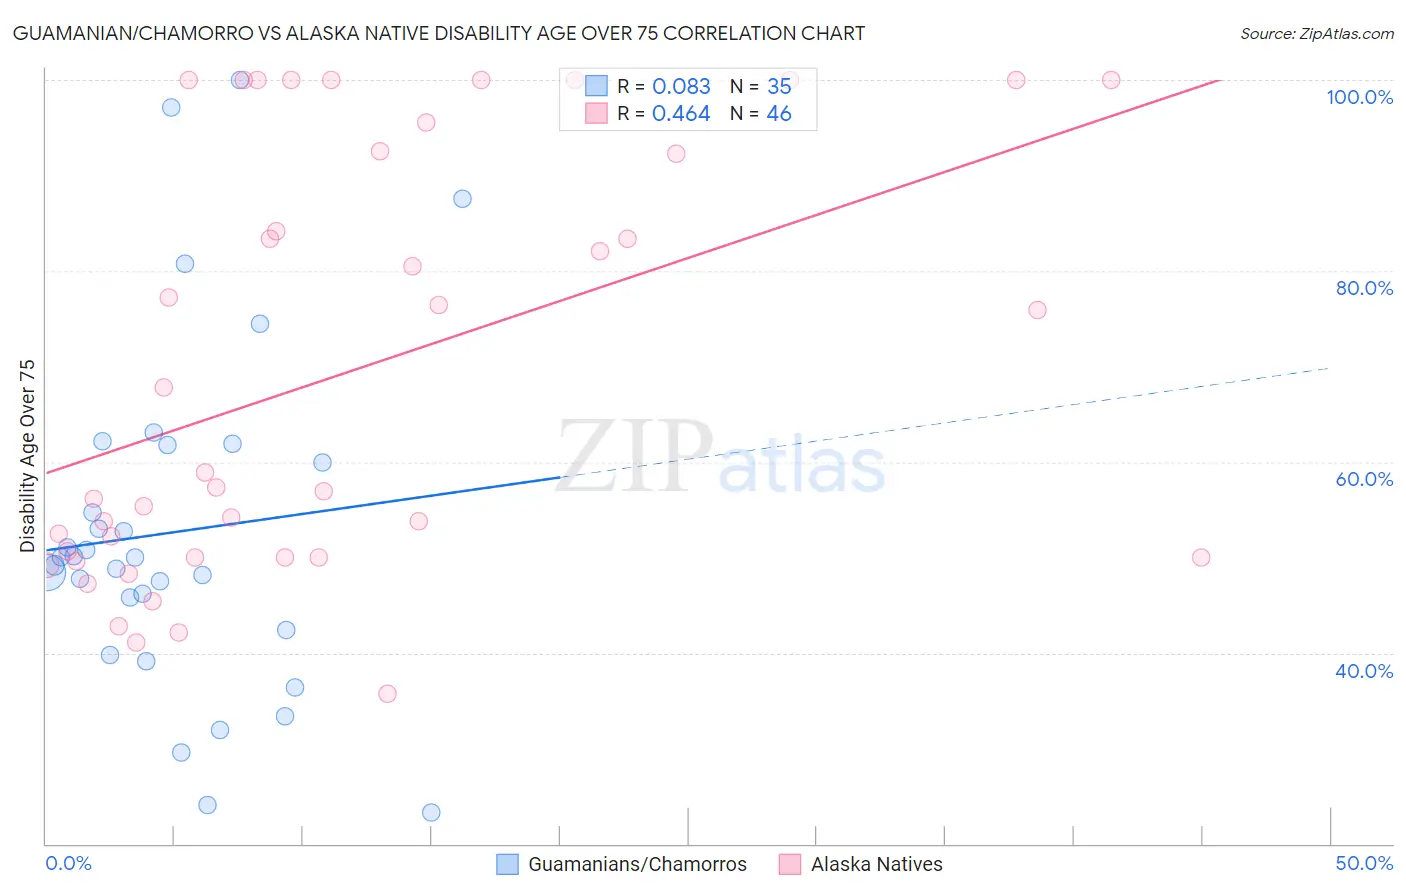
Guamanian/Chamorro vs Alaska Native Disability Age Over 75 Correlation Chart
The statistical analysis conducted on geographies consisting of 221,408,393 people shows a slight positive correlation between the proportion of Guamanians/Chamorros and percentage of population with a disability over the age of 75 in the United States with a correlation coefficient (R) of 0.083 and weighted average of 49.4%. Similarly, the statistical analysis conducted on geographies consisting of 76,686,010 people shows a moderate positive correlation between the proportion of Alaska Natives and percentage of population with a disability over the age of 75 in the United States with a correlation coefficient (R) of 0.464 and weighted average of 52.8%, a difference of 6.9%.
Disability Age Over 75 Correlation Summary
| Measurement | Guamanian/Chamorro | Alaska Native |
| Minimum | 23.3% | 35.7% |
| Maximum | 100.0% | 100.0% |
| Range | 76.7% | 64.3% |
| Mean | 52.7% | 69.4% |
| Median | 50.0% | 58.1% |
| Interquartile 25% (IQ1) | 42.4% | 50.0% |
| Interquartile 75% (IQ3) | 61.7% | 92.6% |
| Interquartile Range (IQR) | 19.3% | 42.6% |
| Standard Deviation (Sample) | 18.1% | 22.0% |
| Standard Deviation (Population) | 17.8% | 21.8% |
Similar Demographics by Disability Age Over 75
Demographics Similar to Guamanians/Chamorros by Disability Age Over 75
In terms of disability age over 75, the demographic groups most similar to Guamanians/Chamorros are Bangladeshi (49.4%, a difference of 0.060%), Belizean (49.4%, a difference of 0.070%), Black/African American (49.5%, a difference of 0.21%), Samoan (49.5%, a difference of 0.24%), and Immigrants from Latin America (49.5%, a difference of 0.29%).
| Demographics | Rating | Rank | Disability Age Over 75 |
| Assyrians/Chaldeans/Syriacs | 0.2 /100 | #272 | Tragic 49.1% |
| Immigrants | Iraq | 0.1 /100 | #273 | Tragic 49.1% |
| Immigrants | Guatemala | 0.1 /100 | #274 | Tragic 49.1% |
| Immigrants | Dominica | 0.1 /100 | #275 | Tragic 49.1% |
| Immigrants | Uzbekistan | 0.1 /100 | #276 | Tragic 49.2% |
| Hawaiians | 0.1 /100 | #277 | Tragic 49.2% |
| Immigrants | Laos | 0.1 /100 | #278 | Tragic 49.2% |
| Guamanians/Chamorros | 0.0 /100 | #279 | Tragic 49.4% |
| Bangladeshis | 0.0 /100 | #280 | Tragic 49.4% |
| Belizeans | 0.0 /100 | #281 | Tragic 49.4% |
| Blacks/African Americans | 0.0 /100 | #282 | Tragic 49.5% |
| Samoans | 0.0 /100 | #283 | Tragic 49.5% |
| Immigrants | Latin America | 0.0 /100 | #284 | Tragic 49.5% |
| Crow | 0.0 /100 | #285 | Tragic 49.6% |
| Immigrants | Belize | 0.0 /100 | #286 | Tragic 49.6% |
Demographics Similar to Alaska Natives by Disability Age Over 75
In terms of disability age over 75, the demographic groups most similar to Alaska Natives are Puerto Rican (52.9%, a difference of 0.18%), Hopi (52.9%, a difference of 0.19%), Choctaw (52.7%, a difference of 0.22%), Nepalese (52.6%, a difference of 0.41%), and Ute (52.6%, a difference of 0.44%).
| Demographics | Rating | Rank | Disability Age Over 75 |
| Comanche | 0.0 /100 | #322 | Tragic 51.7% |
| Immigrants | Yemen | 0.0 /100 | #323 | Tragic 52.0% |
| Menominee | 0.0 /100 | #324 | Tragic 52.3% |
| Immigrants | Cabo Verde | 0.0 /100 | #325 | Tragic 52.4% |
| Ute | 0.0 /100 | #326 | Tragic 52.6% |
| Nepalese | 0.0 /100 | #327 | Tragic 52.6% |
| Choctaw | 0.0 /100 | #328 | Tragic 52.7% |
| Alaska Natives | 0.0 /100 | #329 | Tragic 52.8% |
| Puerto Ricans | 0.0 /100 | #330 | Tragic 52.9% |
| Hopi | 0.0 /100 | #331 | Tragic 52.9% |
| Natives/Alaskans | 0.0 /100 | #332 | Tragic 53.1% |
| Apache | 0.0 /100 | #333 | Tragic 53.6% |
| Alaskan Athabascans | 0.0 /100 | #334 | Tragic 54.0% |
| Kiowa | 0.0 /100 | #335 | Tragic 54.2% |
| Immigrants | Armenia | 0.0 /100 | #336 | Tragic 54.3% |