Zip Codes with the Most Immigrants from Eastern Asia in Phenix City, AL
RELATED REPORTS & OPTIONS
Eastern Asia
Phenix City
Compare Zip Codes
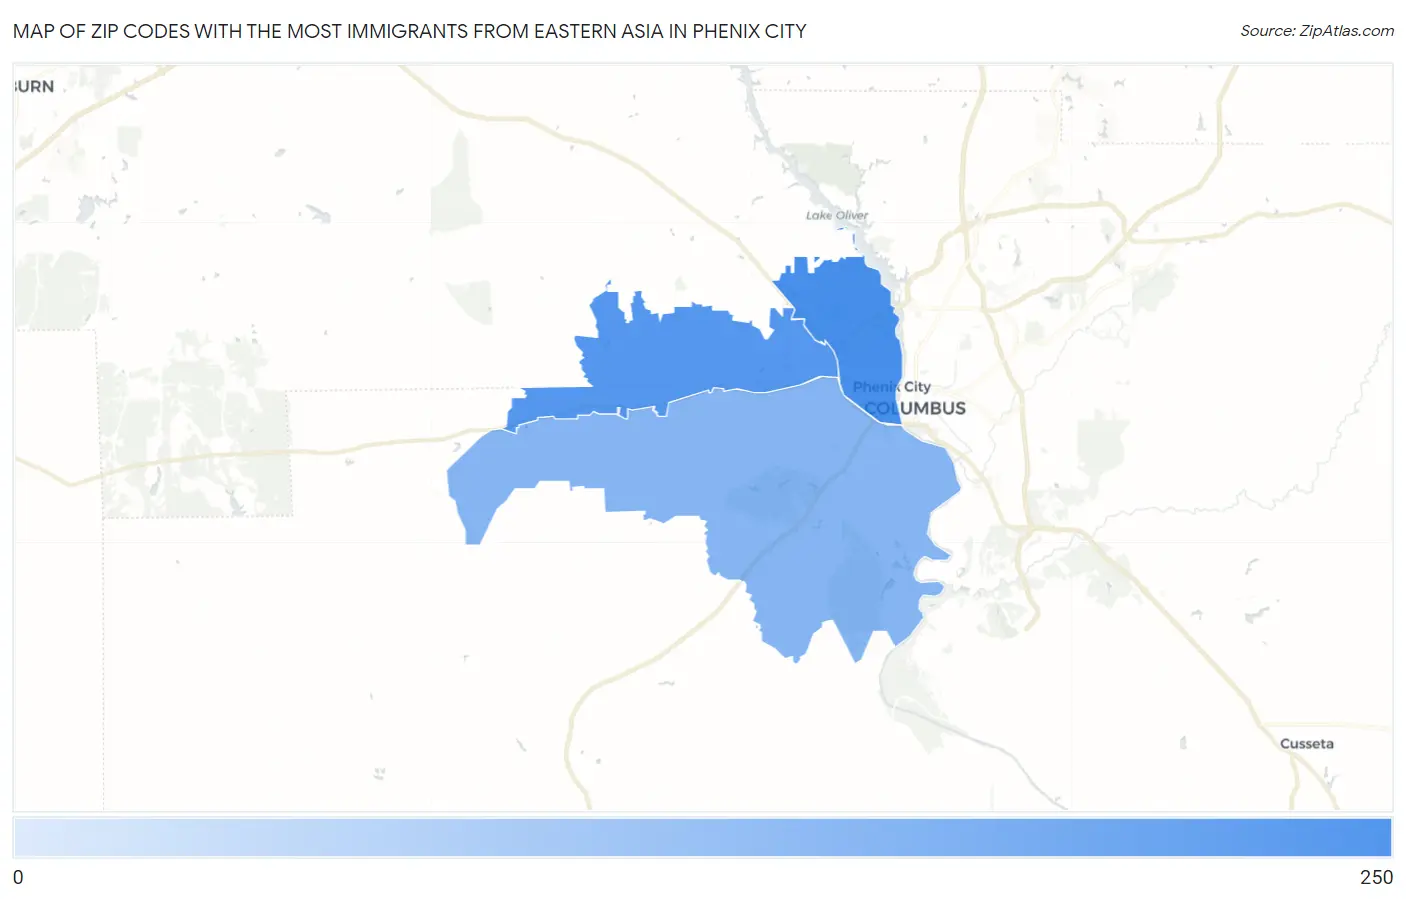
Map of Zip Codes with the Most Immigrants from Eastern Asia in Phenix City
23
219
Zip Codes with the Most Immigrants from Eastern Asia in Phenix City, AL
| Zip Code | Eastern Asia | vs State | vs National | |
| 1. | 36867 | 219 | 21,295(1.03%)#23 | 4,223,726(0.01%)#3,367 |
| 2. | 36870 | 136 | 21,295(0.64%)#38 | 4,223,726(0.00%)#4,575 |
| 3. | 36869 | 23 | 21,295(0.11%)#111 | 4,223,726(0.00%)#9,152 |
1
Common Questions
What are the Top Zip Codes with the Most Immigrants from Eastern Asia in Phenix City, AL?
Top Zip Codes with the Most Immigrants from Eastern Asia in Phenix City, AL are:
What zip code has the Most Immigrants from Eastern Asia in Phenix City, AL?
36867 has the Most Immigrants from Eastern Asia in Phenix City, AL with 219.
What is the Total Immigrants from Eastern Asia in Phenix City, AL?
Total Immigrants from Eastern Asia in Phenix City is 253.
What is the Total Immigrants from Eastern Asia in Alabama?
Total Immigrants from Eastern Asia in Alabama is 21,295.
What is the Total Immigrants from Eastern Asia in the United States?
Total Immigrants from Eastern Asia in the United States is 4,223,726.