Zip Codes with the Highest Percentage of Population Employed in Accommodation & Food Services in Phenix City, AL
RELATED REPORTS & OPTIONS
Accommodation & Food Services
Phenix City
Compare Zip Codes
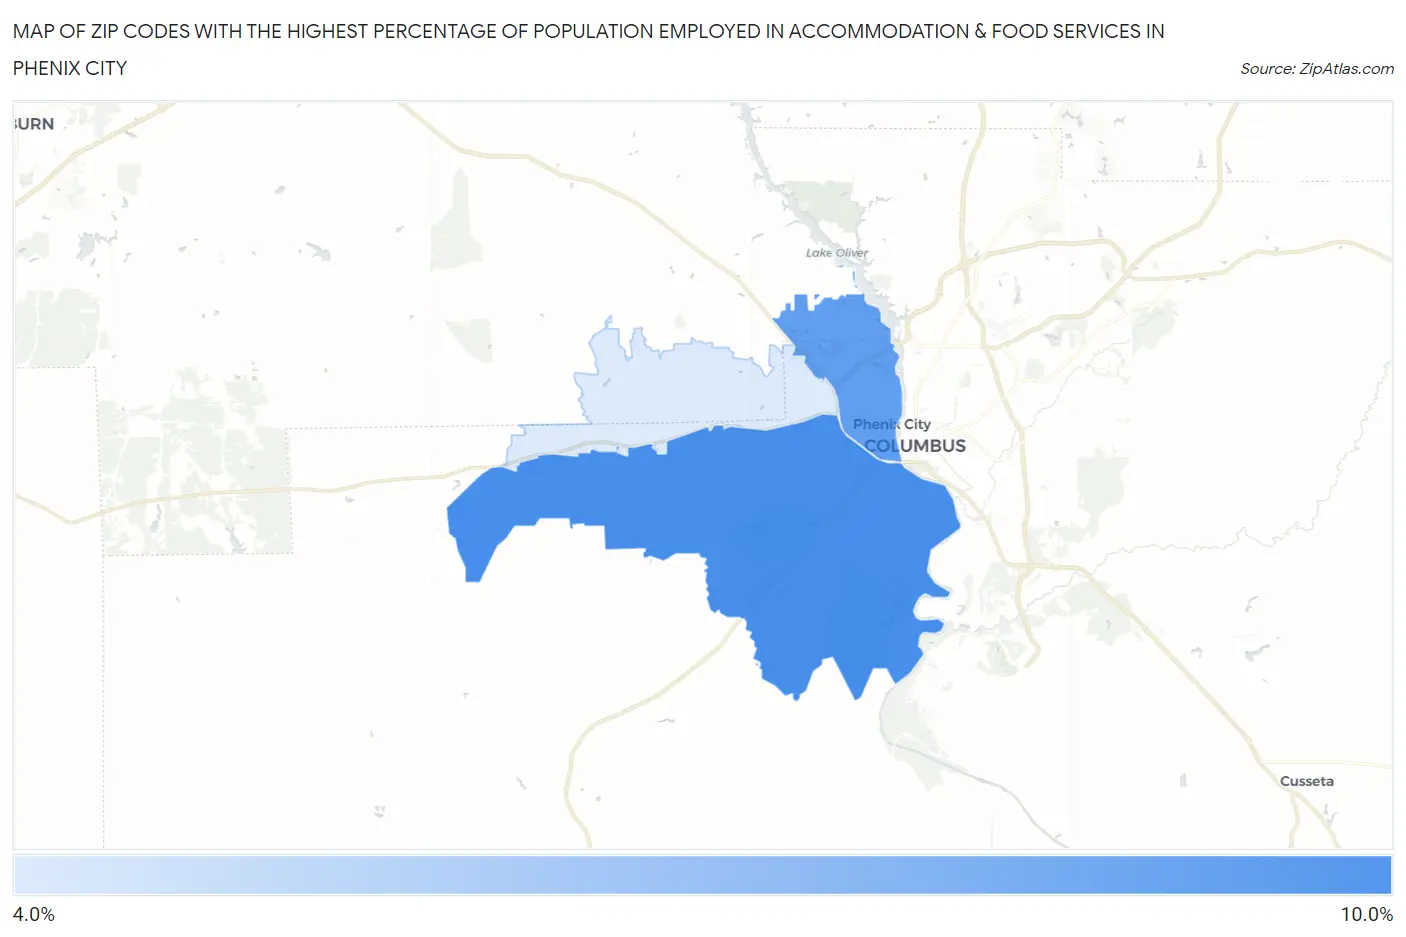
Map of Zip Codes with the Highest Percentage of Population Employed in Accommodation & Food Services in Phenix City
4.9%
9.4%
Zip Codes with the Highest Percentage of Population Employed in Accommodation & Food Services in Phenix City, AL
| Zip Code | % Employed | vs State | vs National | |
| 1. | 36869 | 9.4% | 6.9%(+2.46)#100 | 6.9%(+2.47)#5,417 |
| 2. | 36867 | 8.6% | 6.9%(+1.70)#133 | 6.9%(+1.71)#6,651 |
| 3. | 36870 | 4.9% | 6.9%(-1.95)#338 | 6.9%(-1.93)#16,994 |
1
Common Questions
What are the Top Zip Codes with the Highest Percentage of Population Employed in Accommodation & Food Services in Phenix City, AL?
Top Zip Codes with the Highest Percentage of Population Employed in Accommodation & Food Services in Phenix City, AL are:
What zip code has the Highest Percentage of Population Employed in Accommodation & Food Services in Phenix City, AL?
36869 has the Highest Percentage of Population Employed in Accommodation & Food Services in Phenix City, AL with 9.4%.
What is the Percentage of Population Employed in Accommodation & Food Services in Phenix City, AL?
Percentage of Population Employed in Accommodation & Food Services in Phenix City is 8.3%.
What is the Percentage of Population Employed in Accommodation & Food Services in Alabama?
Percentage of Population Employed in Accommodation & Food Services in Alabama is 6.9%.
What is the Percentage of Population Employed in Accommodation & Food Services in the United States?
Percentage of Population Employed in Accommodation & Food Services in the United States is 6.9%.