Conecuh County, AL Map & Demographics
Conecuh County Map
Conecuh County Overview
$24,426
PER CAPITA INCOME
$55,380
AVG FAMILY INCOME
$39,888
AVG HOUSEHOLD INCOME
37.5%
WAGE / INCOME GAP [ % ]
62.5¢/ $1
WAGE / INCOME GAP [ $ ]
$12,882
FAMILY INCOME DEFICIT
0.46
INEQUALITY / GINI INDEX
11,576
TOTAL POPULATION
5,639
MALE POPULATION
5,937
FEMALE POPULATION
94.98
MALES / 100 FEMALES
105.28
FEMALES / 100 MALES
46.2
MEDIAN AGE
3.6
AVG FAMILY SIZE
2.6
AVG HOUSEHOLD SIZE
3,932
LABOR FORCE [ PEOPLE ]
41.1%
PERCENT IN LABOR FORCE
4.4%
UNEMPLOYMENT RATE
Conecuh County Area Codes
Income in Conecuh County
Income Overview in Conecuh County
Per Capita Income in Conecuh County is $24,426, while median incomes of families and households are $55,380 and $39,888 respectively.
| Characteristic | Number | Measure |
| Per Capita Income | 11,576 | $24,426 |
| Median Family Income | 2,601 | $55,380 |
| Mean Family Income | 2,601 | $72,529 |
| Median Household Income | 4,453 | $39,888 |
| Mean Household Income | 4,453 | $56,230 |
| Income Deficit | 2,601 | $12,882 |
| Wage / Income Gap (%) | 11,576 | 37.49% |
| Wage / Income Gap ($) | 11,576 | 62.51¢ per $1 |
| Gini / Inequality Index | 11,576 | 0.46 |
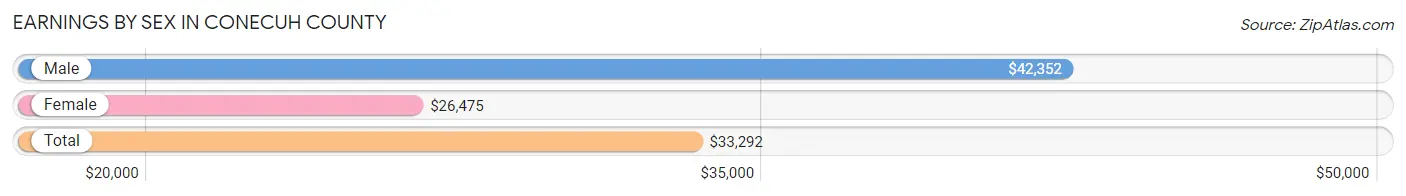
Earnings by Sex in Conecuh County
Average Earnings in Conecuh County are $33,292, $42,352 for men and $26,475 for women, a difference of 37.5%.
| Sex | Number | Average Earnings |
| Male | 2,173 (54.0%) | $42,352 |
| Female | 1,852 (46.0%) | $26,475 |
| Total | 4,025 (100.0%) | $33,292 |
Earnings by Sex by Income Bracket in Conecuh County
The most common earnings brackets in Conecuh County are $100,000+ for men (302 | 13.9%) and $22,500 to $24,999 for women (260 | 14.0%).
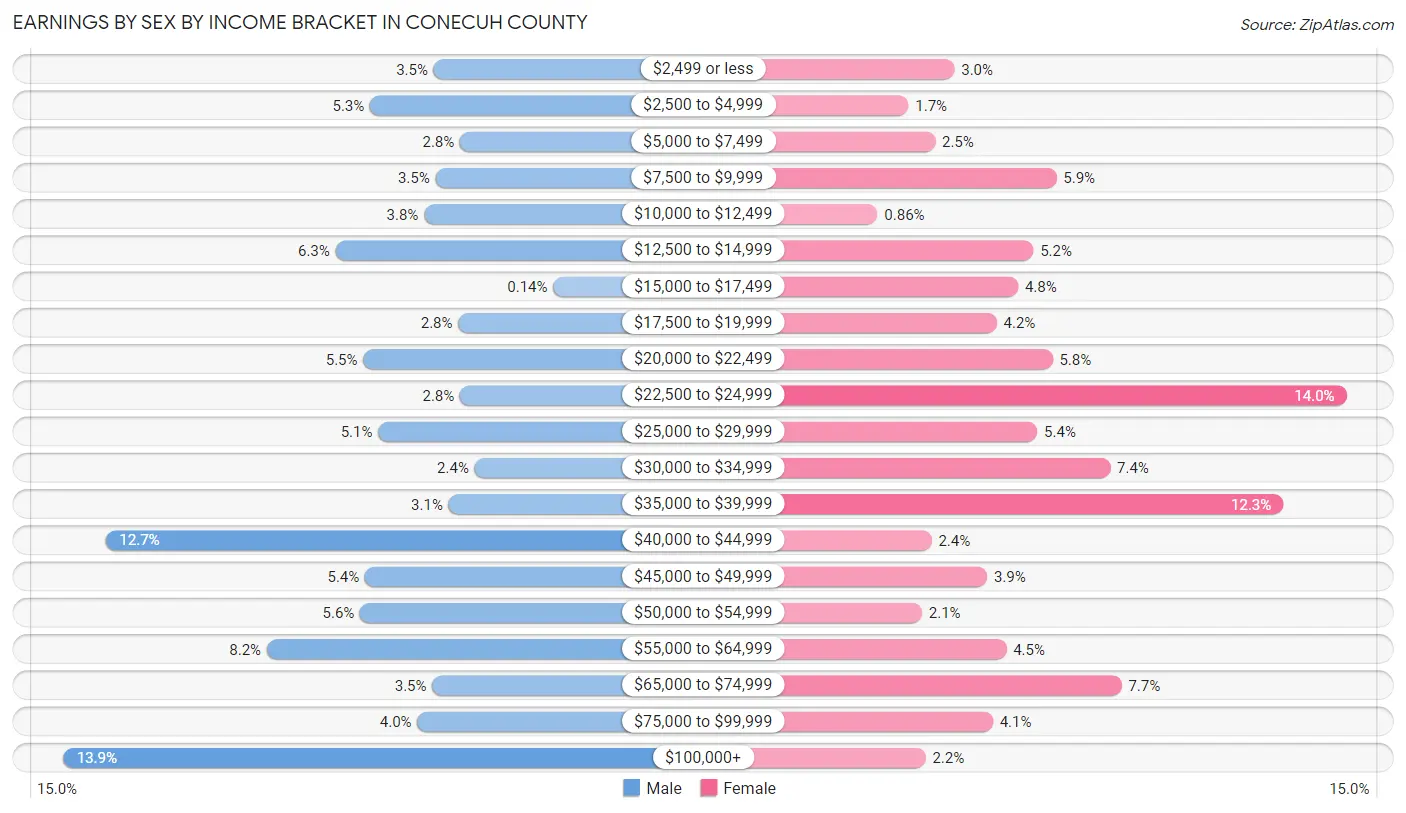
| Income | Male | Female |
| $2,499 or less | 76 (3.5%) | 56 (3.0%) |
| $2,500 to $4,999 | 115 (5.3%) | 32 (1.7%) |
| $5,000 to $7,499 | 60 (2.8%) | 46 (2.5%) |
| $7,500 to $9,999 | 75 (3.5%) | 109 (5.9%) |
| $10,000 to $12,499 | 82 (3.8%) | 16 (0.9%) |
| $12,500 to $14,999 | 136 (6.3%) | 97 (5.2%) |
| $15,000 to $17,499 | 3 (0.1%) | 89 (4.8%) |
| $17,500 to $19,999 | 61 (2.8%) | 78 (4.2%) |
| $20,000 to $22,499 | 119 (5.5%) | 107 (5.8%) |
| $22,500 to $24,999 | 60 (2.8%) | 260 (14.0%) |
| $25,000 to $29,999 | 110 (5.1%) | 99 (5.3%) |
| $30,000 to $34,999 | 51 (2.4%) | 137 (7.4%) |
| $35,000 to $39,999 | 67 (3.1%) | 227 (12.3%) |
| $40,000 to $44,999 | 276 (12.7%) | 44 (2.4%) |
| $45,000 to $49,999 | 118 (5.4%) | 73 (3.9%) |
| $50,000 to $54,999 | 121 (5.6%) | 39 (2.1%) |
| $55,000 to $64,999 | 178 (8.2%) | 83 (4.5%) |
| $65,000 to $74,999 | 77 (3.5%) | 143 (7.7%) |
| $75,000 to $99,999 | 86 (4.0%) | 76 (4.1%) |
| $100,000+ | 302 (13.9%) | 41 (2.2%) |
| Total | 2,173 (100.0%) | 1,852 (100.0%) |
Earnings by Sex by Educational Attainment in Conecuh County
Average earnings in Conecuh County are $44,211 for men and $28,914 for women, a difference of 34.6%. Men with an educational attainment of graduate degree enjoy the highest average annual earnings of $107,955, while those with high school diploma education earn the least with $41,723. Women with an educational attainment of graduate degree earn the most with the average annual earnings of $59,531, while those with college or associate's degree education have the smallest earnings of $24,453.
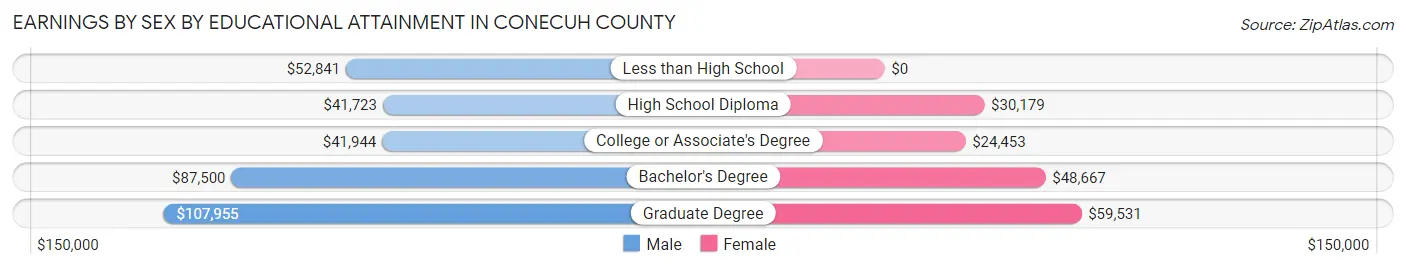
| Educational Attainment | Male Income | Female Income |
| Less than High School | $52,841 | $0 |
| High School Diploma | $41,723 | $30,179 |
| College or Associate's Degree | $41,944 | $24,453 |
| Bachelor's Degree | $87,500 | $48,667 |
| Graduate Degree | $107,955 | $59,531 |
| Total | $44,211 | $28,914 |
Family Income in Conecuh County
Family Income Brackets in Conecuh County
According to the Conecuh County family income data, there are 588 families falling into the $50,000 to $74,999 income range, which is the most common income bracket and makes up 22.6% of all families. Conversely, the $150,000 to $199,999 income bracket is the least frequent group with only 44 families (1.7%) belonging to this category.
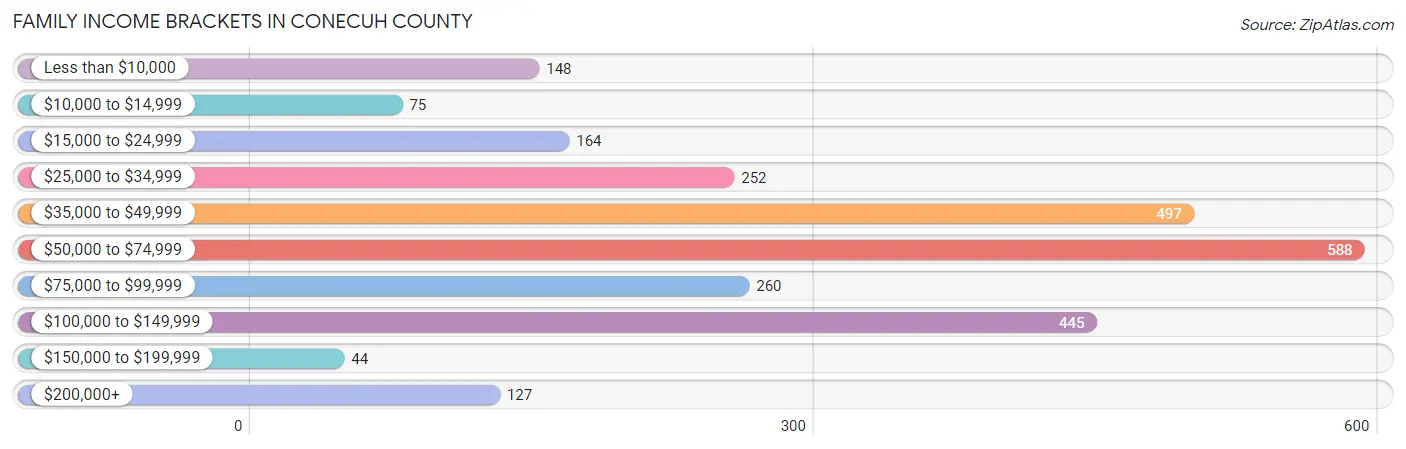
| Income Bracket | # Families | % Families |
| Less than $10,000 | 148 | 5.7% |
| $10,000 to $14,999 | 75 | 2.9% |
| $15,000 to $24,999 | 164 | 6.3% |
| $25,000 to $34,999 | 252 | 9.7% |
| $35,000 to $49,999 | 497 | 19.1% |
| $50,000 to $74,999 | 588 | 22.6% |
| $75,000 to $99,999 | 260 | 10.0% |
| $100,000 to $149,999 | 445 | 17.1% |
| $150,000 to $199,999 | 44 | 1.7% |
| $200,000+ | 127 | 4.9% |
Family Income by Famaliy Size in Conecuh County
5-person families (127 | 4.9%) account for the highest median family income in Conecuh County with $85,893 per family, while 2-person families (1,643 | 63.2%) have the highest median income of $29,404 per family member.
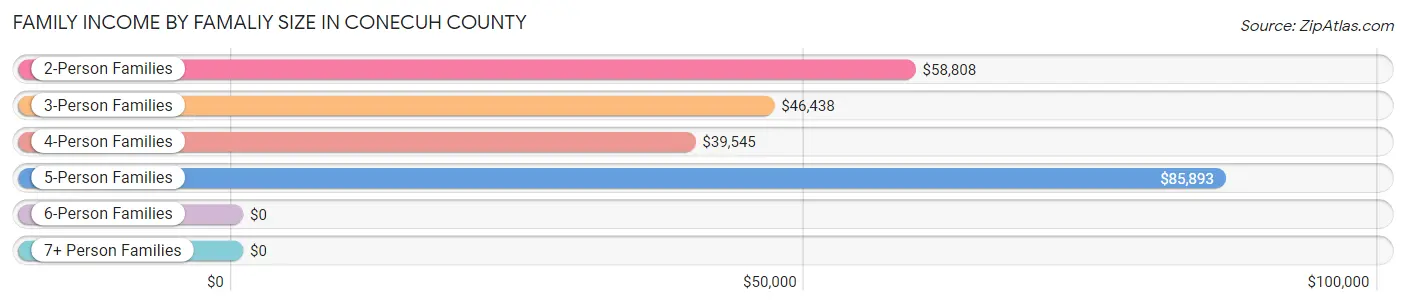
| Income Bracket | # Families | Median Income |
| 2-Person Families | 1,643 (63.2%) | $58,808 |
| 3-Person Families | 501 (19.3%) | $46,438 |
| 4-Person Families | 274 (10.5%) | $39,545 |
| 5-Person Families | 127 (4.9%) | $85,893 |
| 6-Person Families | 33 (1.3%) | $0 |
| 7+ Person Families | 23 (0.9%) | $0 |
| Total | 2,601 (100.0%) | $55,380 |
Family Income by Number of Earners in Conecuh County
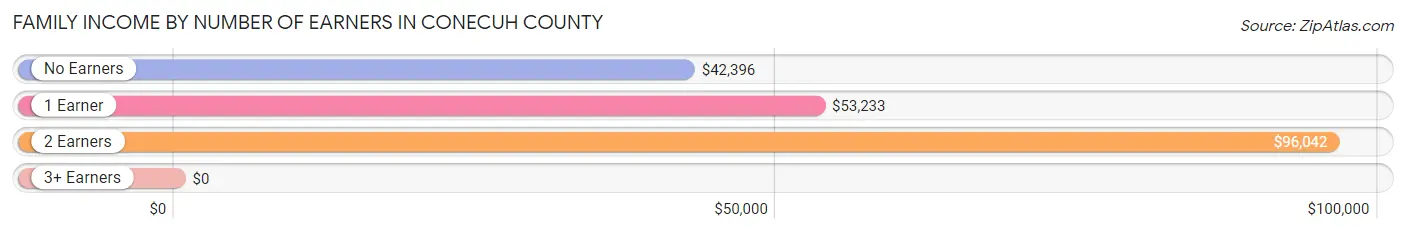
| Number of Earners | # Families | Median Income |
| No Earners | 965 (37.1%) | $42,396 |
| 1 Earner | 982 (37.8%) | $53,233 |
| 2 Earners | 510 (19.6%) | $96,042 |
| 3+ Earners | 144 (5.5%) | $0 |
| Total | 2,601 (100.0%) | $55,380 |
Household Income in Conecuh County
Household Income Brackets in Conecuh County
With 833 households falling in the category, the $35,000 to $49,999 income range is the most frequent in Conecuh County, accounting for 18.7% of all households. In contrast, only 49 households (1.1%) fall into the $150,000 to $199,999 income bracket, making it the least populous group.
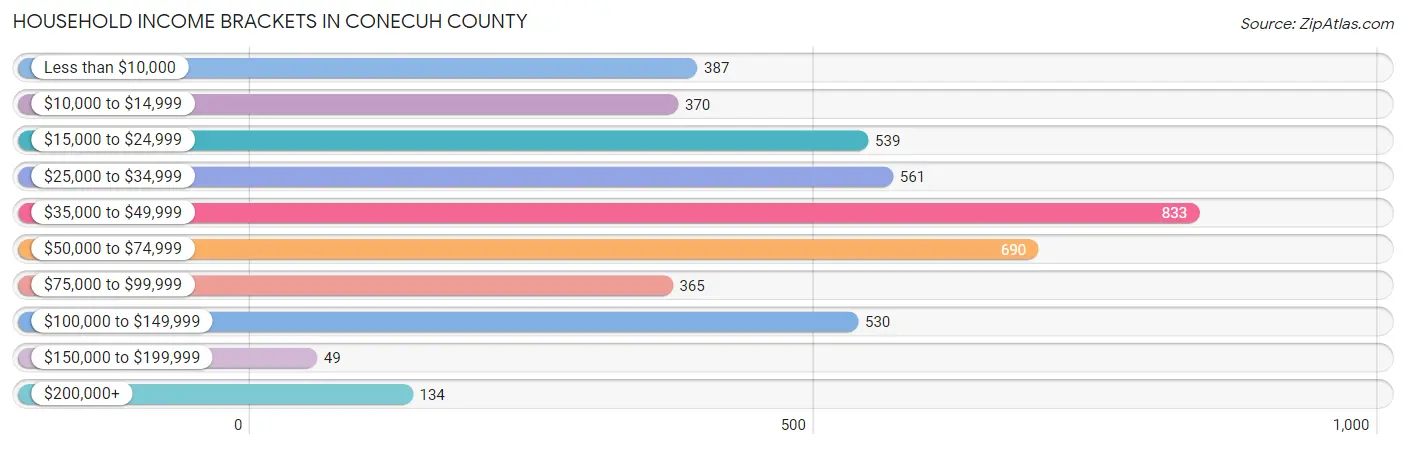
| Income Bracket | # Households | % Households |
| Less than $10,000 | 387 | 8.7% |
| $10,000 to $14,999 | 370 | 8.3% |
| $15,000 to $24,999 | 539 | 12.1% |
| $25,000 to $34,999 | 561 | 12.6% |
| $35,000 to $49,999 | 833 | 18.7% |
| $50,000 to $74,999 | 690 | 15.5% |
| $75,000 to $99,999 | 365 | 8.2% |
| $100,000 to $149,999 | 530 | 11.9% |
| $150,000 to $199,999 | 49 | 1.1% |
| $200,000+ | 134 | 3.0% |
Household Income by Householder Age in Conecuh County
The median household income in Conecuh County is $39,888, with the highest median household income of $46,514 found in the 45 to 64 years age bracket for the primary householder. A total of 1,534 households (34.4%) fall into this category. Meanwhile, the 15 to 24 years age bracket for the primary householder has the lowest median household income of $2,499, with 95 households (2.1%) in this group.
| Income Bracket | # Households | Median Income |
| 15 to 24 Years | 95 (2.1%) | $2,499 |
| 25 to 44 Years | 1,010 (22.7%) | $39,058 |
| 45 to 64 Years | 1,534 (34.4%) | $46,514 |
| 65+ Years | 1,814 (40.7%) | $35,179 |
| Total | 4,453 (100.0%) | $39,888 |
Poverty in Conecuh County
Income Below Poverty by Sex and Age in Conecuh County
With 16.5% poverty level for males and 20.3% for females among the residents of Conecuh County, 15 year old males and 5 year old females are the most vulnerable to poverty, with 23 males (63.9%) and 63 females (100.0%) in their respective age groups living below the poverty level.
| Age Bracket | Male | Female |
| Under 5 Years | 71 (24.5%) | 47 (26.9%) |
| 5 Years | 10 (10.9%) | 63 (100.0%) |
| 6 to 11 Years | 304 (59.0%) | 209 (51.1%) |
| 12 to 14 Years | 42 (20.3%) | 20 (10.3%) |
| 15 Years | 23 (63.9%) | 0 (0.0%) |
| 16 and 17 Years | 11 (11.5%) | 8 (3.0%) |
| 18 to 24 Years | 74 (14.3%) | 111 (35.9%) |
| 25 to 34 Years | 66 (9.0%) | 206 (28.8%) |
| 35 to 44 Years | 76 (20.3%) | 66 (9.8%) |
| 45 to 54 Years | 84 (13.0%) | 165 (23.1%) |
| 55 to 64 Years | 112 (13.1%) | 148 (16.5%) |
| 65 to 74 Years | 16 (2.2%) | 39 (4.9%) |
| 75 Years and over | 35 (6.9%) | 116 (17.1%) |
| Total | 924 (16.5%) | 1,198 (20.3%) |
Income Above Poverty by Sex and Age in Conecuh County
According to the poverty statistics in Conecuh County, males aged 65 to 74 years and females aged 15 years are the age groups that are most secure financially, with 97.8% of males and 100.0% of females in these age groups living above the poverty line.
| Age Bracket | Male | Female |
| Under 5 Years | 219 (75.5%) | 128 (73.1%) |
| 5 Years | 82 (89.1%) | 0 (0.0%) |
| 6 to 11 Years | 211 (41.0%) | 200 (48.9%) |
| 12 to 14 Years | 165 (79.7%) | 174 (89.7%) |
| 15 Years | 13 (36.1%) | 23 (100.0%) |
| 16 and 17 Years | 85 (88.5%) | 256 (97.0%) |
| 18 to 24 Years | 443 (85.7%) | 198 (64.1%) |
| 25 to 34 Years | 663 (90.9%) | 509 (71.2%) |
| 35 to 44 Years | 298 (79.7%) | 611 (90.2%) |
| 45 to 54 Years | 564 (87.0%) | 550 (76.9%) |
| 55 to 64 Years | 746 (87.0%) | 749 (83.5%) |
| 65 to 74 Years | 717 (97.8%) | 750 (95.1%) |
| 75 Years and over | 475 (93.1%) | 563 (82.9%) |
| Total | 4,681 (83.5%) | 4,711 (79.7%) |
Income Below Poverty Among Married-Couple Families in Conecuh County
The poverty statistics for married-couple families in Conecuh County show that 6.6% or 113 of the total 1,713 families live below the poverty line. Families with 1 or 2 children have the highest poverty rate of 15.7%, comprising of 44 families. On the other hand, families with 3 or 4 children have the lowest poverty rate of 0.0%, which includes 0 families.
| Children | Above Poverty | Below Poverty |
| No Children | 1,278 (94.9%) | 69 (5.1%) |
| 1 or 2 Children | 237 (84.3%) | 44 (15.7%) |
| 3 or 4 Children | 62 (100.0%) | 0 (0.0%) |
| 5 or more Children | 23 (100.0%) | 0 (0.0%) |
| Total | 1,600 (93.4%) | 113 (6.6%) |
Income Below Poverty Among Single-Parent Households in Conecuh County
According to the poverty data in Conecuh County, 20.6% or 33 single-father households and 21.6% or 157 single-mother households are living below the poverty line. Among single-father households, those with 1 or 2 children have the highest poverty rate, with 33 households (58.9%) experiencing poverty. Likewise, among single-mother households, those with 3 or 4 children have the highest poverty rate, with 27 households (100.0%) falling below the poverty line.
| Children | Single Father | Single Mother |
| No Children | 0 (0.0%) | 15 (4.0%) |
| 1 or 2 Children | 33 (58.9%) | 115 (35.7%) |
| 3 or 4 Children | 0 (0.0%) | 27 (100.0%) |
| 5 or more Children | 0 (0.0%) | 0 (0.0%) |
| Total | 33 (20.6%) | 157 (21.6%) |
Income Below Poverty Among Married-Couple vs Single-Parent Households in Conecuh County
The poverty data for Conecuh County shows that 113 of the married-couple family households (6.6%) and 190 of the single-parent households (21.4%) are living below the poverty level. Within the married-couple family households, those with 1 or 2 children have the highest poverty rate, with 44 households (15.7%) falling below the poverty line. Among the single-parent households, those with 3 or 4 children have the highest poverty rate, with 27 household (100.0%) living below poverty.
| Children | Married-Couple Families | Single-Parent Households |
| No Children | 69 (5.1%) | 15 (3.1%) |
| 1 or 2 Children | 44 (15.7%) | 148 (39.2%) |
| 3 or 4 Children | 0 (0.0%) | 27 (100.0%) |
| 5 or more Children | 0 (0.0%) | 0 (0.0%) |
| Total | 113 (6.6%) | 190 (21.4%) |
Race in Conecuh County
The most populous races in Conecuh County are White / Caucasian (5,751 | 49.7%), Black / African American (5,611 | 48.5%), and Two or more Races (121 | 1.1%).
| Race | # Population | % Population |
| Asian | 36 | 0.3% |
| Black / African American | 5,611 | 48.5% |
| Hawaiian / Pacific | 0 | 0.0% |
| Hispanic or Latino | 80 | 0.7% |
| Native / Alaskan | 33 | 0.3% |
| White / Caucasian | 5,751 | 49.7% |
| Two or more Races | 121 | 1.1% |
| Some other Race | 24 | 0.2% |
| Total | 11,576 | 100.0% |
Ancestry in Conecuh County
The most populous ancestries reported in Conecuh County are American (958 | 8.3%), Irish (796 | 6.9%), English (694 | 6.0%), French (250 | 2.2%), and European (127 | 1.1%), together accounting for 24.4% of all Conecuh County residents.
| Ancestry | # Population | % Population |
| African | 24 | 0.2% |
| American | 958 | 8.3% |
| British | 117 | 1.0% |
| Central American | 12 | 0.1% |
| Cherokee | 9 | 0.1% |
| Creek | 24 | 0.2% |
| Dutch | 3 | 0.0% |
| English | 694 | 6.0% |
| European | 127 | 1.1% |
| French | 250 | 2.2% |
| German | 111 | 1.0% |
| German Russian | 67 | 0.6% |
| Haitian | 9 | 0.1% |
| Irish | 796 | 6.9% |
| Italian | 4 | 0.0% |
| Korean | 72 | 0.6% |
| Northern European | 18 | 0.2% |
| Norwegian | 5 | 0.0% |
| Polish | 2 | 0.0% |
| Puerto Rican | 58 | 0.5% |
| Salvadoran | 12 | 0.1% |
| Scotch-Irish | 118 | 1.0% |
| Scottish | 54 | 0.5% |
| Spanish | 5 | 0.0% |
| Subsaharan African | 24 | 0.2% |
| Swedish | 9 | 0.1% |
| Thai | 9 | 0.1% |
| Welsh | 30 | 0.3% | View All 28 Rows |
Immigrants in Conecuh County
The most numerous immigrant groups reported in Conecuh County came from Asia (36 | 0.3%), Philippines (36 | 0.3%), South Eastern Asia (36 | 0.3%), Latin America (32 | 0.3%), and Europe (28 | 0.2%), together accounting for 1.4% of all Conecuh County residents.
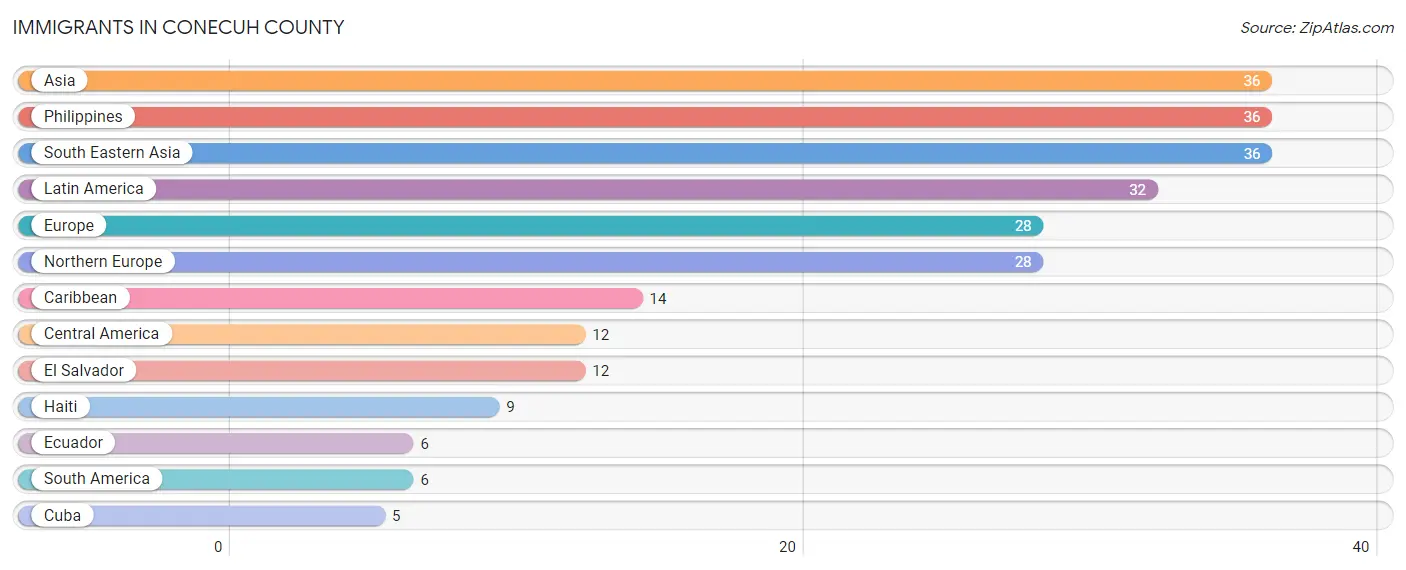
| Immigration Origin | # Population | % Population |
| Asia | 36 | 0.3% |
| Caribbean | 14 | 0.1% |
| Central America | 12 | 0.1% |
| Cuba | 5 | 0.0% |
| Ecuador | 6 | 0.1% |
| El Salvador | 12 | 0.1% |
| Europe | 28 | 0.2% |
| Haiti | 9 | 0.1% |
| Latin America | 32 | 0.3% |
| Northern Europe | 28 | 0.2% |
| Philippines | 36 | 0.3% |
| South America | 6 | 0.1% |
| South Eastern Asia | 36 | 0.3% | View All 13 Rows |
Sex and Age in Conecuh County
Sex and Age in Conecuh County
The most populous age groups in Conecuh County are 60 to 64 Years (526 | 9.3%) for men and 60 to 64 Years (527 | 8.9%) for women.
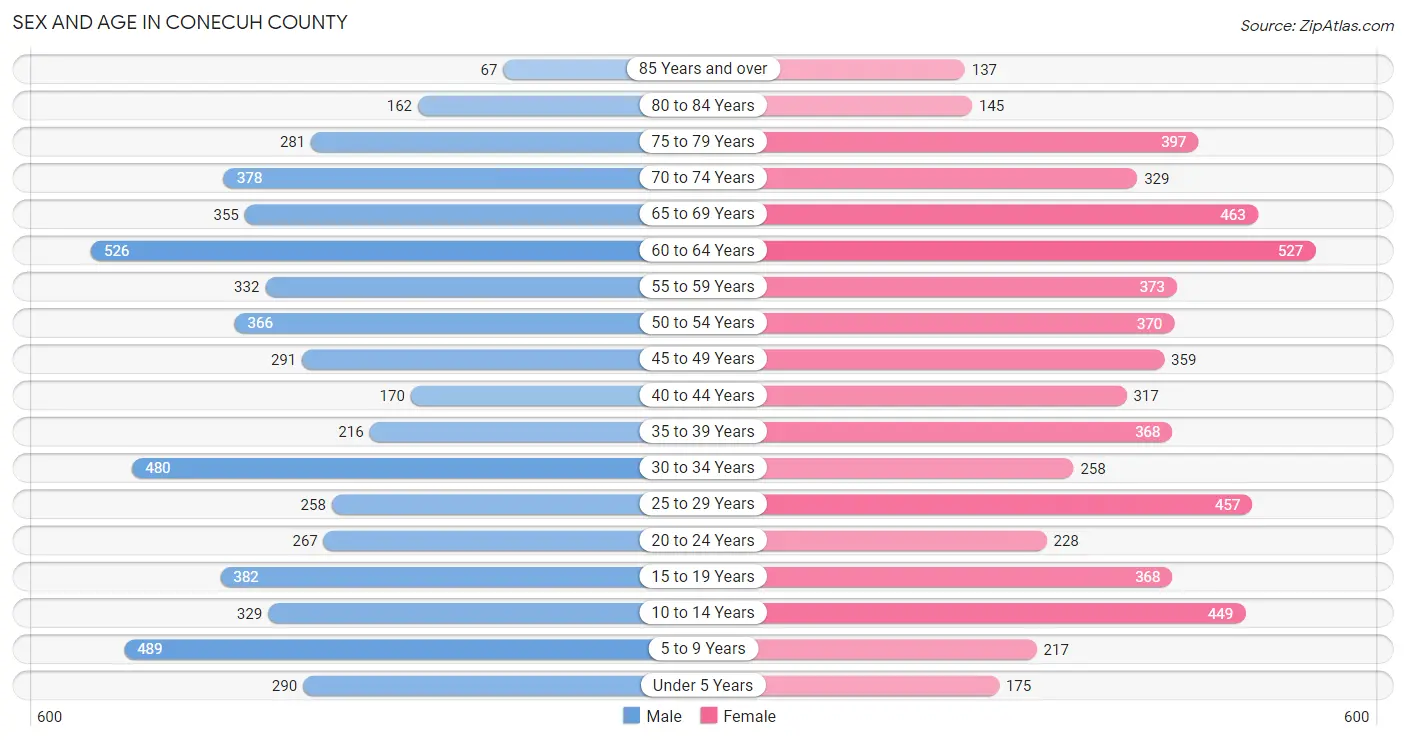
| Age Bracket | Male | Female |
| Under 5 Years | 290 (5.1%) | 175 (2.9%) |
| 5 to 9 Years | 489 (8.7%) | 217 (3.7%) |
| 10 to 14 Years | 329 (5.8%) | 449 (7.6%) |
| 15 to 19 Years | 382 (6.8%) | 368 (6.2%) |
| 20 to 24 Years | 267 (4.7%) | 228 (3.8%) |
| 25 to 29 Years | 258 (4.6%) | 457 (7.7%) |
| 30 to 34 Years | 480 (8.5%) | 258 (4.3%) |
| 35 to 39 Years | 216 (3.8%) | 368 (6.2%) |
| 40 to 44 Years | 170 (3.0%) | 317 (5.3%) |
| 45 to 49 Years | 291 (5.2%) | 359 (6.0%) |
| 50 to 54 Years | 366 (6.5%) | 370 (6.2%) |
| 55 to 59 Years | 332 (5.9%) | 373 (6.3%) |
| 60 to 64 Years | 526 (9.3%) | 527 (8.9%) |
| 65 to 69 Years | 355 (6.3%) | 463 (7.8%) |
| 70 to 74 Years | 378 (6.7%) | 329 (5.5%) |
| 75 to 79 Years | 281 (5.0%) | 397 (6.7%) |
| 80 to 84 Years | 162 (2.9%) | 145 (2.4%) |
| 85 Years and over | 67 (1.2%) | 137 (2.3%) |
| Total | 5,639 (100.0%) | 5,937 (100.0%) |
Families and Households in Conecuh County
Median Family Size in Conecuh County
The median family size in Conecuh County is 3.59 persons per family, with single male/father families (160 | 6.1%) accounting for the largest median family size of 4.88 persons per family. On the other hand, married-couple families (1,713 | 65.9%) represent the smallest median family size with 3.20 persons per family.
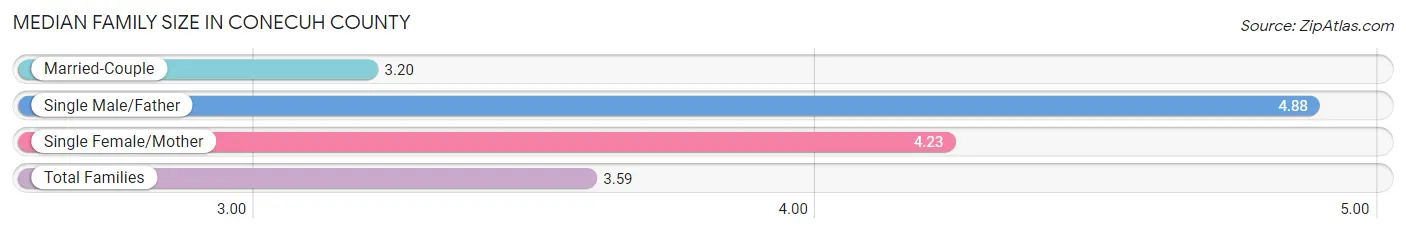
| Family Type | # Families | Family Size |
| Married-Couple | 1,713 (65.9%) | 3.20 |
| Single Male/Father | 160 (6.1%) | 4.88 |
| Single Female/Mother | 728 (28.0%) | 4.23 |
| Total Families | 2,601 (100.0%) | 3.59 |
Median Household Size in Conecuh County
The median household size in Conecuh County is 2.59 persons per household, with single male/father households (160 | 3.6%) accounting for the largest median household size of 5.24 persons per household. non-family households (1,852 | 41.6%) represent the smallest median household size with 1.08 persons per household.
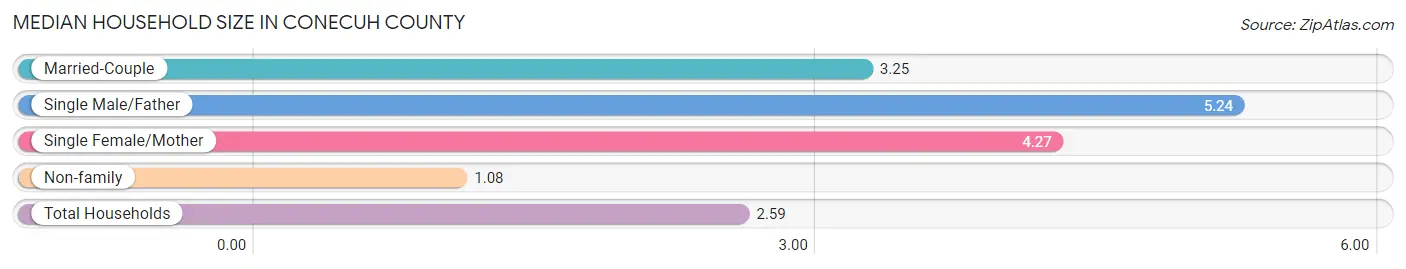
| Household Type | # Households | Household Size |
| Married-Couple | 1,713 (38.5%) | 3.25 |
| Single Male/Father | 160 (3.6%) | 5.24 |
| Single Female/Mother | 728 (16.4%) | 4.27 |
| Non-family | 1,852 (41.6%) | 1.08 |
| Total Households | 4,453 (100.0%) | 2.59 |
Household Size by Marriage Status in Conecuh County
Out of a total of 4,453 households in Conecuh County, 2,601 (58.4%) are family households, while 1,852 (41.6%) are nonfamily households. The most numerous type of family households are 2-person households, comprising 1,524, and the most common type of nonfamily households are 1-person households, comprising 1,785.
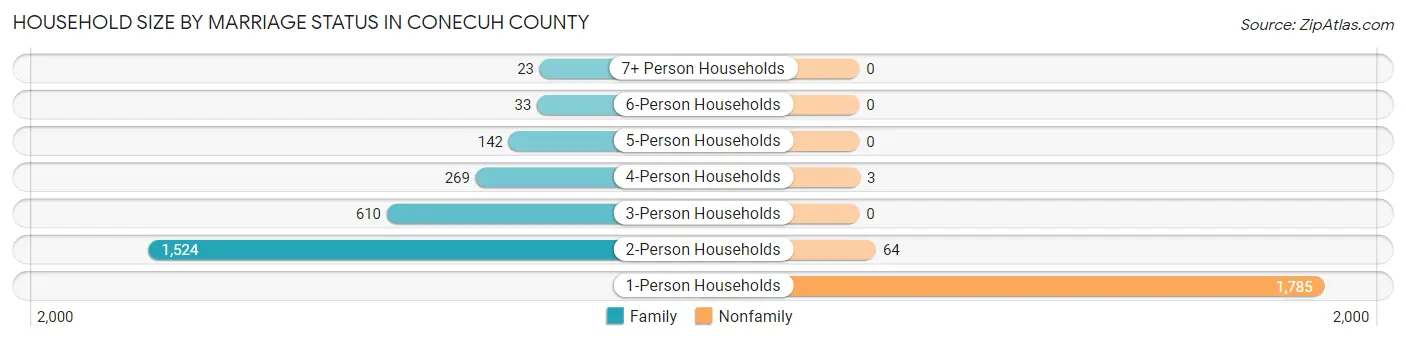
| Household Size | Family Households | Nonfamily Households |
| 1-Person Households | - | 1,785 (40.1%) |
| 2-Person Households | 1,524 (34.2%) | 64 (1.4%) |
| 3-Person Households | 610 (13.7%) | 0 (0.0%) |
| 4-Person Households | 269 (6.0%) | 3 (0.1%) |
| 5-Person Households | 142 (3.2%) | 0 (0.0%) |
| 6-Person Households | 33 (0.7%) | 0 (0.0%) |
| 7+ Person Households | 23 (0.5%) | 0 (0.0%) |
| Total | 2,601 (58.4%) | 1,852 (41.6%) |
Female Fertility in Conecuh County
Fertility by Age in Conecuh County
Average fertility rate in Conecuh County is 51.0 births per 1,000 women. Women in the age bracket of 20 to 34 years have the highest fertility rate with 129.0 births per 1,000 women. Women in the age bracket of 20 to 34 years acount for 100.0% of all women with births.
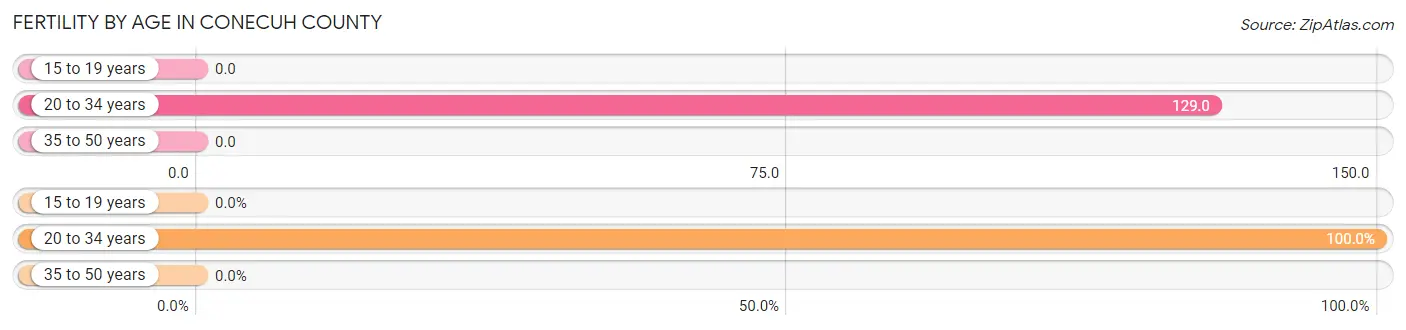
| Age Bracket | Women with Births | Births / 1,000 Women |
| 15 to 19 years | 0 (0.0%) | 0.0 |
| 20 to 34 years | 122 (100.0%) | 129.0 |
| 35 to 50 years | 0 (0.0%) | 0.0 |
| Total | 122 (100.0%) | 51.0 |
Fertility by Age by Marriage Status in Conecuh County
39.3% of women with births (122) in Conecuh County are married. The highest percentage of unmarried women with births falls into 20 to 34 years age bracket with 60.7% of them unmarried at the time of birth, while the lowest percentage of unmarried women with births belong to 20 to 34 years age bracket with 60.7% of them unmarried.
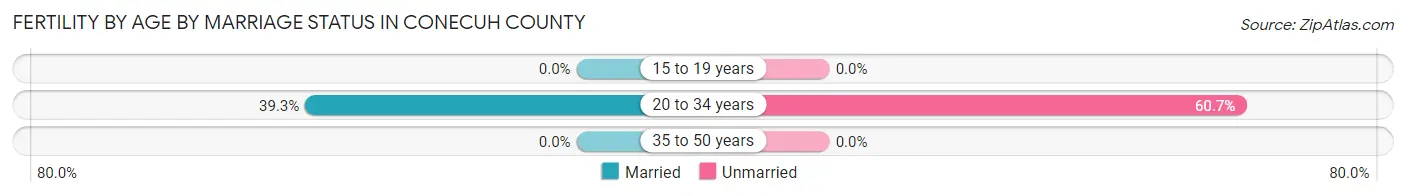
| Age Bracket | Married | Unmarried |
| 15 to 19 years | 0 (0.0%) | 0 (0.0%) |
| 20 to 34 years | 48 (39.3%) | 74 (60.7%) |
| 35 to 50 years | 0 (0.0%) | 0 (0.0%) |
| Total | 48 (39.3%) | 74 (60.7%) |
Fertility by Education in Conecuh County
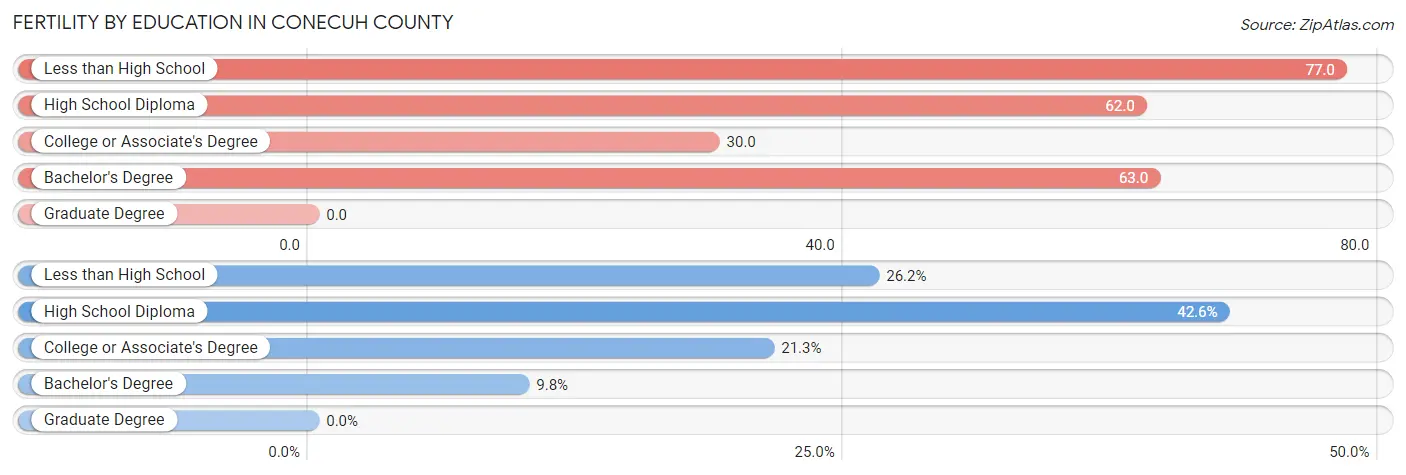
| Educational Attainment | Women with Births | Births / 1,000 Women |
| Less than High School | 32 (26.2%) | 77.0 |
| High School Diploma | 52 (42.6%) | 62.0 |
| College or Associate's Degree | 26 (21.3%) | 30.0 |
| Bachelor's Degree | 12 (9.8%) | 63.0 |
| Graduate Degree | 0 (0.0%) | 0.0 |
| Total | 122 (100.0%) | 51.0 |
Fertility by Education by Marriage Status in Conecuh County
60.7% of women with births in Conecuh County are unmarried. Women with the educational attainment of college or associate's degree are most likely to be married with 100.0% of them married at childbirth, while women with the educational attainment of less than high school are least likely to be married with 100.0% of them unmarried at childbirth.
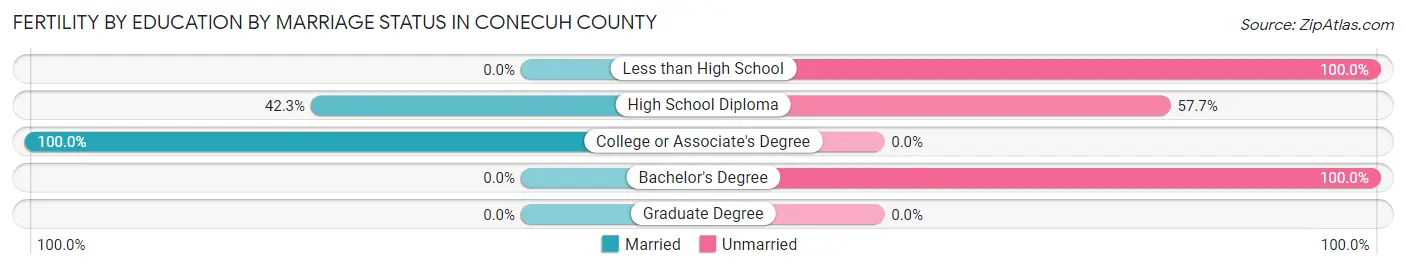
| Educational Attainment | Married | Unmarried |
| Less than High School | 0 (0.0%) | 32 (100.0%) |
| High School Diploma | 22 (42.3%) | 30 (57.7%) |
| College or Associate's Degree | 26 (100.0%) | 0 (0.0%) |
| Bachelor's Degree | 0 (0.0%) | 12 (100.0%) |
| Graduate Degree | 0 (0.0%) | 0 (0.0%) |
| Total | 48 (39.3%) | 74 (60.7%) |
Employment Characteristics in Conecuh County
Employment by Class of Employer in Conecuh County
Among the 3,664 employed individuals in Conecuh County, private company employees (2,740 | 74.8%), local government employees (253 | 6.9%), and state government employees (251 | 6.9%) make up the most common classes of employment.
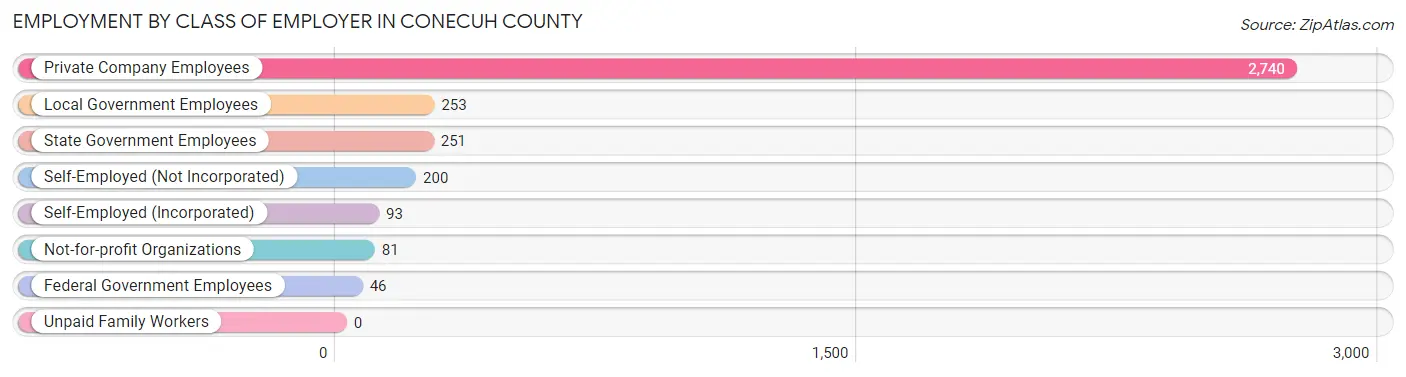
| Employer Class | # Employees | % Employees |
| Private Company Employees | 2,740 | 74.8% |
| Self-Employed (Incorporated) | 93 | 2.5% |
| Self-Employed (Not Incorporated) | 200 | 5.5% |
| Not-for-profit Organizations | 81 | 2.2% |
| Local Government Employees | 253 | 6.9% |
| State Government Employees | 251 | 6.9% |
| Federal Government Employees | 46 | 1.3% |
| Unpaid Family Workers | 0 | 0.0% |
| Total | 3,664 | 100.0% |
Employment Status by Age in Conecuh County
According to the labor force statistics for Conecuh County, out of the total population over 16 years of age (9,568), 41.1% or 3,932 individuals are in the labor force, with 4.4% or 173 of them unemployed. The age group with the highest labor force participation rate is 25 to 29 years, with 72.2% or 516 individuals in the labor force. Within the labor force, the 16 to 19 years age range has the highest percentage of unemployed individuals, with 18.9% or 32 of them being unemployed.
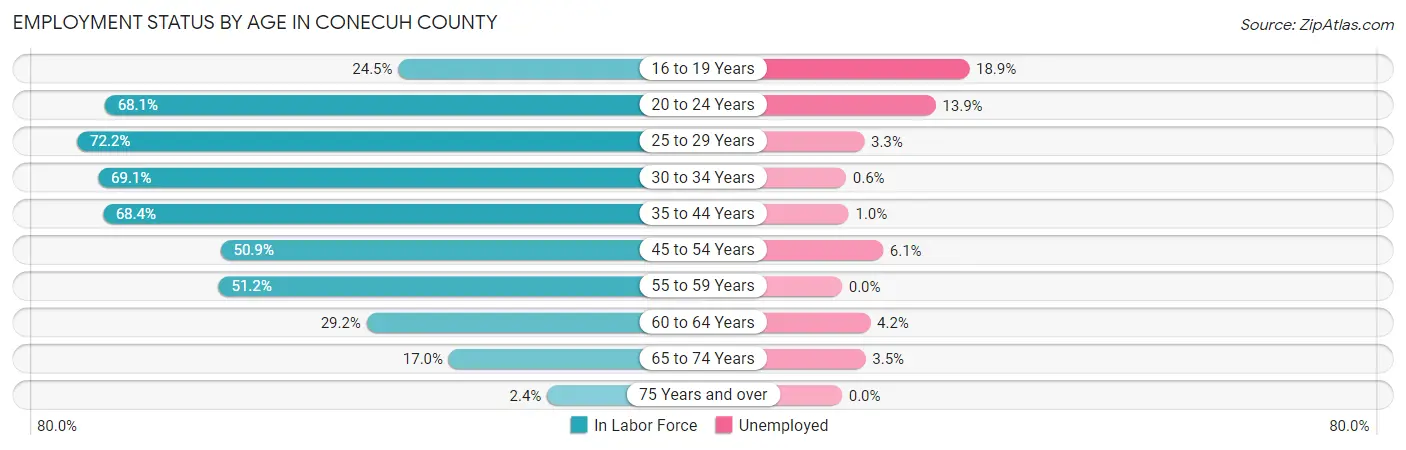
| Age Bracket | In Labor Force | Unemployed |
| 16 to 19 Years | 169 (24.5%) | 32 (18.9%) |
| 20 to 24 Years | 337 (68.1%) | 47 (13.9%) |
| 25 to 29 Years | 516 (72.2%) | 17 (3.3%) |
| 30 to 34 Years | 510 (69.1%) | 3 (0.6%) |
| 35 to 44 Years | 733 (68.4%) | 7 (1.0%) |
| 45 to 54 Years | 705 (50.9%) | 43 (6.1%) |
| 55 to 59 Years | 361 (51.2%) | 0 (0.0%) |
| 60 to 64 Years | 307 (29.2%) | 13 (4.2%) |
| 65 to 74 Years | 259 (17.0%) | 9 (3.5%) |
| 75 Years and over | 29 (2.4%) | 0 (0.0%) |
| Total | 3,932 (41.1%) | 173 (4.4%) |
Employment Status by Educational Attainment in Conecuh County
According to labor force statistics for Conecuh County, 55.3% of individuals (3,134) out of the total population between 25 and 64 years of age (5,668) are in the labor force, with 2.6% or 81 of them being unemployed. The group with the highest labor force participation rate are those with the educational attainment of bachelor's degree or higher, with 62.7% or 477 individuals in the labor force. Within the labor force, individuals with less than high school education have the highest percentage of unemployment, with 11.8% or 27 of them being unemployed.
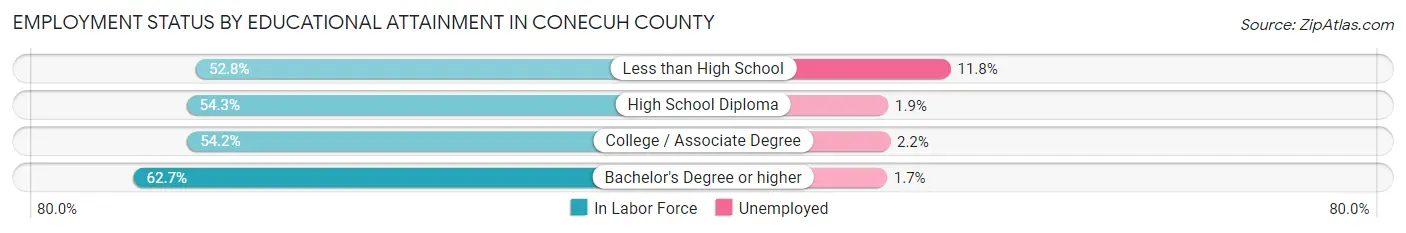
| Educational Attainment | In Labor Force | Unemployed |
| Less than High School | 229 (52.8%) | 51 (11.8%) |
| High School Diploma | 1,457 (54.3%) | 51 (1.9%) |
| College / Associate Degree | 970 (54.2%) | 39 (2.2%) |
| Bachelor's Degree or higher | 477 (62.7%) | 13 (1.7%) |
| Total | 3,134 (55.3%) | 147 (2.6%) |
Employment Occupations by Sex in Conecuh County
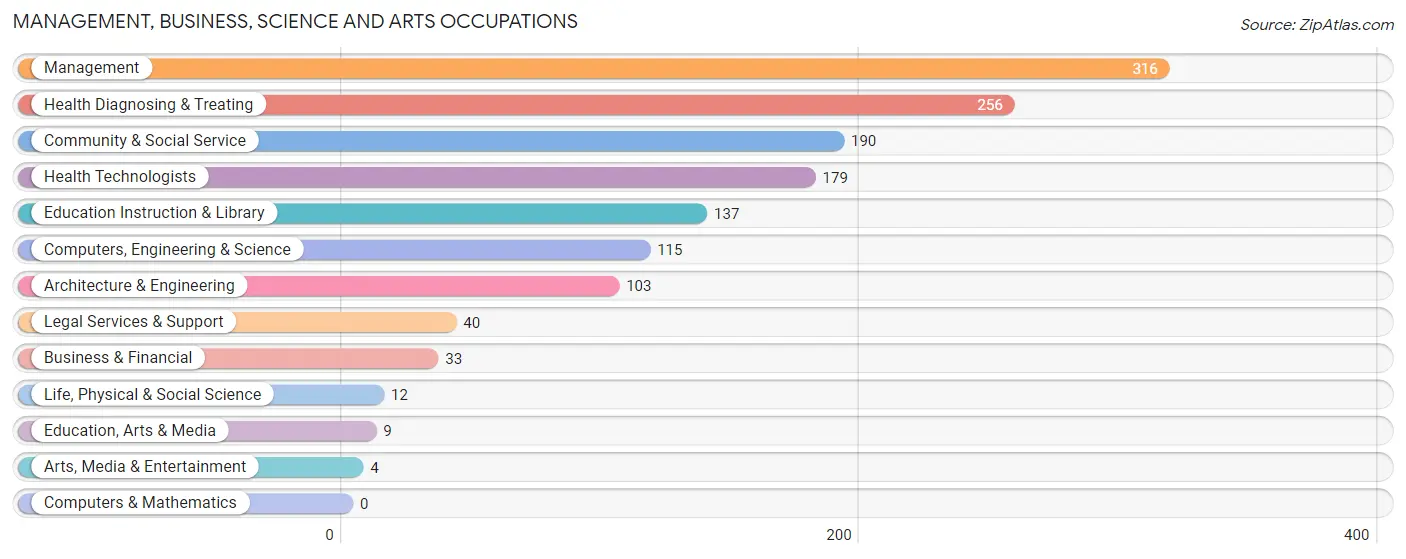
Management, Business, Science and Arts Occupations
The most common Management, Business, Science and Arts occupations in Conecuh County are Management (316 | 8.4%), Health Diagnosing & Treating (256 | 6.8%), Community & Social Service (190 | 5.1%), Health Technologists (179 | 4.8%), and Education Instruction & Library (137 | 3.6%).
Management, Business, Science and Arts Occupations by Sex
Within the Management, Business, Science and Arts occupations in Conecuh County, the most male-oriented occupations are Computers, Engineering & Science (100.0%), Architecture & Engineering (100.0%), and Life, Physical & Social Science (100.0%), while the most female-oriented occupations are Education, Arts & Media (100.0%), Education Instruction & Library (100.0%), and Business & Financial (81.8%).
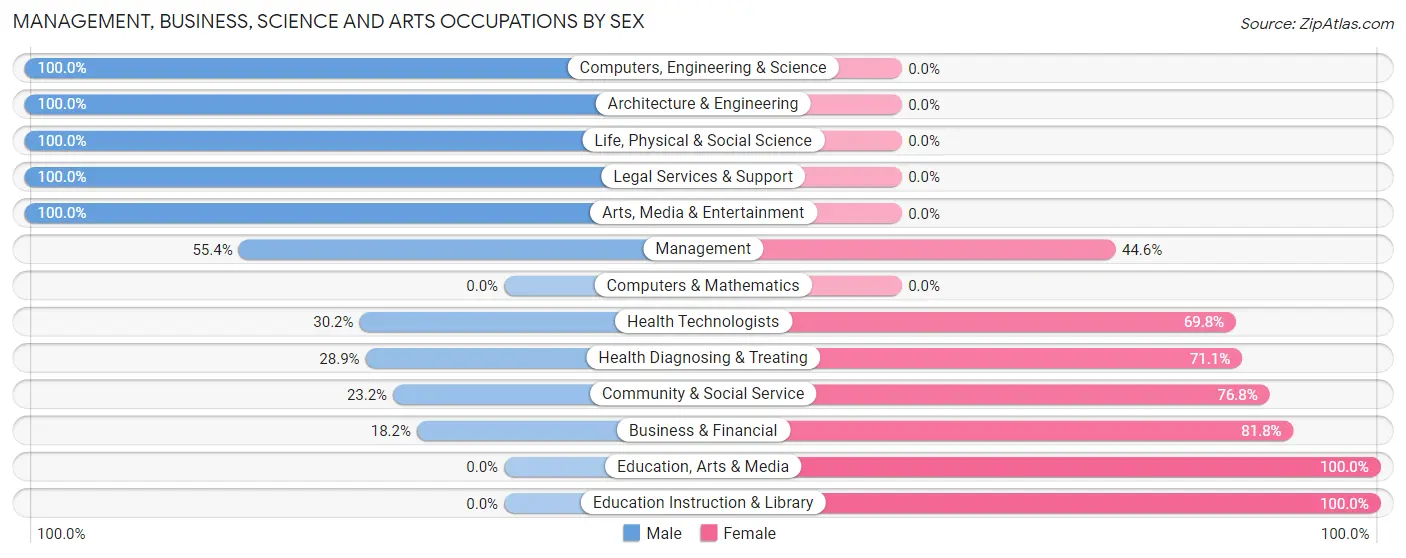
| Occupation | Male | Female |
| Management | 175 (55.4%) | 141 (44.6%) |
| Business & Financial | 6 (18.2%) | 27 (81.8%) |
| Computers, Engineering & Science | 115 (100.0%) | 0 (0.0%) |
| Computers & Mathematics | 0 (0.0%) | 0 (0.0%) |
| Architecture & Engineering | 103 (100.0%) | 0 (0.0%) |
| Life, Physical & Social Science | 12 (100.0%) | 0 (0.0%) |
| Community & Social Service | 44 (23.2%) | 146 (76.8%) |
| Education, Arts & Media | 0 (0.0%) | 9 (100.0%) |
| Legal Services & Support | 40 (100.0%) | 0 (0.0%) |
| Education Instruction & Library | 0 (0.0%) | 137 (100.0%) |
| Arts, Media & Entertainment | 4 (100.0%) | 0 (0.0%) |
| Health Diagnosing & Treating | 74 (28.9%) | 182 (71.1%) |
| Health Technologists | 54 (30.2%) | 125 (69.8%) |
| Total (Category) | 414 (45.5%) | 496 (54.5%) |
| Total (Overall) | 1,999 (53.2%) | 1,758 (46.8%) |
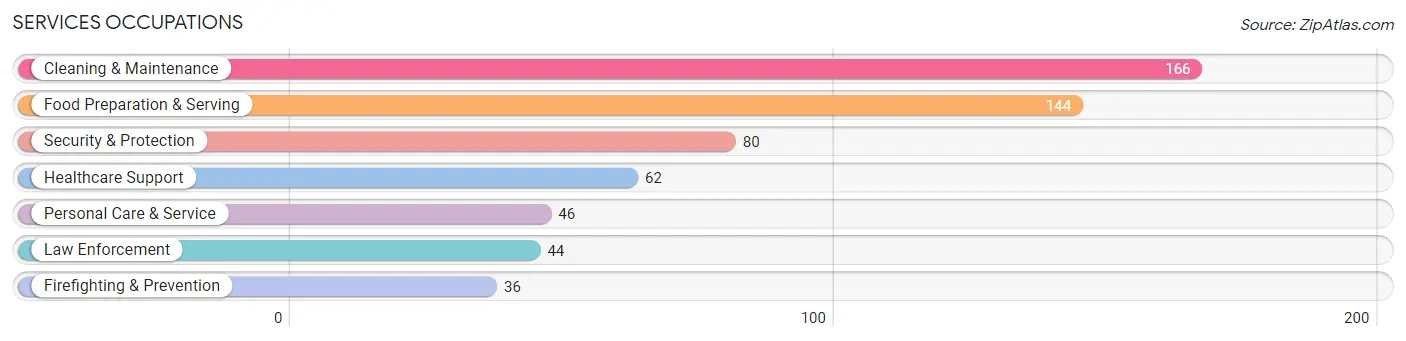
Services Occupations
The most common Services occupations in Conecuh County are Cleaning & Maintenance (166 | 4.4%), Food Preparation & Serving (144 | 3.8%), Security & Protection (80 | 2.1%), Healthcare Support (62 | 1.7%), and Personal Care & Service (46 | 1.2%).
Services Occupations by Sex
Within the Services occupations in Conecuh County, the most male-oriented occupations are Security & Protection (100.0%), Firefighting & Prevention (100.0%), and Law Enforcement (100.0%), while the most female-oriented occupations are Healthcare Support (100.0%), Food Preparation & Serving (91.0%), and Personal Care & Service (58.7%).
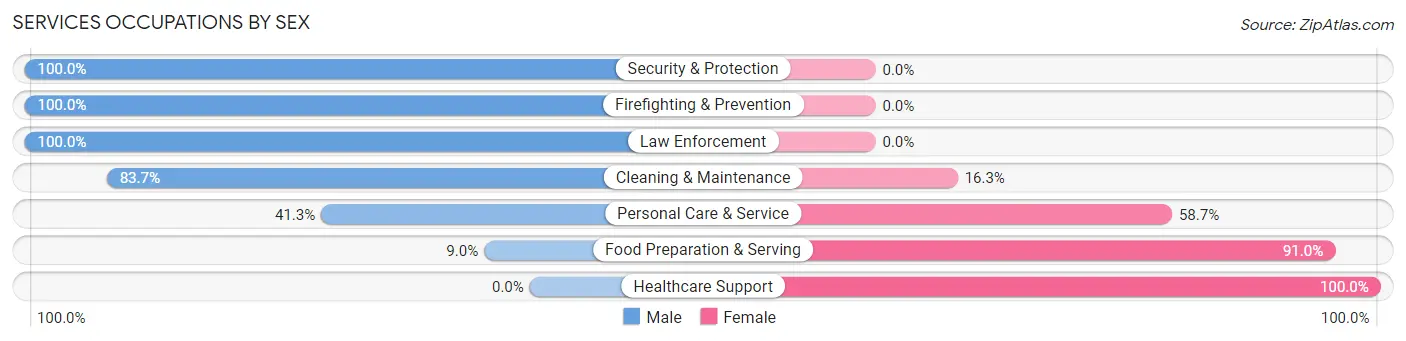
| Occupation | Male | Female |
| Healthcare Support | 0 (0.0%) | 62 (100.0%) |
| Security & Protection | 80 (100.0%) | 0 (0.0%) |
| Firefighting & Prevention | 36 (100.0%) | 0 (0.0%) |
| Law Enforcement | 44 (100.0%) | 0 (0.0%) |
| Food Preparation & Serving | 13 (9.0%) | 131 (91.0%) |
| Cleaning & Maintenance | 139 (83.7%) | 27 (16.3%) |
| Personal Care & Service | 19 (41.3%) | 27 (58.7%) |
| Total (Category) | 251 (50.4%) | 247 (49.6%) |
| Total (Overall) | 1,999 (53.2%) | 1,758 (46.8%) |
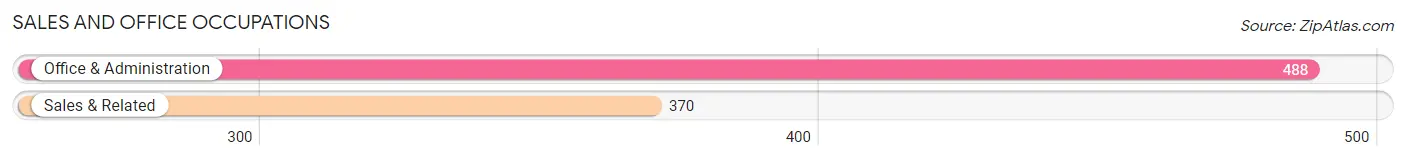
Sales and Office Occupations
The most common Sales and Office occupations in Conecuh County are Office & Administration (488 | 13.0%), and Sales & Related (370 | 9.9%).
Sales and Office Occupations by Sex
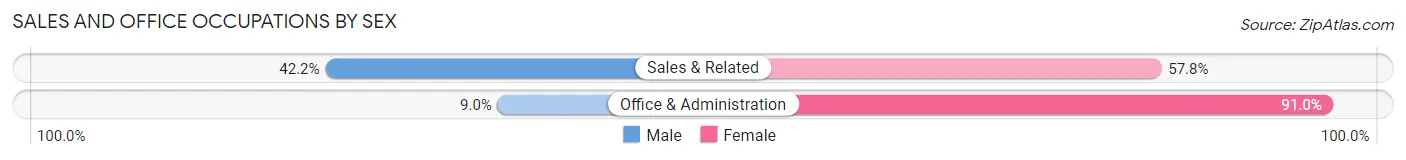
| Occupation | Male | Female |
| Sales & Related | 156 (42.2%) | 214 (57.8%) |
| Office & Administration | 44 (9.0%) | 444 (91.0%) |
| Total (Category) | 200 (23.3%) | 658 (76.7%) |
| Total (Overall) | 1,999 (53.2%) | 1,758 (46.8%) |
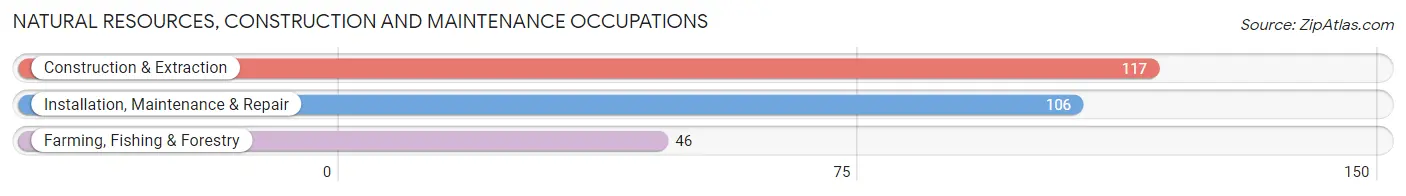
Natural Resources, Construction and Maintenance Occupations
The most common Natural Resources, Construction and Maintenance occupations in Conecuh County are Construction & Extraction (117 | 3.1%), Installation, Maintenance & Repair (106 | 2.8%), and Farming, Fishing & Forestry (46 | 1.2%).
Natural Resources, Construction and Maintenance Occupations by Sex
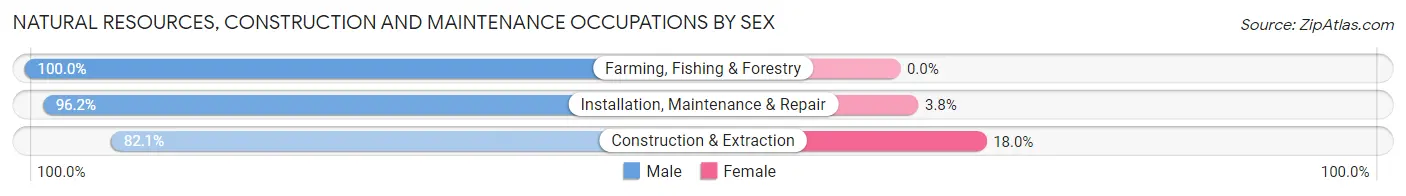
| Occupation | Male | Female |
| Farming, Fishing & Forestry | 46 (100.0%) | 0 (0.0%) |
| Construction & Extraction | 96 (82.1%) | 21 (17.9%) |
| Installation, Maintenance & Repair | 102 (96.2%) | 4 (3.8%) |
| Total (Category) | 244 (90.7%) | 25 (9.3%) |
| Total (Overall) | 1,999 (53.2%) | 1,758 (46.8%) |
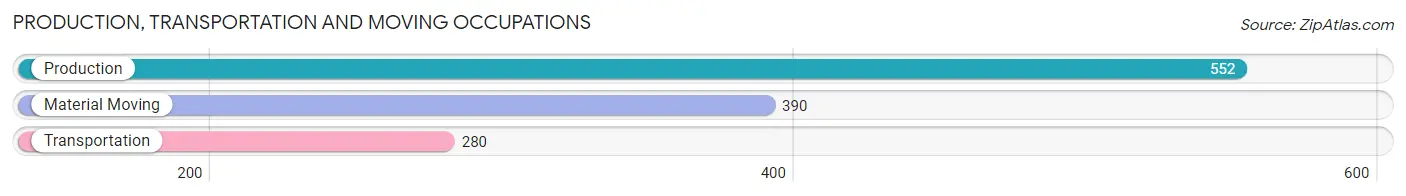
Production, Transportation and Moving Occupations
The most common Production, Transportation and Moving occupations in Conecuh County are Production (552 | 14.7%), Material Moving (390 | 10.4%), and Transportation (280 | 7.4%).
Production, Transportation and Moving Occupations by Sex
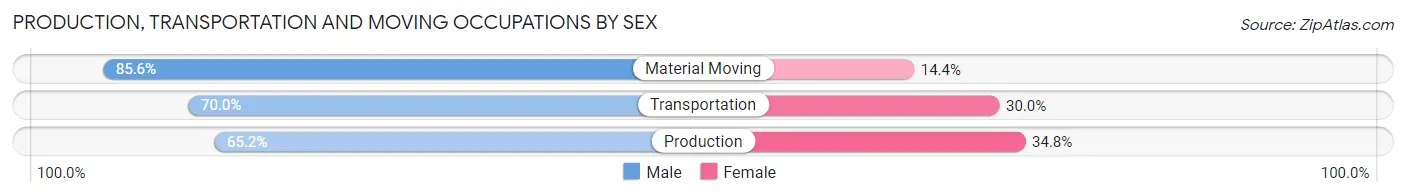
| Occupation | Male | Female |
| Production | 360 (65.2%) | 192 (34.8%) |
| Transportation | 196 (70.0%) | 84 (30.0%) |
| Material Moving | 334 (85.6%) | 56 (14.4%) |
| Total (Category) | 890 (72.8%) | 332 (27.2%) |
| Total (Overall) | 1,999 (53.2%) | 1,758 (46.8%) |
Employment Industries by Sex in Conecuh County
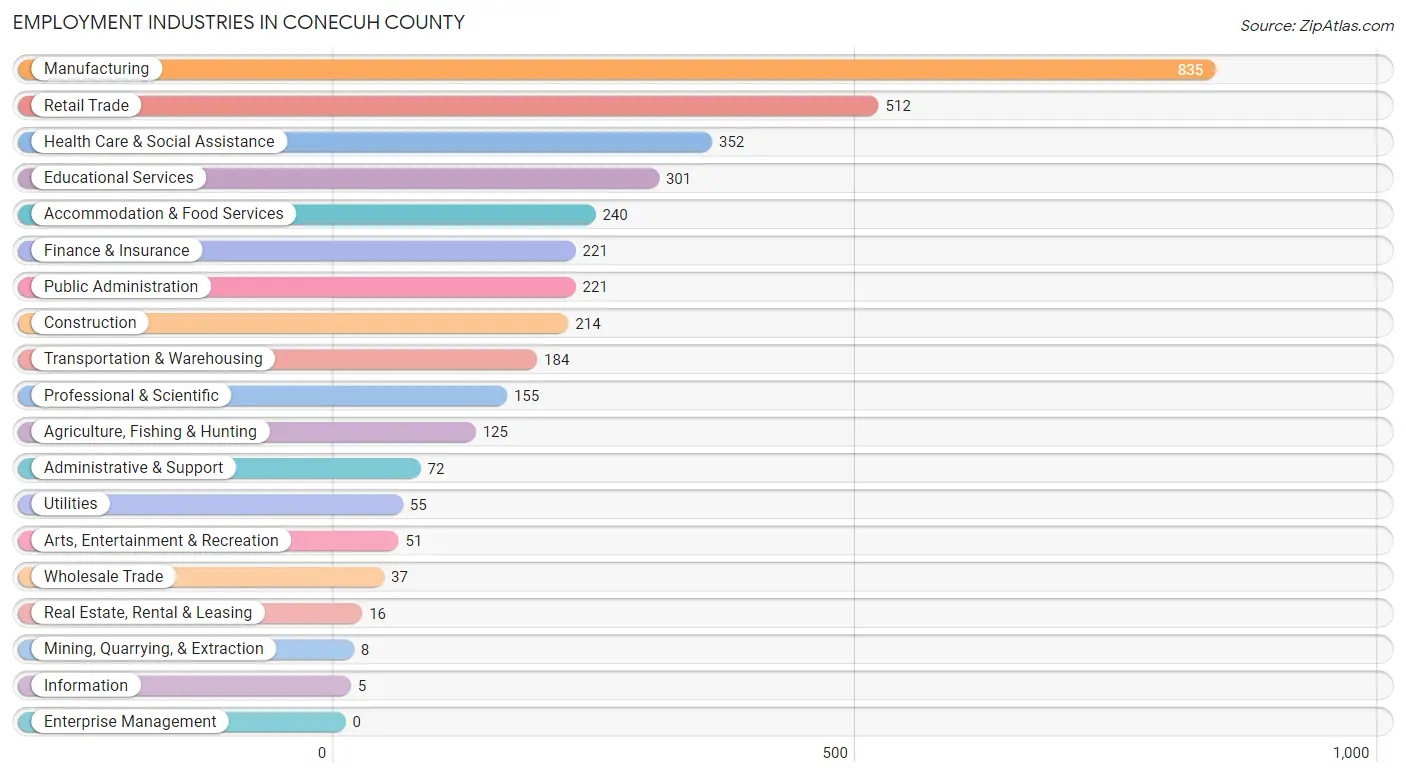
Employment Industries in Conecuh County
The major employment industries in Conecuh County include Manufacturing (835 | 22.2%), Retail Trade (512 | 13.6%), Health Care & Social Assistance (352 | 9.4%), Educational Services (301 | 8.0%), and Accommodation & Food Services (240 | 6.4%).
Employment Industries by Sex in Conecuh County
The Conecuh County industries that see more men than women are Mining, Quarrying, & Extraction (100.0%), Wholesale Trade (100.0%), and Utilities (100.0%), whereas the industries that tend to have a higher number of women are Finance & Insurance (100.0%), Arts, Entertainment & Recreation (86.3%), and Educational Services (83.7%).
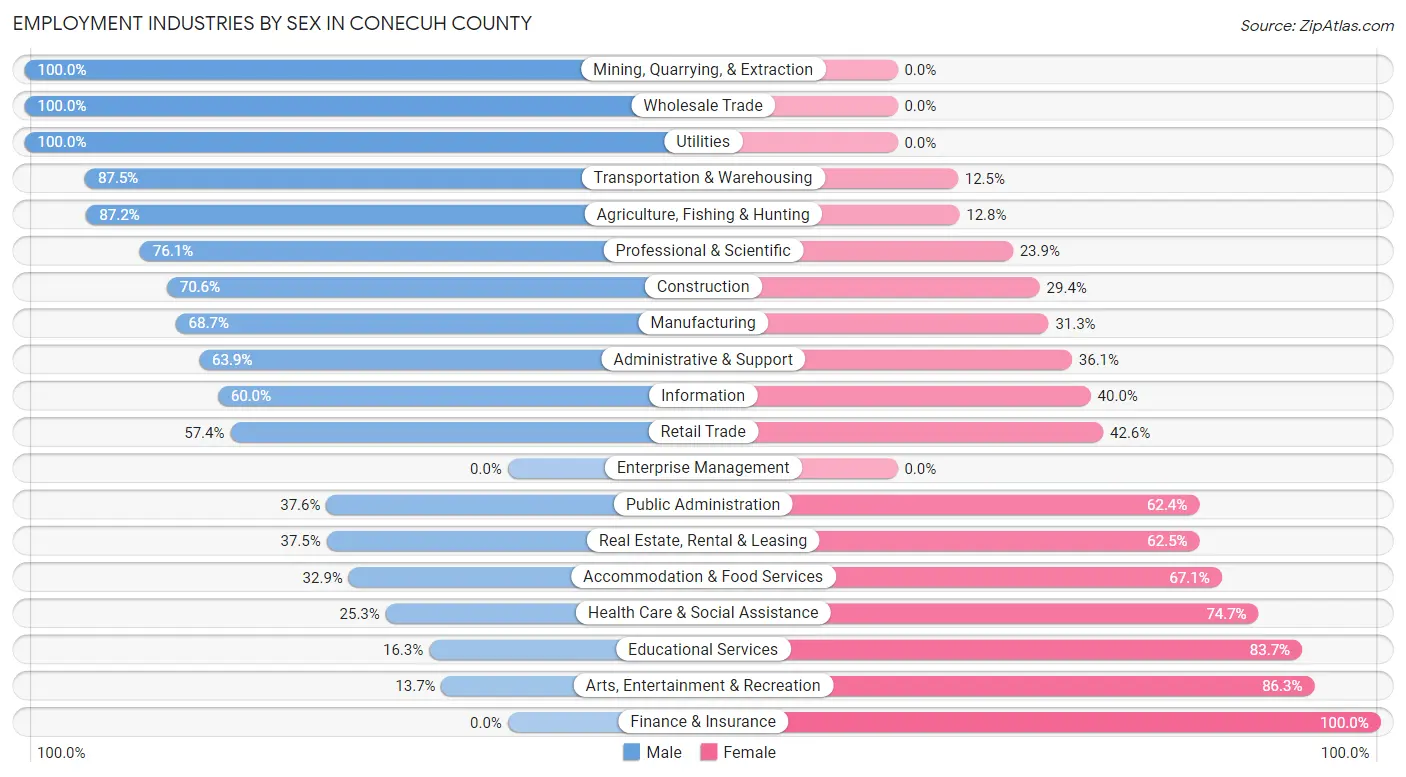
| Industry | Male | Female |
| Agriculture, Fishing & Hunting | 109 (87.2%) | 16 (12.8%) |
| Mining, Quarrying, & Extraction | 8 (100.0%) | 0 (0.0%) |
| Construction | 151 (70.6%) | 63 (29.4%) |
| Manufacturing | 574 (68.7%) | 261 (31.3%) |
| Wholesale Trade | 37 (100.0%) | 0 (0.0%) |
| Retail Trade | 294 (57.4%) | 218 (42.6%) |
| Transportation & Warehousing | 161 (87.5%) | 23 (12.5%) |
| Utilities | 55 (100.0%) | 0 (0.0%) |
| Information | 3 (60.0%) | 2 (40.0%) |
| Finance & Insurance | 0 (0.0%) | 221 (100.0%) |
| Real Estate, Rental & Leasing | 6 (37.5%) | 10 (62.5%) |
| Professional & Scientific | 118 (76.1%) | 37 (23.9%) |
| Enterprise Management | 0 (0.0%) | 0 (0.0%) |
| Administrative & Support | 46 (63.9%) | 26 (36.1%) |
| Educational Services | 49 (16.3%) | 252 (83.7%) |
| Health Care & Social Assistance | 89 (25.3%) | 263 (74.7%) |
| Arts, Entertainment & Recreation | 7 (13.7%) | 44 (86.3%) |
| Accommodation & Food Services | 79 (32.9%) | 161 (67.1%) |
| Public Administration | 83 (37.6%) | 138 (62.4%) |
| Total | 1,999 (53.2%) | 1,758 (46.8%) |
Education in Conecuh County
School Enrollment in Conecuh County
The most common levels of schooling among the 2,365 students in Conecuh County are high school (679 | 28.7%), middle school (592 | 25.0%), and elementary school (574 | 24.3%).
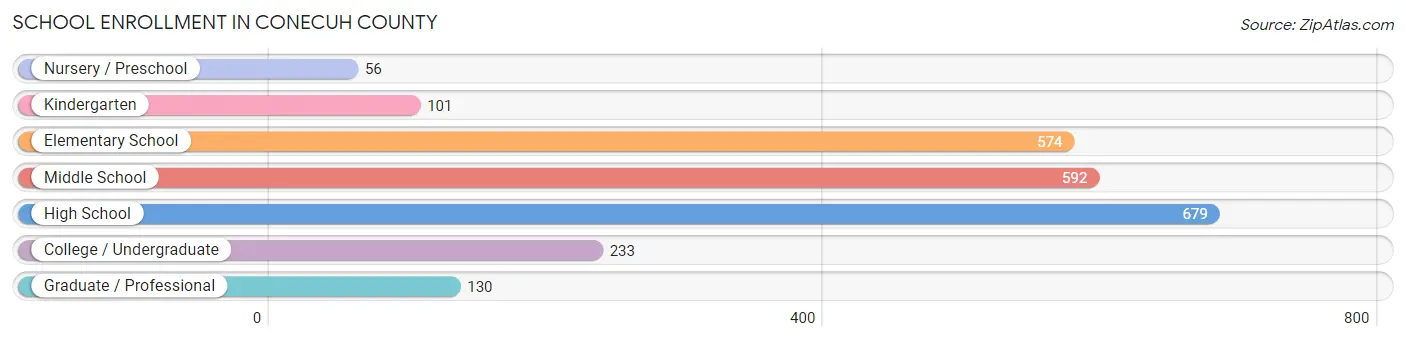
| School Level | # Students | % Students |
| Nursery / Preschool | 56 | 2.4% |
| Kindergarten | 101 | 4.3% |
| Elementary School | 574 | 24.3% |
| Middle School | 592 | 25.0% |
| High School | 679 | 28.7% |
| College / Undergraduate | 233 | 9.9% |
| Graduate / Professional | 130 | 5.5% |
| Total | 2,365 | 100.0% |
School Enrollment by Age by Funding Source in Conecuh County
Out of a total of 2,365 students who are enrolled in schools in Conecuh County, 511 (21.6%) attend a private institution, while the remaining 1,854 (78.4%) are enrolled in public schools. The age group of 3 to 4 year olds has the highest likelihood of being enrolled in private schools, with 19 (100.0% in the age bracket) enrolled. Conversely, the age group of 20 to 24 year olds has the lowest likelihood of being enrolled in a private school, with 81 (100.0% in the age bracket) attending a public institution.
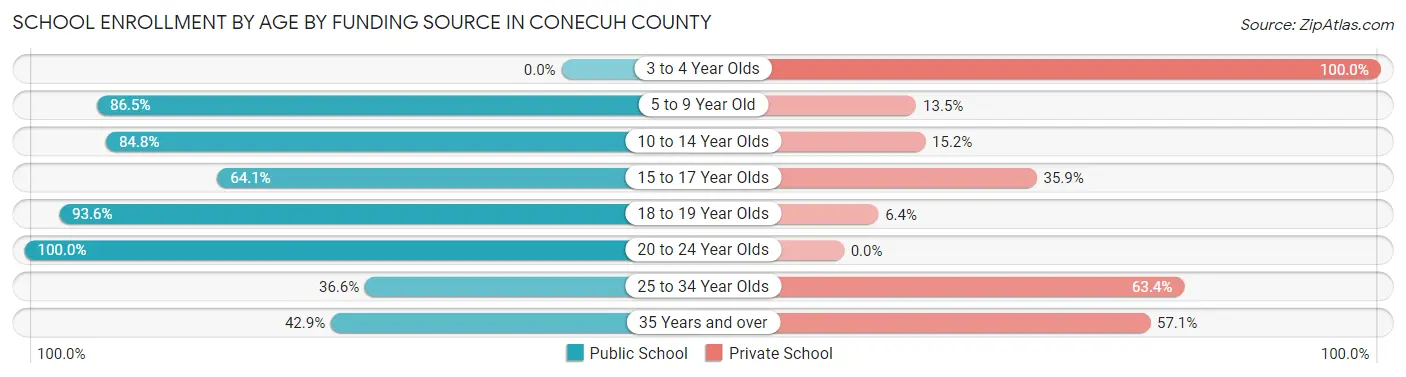
| Age Bracket | Public School | Private School |
| 3 to 4 Year Olds | 0 (0.0%) | 19 (100.0%) |
| 5 to 9 Year Old | 564 (86.5%) | 88 (13.5%) |
| 10 to 14 Year Olds | 632 (84.8%) | 113 (15.2%) |
| 15 to 17 Year Olds | 248 (64.1%) | 139 (35.9%) |
| 18 to 19 Year Olds | 233 (93.6%) | 16 (6.4%) |
| 20 to 24 Year Olds | 81 (100.0%) | 0 (0.0%) |
| 25 to 34 Year Olds | 15 (36.6%) | 26 (63.4%) |
| 35 Years and over | 82 (42.9%) | 109 (57.1%) |
| Total | 1,854 (78.4%) | 511 (21.6%) |
Educational Attainment by Field of Study in Conecuh County
Business (384 | 33.2%), education (304 | 26.3%), science & technology (110 | 9.5%), social sciences (88 | 7.6%), and arts & humanities (69 | 6.0%) are the most common fields of study among 1,156 individuals in Conecuh County who have obtained a bachelor's degree or higher.
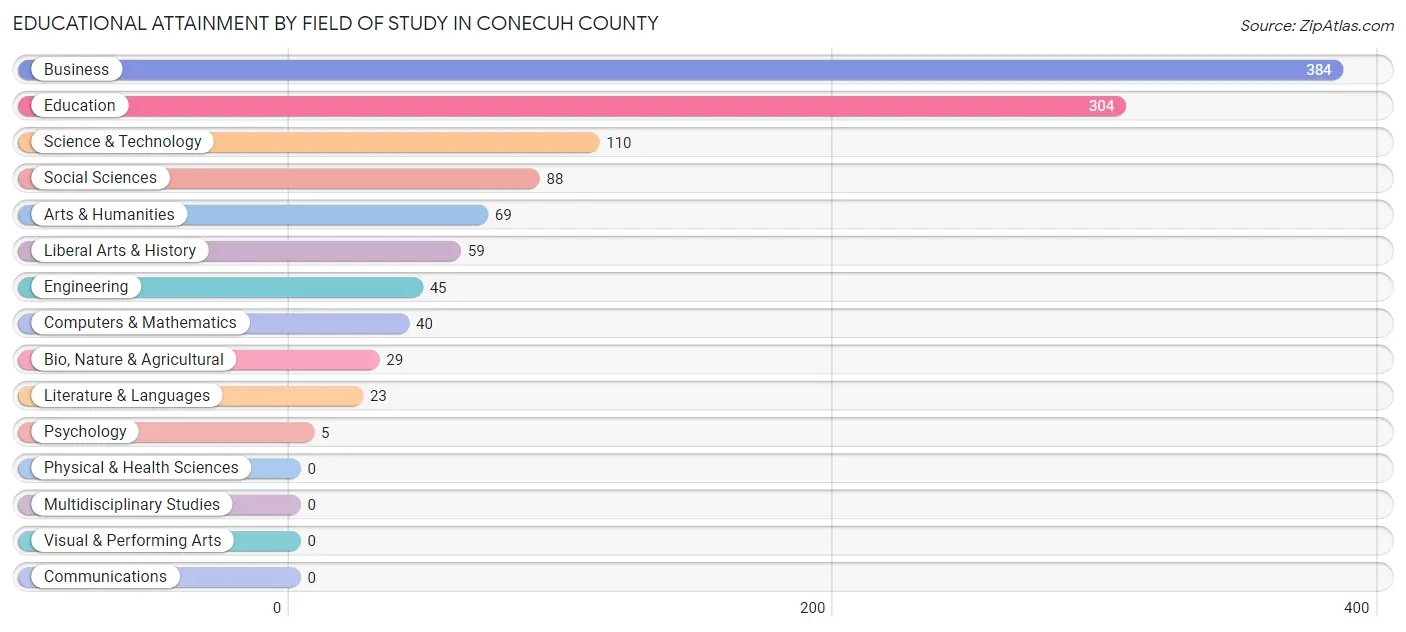
| Field of Study | # Graduates | % Graduates |
| Computers & Mathematics | 40 | 3.5% |
| Bio, Nature & Agricultural | 29 | 2.5% |
| Physical & Health Sciences | 0 | 0.0% |
| Psychology | 5 | 0.4% |
| Social Sciences | 88 | 7.6% |
| Engineering | 45 | 3.9% |
| Multidisciplinary Studies | 0 | 0.0% |
| Science & Technology | 110 | 9.5% |
| Business | 384 | 33.2% |
| Education | 304 | 26.3% |
| Literature & Languages | 23 | 2.0% |
| Liberal Arts & History | 59 | 5.1% |
| Visual & Performing Arts | 0 | 0.0% |
| Communications | 0 | 0.0% |
| Arts & Humanities | 69 | 6.0% |
| Total | 1,156 | 100.0% |
Transportation & Commute in Conecuh County
Vehicle Availability by Sex in Conecuh County
The most prevalent vehicle ownership categories in Conecuh County are males with 2 vehicles (843, accounting for 43.8%) and females with 2 vehicles (670, making up 48.5%).

| Vehicles Available | Male | Female |
| No Vehicle | 11 (0.6%) | 10 (0.6%) |
| 1 Vehicle | 353 (18.3%) | 497 (28.6%) |
| 2 Vehicles | 843 (43.8%) | 670 (38.5%) |
| 3 Vehicles | 291 (15.1%) | 273 (15.7%) |
| 4 Vehicles | 297 (15.4%) | 153 (8.8%) |
| 5 or more Vehicles | 130 (6.8%) | 136 (7.8%) |
| Total | 1,925 (100.0%) | 1,739 (100.0%) |
Commute Time in Conecuh County
The most frequently occuring commute durations in Conecuh County are 10 to 14 minutes (666 commuters, 18.5%), 30 to 34 minutes (578 commuters, 16.1%), and 20 to 24 minutes (528 commuters, 14.7%).
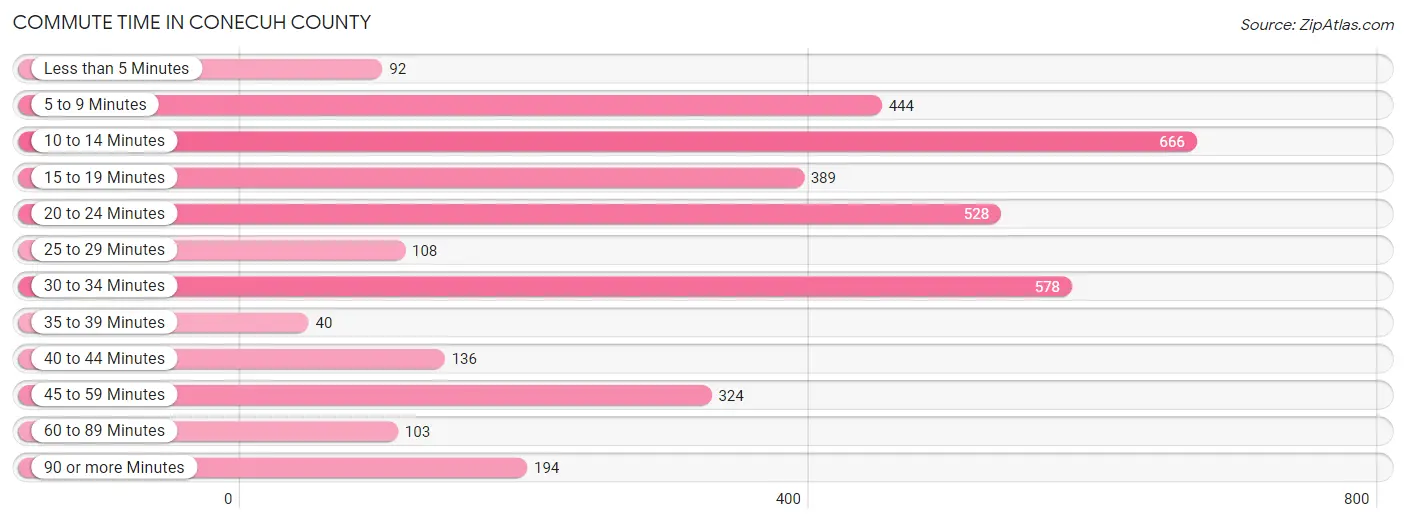
| Commute Time | # Commuters | % Commuters |
| Less than 5 Minutes | 92 | 2.5% |
| 5 to 9 Minutes | 444 | 12.3% |
| 10 to 14 Minutes | 666 | 18.5% |
| 15 to 19 Minutes | 389 | 10.8% |
| 20 to 24 Minutes | 528 | 14.7% |
| 25 to 29 Minutes | 108 | 3.0% |
| 30 to 34 Minutes | 578 | 16.1% |
| 35 to 39 Minutes | 40 | 1.1% |
| 40 to 44 Minutes | 136 | 3.8% |
| 45 to 59 Minutes | 324 | 9.0% |
| 60 to 89 Minutes | 103 | 2.9% |
| 90 or more Minutes | 194 | 5.4% |
Commute Time by Sex in Conecuh County
The most common commute times in Conecuh County are 20 to 24 minutes (302 commuters, 15.9%) for males and 30 to 34 minutes (417 commuters, 24.5%) for females.
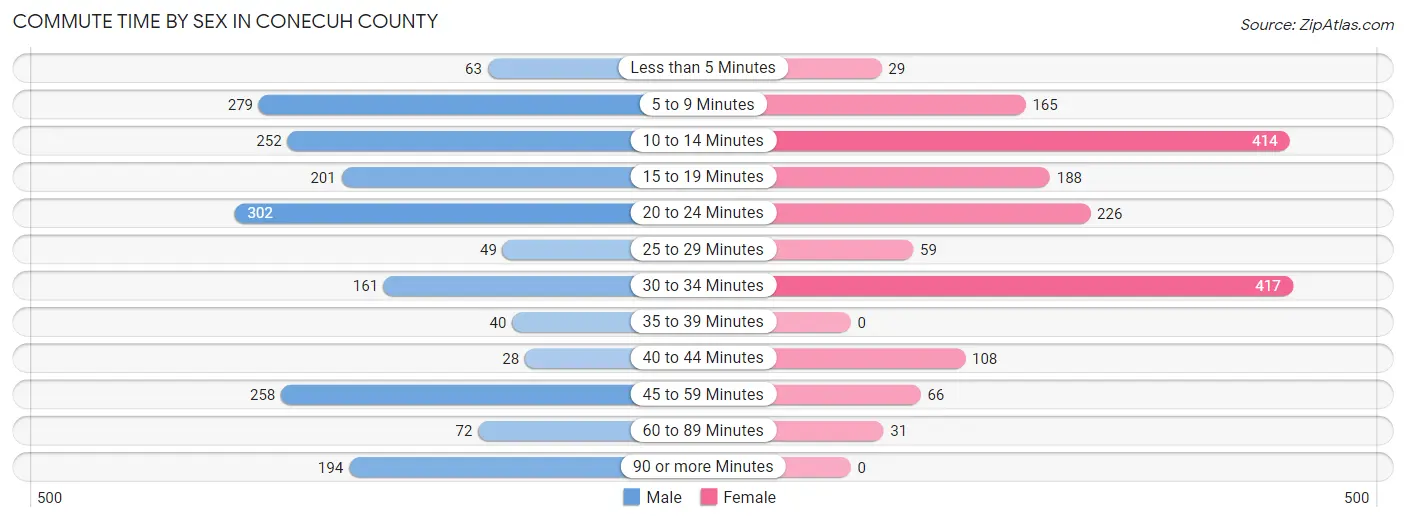
| Commute Time | Male | Female |
| Less than 5 Minutes | 63 (3.3%) | 29 (1.7%) |
| 5 to 9 Minutes | 279 (14.7%) | 165 (9.7%) |
| 10 to 14 Minutes | 252 (13.3%) | 414 (24.3%) |
| 15 to 19 Minutes | 201 (10.6%) | 188 (11.0%) |
| 20 to 24 Minutes | 302 (15.9%) | 226 (13.3%) |
| 25 to 29 Minutes | 49 (2.6%) | 59 (3.5%) |
| 30 to 34 Minutes | 161 (8.5%) | 417 (24.5%) |
| 35 to 39 Minutes | 40 (2.1%) | 0 (0.0%) |
| 40 to 44 Minutes | 28 (1.5%) | 108 (6.3%) |
| 45 to 59 Minutes | 258 (13.6%) | 66 (3.9%) |
| 60 to 89 Minutes | 72 (3.8%) | 31 (1.8%) |
| 90 or more Minutes | 194 (10.2%) | 0 (0.0%) |
Time of Departure to Work by Sex in Conecuh County
The most frequent times of departure to work in Conecuh County are 7:00 AM to 7:29 AM (490, 25.8%) for males and 7:00 AM to 7:29 AM (426, 25.0%) for females.
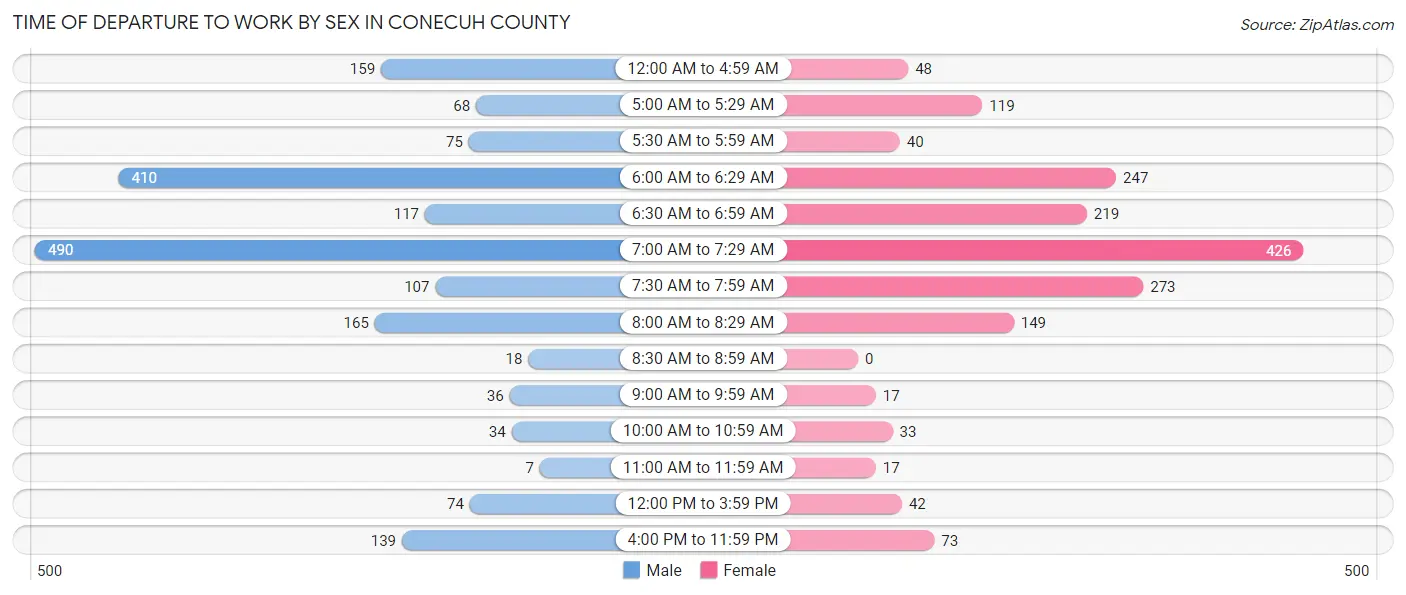
| Time of Departure | Male | Female |
| 12:00 AM to 4:59 AM | 159 (8.4%) | 48 (2.8%) |
| 5:00 AM to 5:29 AM | 68 (3.6%) | 119 (7.0%) |
| 5:30 AM to 5:59 AM | 75 (4.0%) | 40 (2.4%) |
| 6:00 AM to 6:29 AM | 410 (21.6%) | 247 (14.5%) |
| 6:30 AM to 6:59 AM | 117 (6.2%) | 219 (12.9%) |
| 7:00 AM to 7:29 AM | 490 (25.8%) | 426 (25.0%) |
| 7:30 AM to 7:59 AM | 107 (5.6%) | 273 (16.0%) |
| 8:00 AM to 8:29 AM | 165 (8.7%) | 149 (8.7%) |
| 8:30 AM to 8:59 AM | 18 (0.9%) | 0 (0.0%) |
| 9:00 AM to 9:59 AM | 36 (1.9%) | 17 (1.0%) |
| 10:00 AM to 10:59 AM | 34 (1.8%) | 33 (1.9%) |
| 11:00 AM to 11:59 AM | 7 (0.4%) | 17 (1.0%) |
| 12:00 PM to 3:59 PM | 74 (3.9%) | 42 (2.5%) |
| 4:00 PM to 11:59 PM | 139 (7.3%) | 73 (4.3%) |
| Total | 1,899 (100.0%) | 1,703 (100.0%) |
Housing Occupancy in Conecuh County
Occupancy by Ownership in Conecuh County
Of the total 4,453 dwellings in Conecuh County, owner-occupied units account for 3,326 (74.7%), while renter-occupied units make up 1,127 (25.3%).
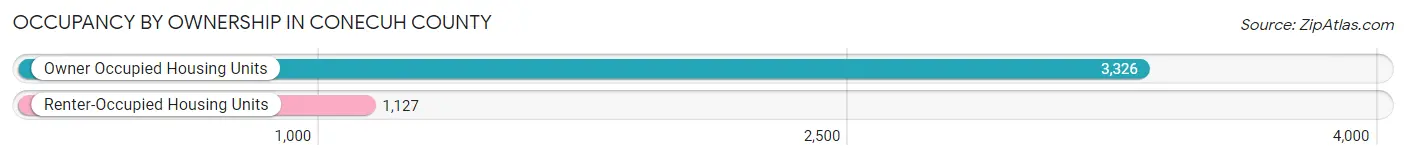
| Occupancy | # Housing Units | % Housing Units |
| Owner Occupied Housing Units | 3,326 | 74.7% |
| Renter-Occupied Housing Units | 1,127 | 25.3% |
| Total Occupied Housing Units | 4,453 | 100.0% |
Occupancy by Household Size in Conecuh County
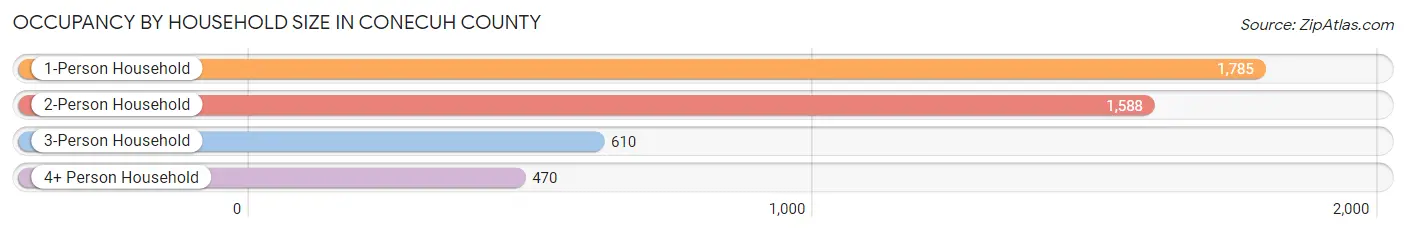
| Household Size | # Housing Units | % Housing Units |
| 1-Person Household | 1,785 | 40.1% |
| 2-Person Household | 1,588 | 35.7% |
| 3-Person Household | 610 | 13.7% |
| 4+ Person Household | 470 | 10.5% |
| Total Housing Units | 4,453 | 100.0% |
Occupancy by Ownership by Household Size in Conecuh County
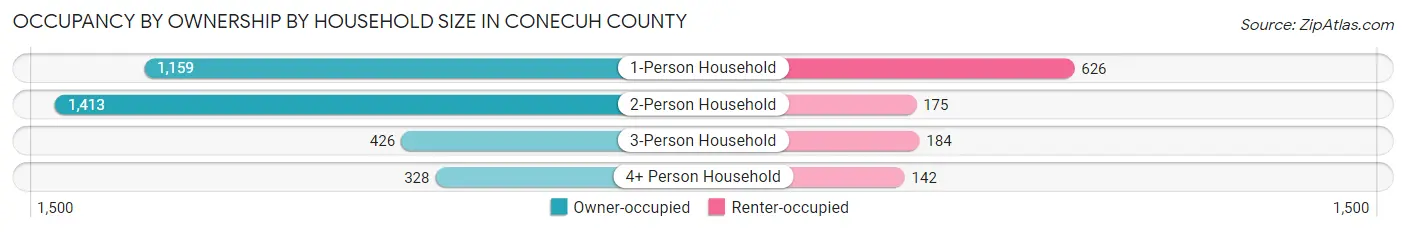
| Household Size | Owner-occupied | Renter-occupied |
| 1-Person Household | 1,159 (64.9%) | 626 (35.1%) |
| 2-Person Household | 1,413 (89.0%) | 175 (11.0%) |
| 3-Person Household | 426 (69.8%) | 184 (30.2%) |
| 4+ Person Household | 328 (69.8%) | 142 (30.2%) |
| Total Housing Units | 3,326 (74.7%) | 1,127 (25.3%) |
Occupancy by Educational Attainment in Conecuh County
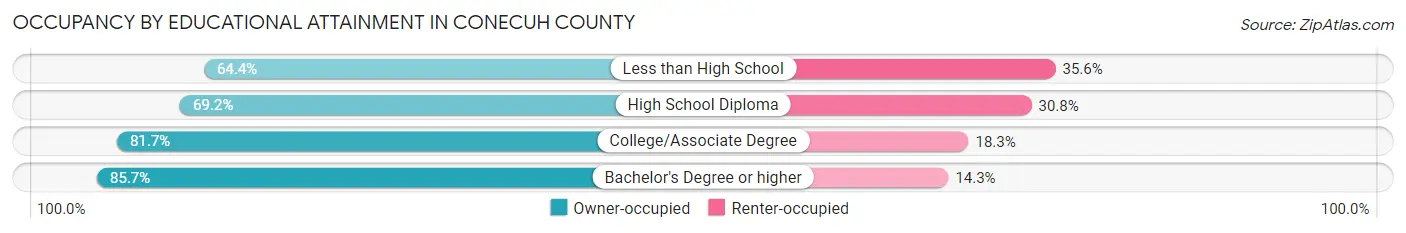
| Household Size | Owner-occupied | Renter-occupied |
| Less than High School | 290 (64.4%) | 160 (35.6%) |
| High School Diploma | 1,428 (69.2%) | 636 (30.8%) |
| College/Associate Degree | 1,088 (81.7%) | 244 (18.3%) |
| Bachelor's Degree or higher | 520 (85.7%) | 87 (14.3%) |
Occupancy by Age of Householder in Conecuh County
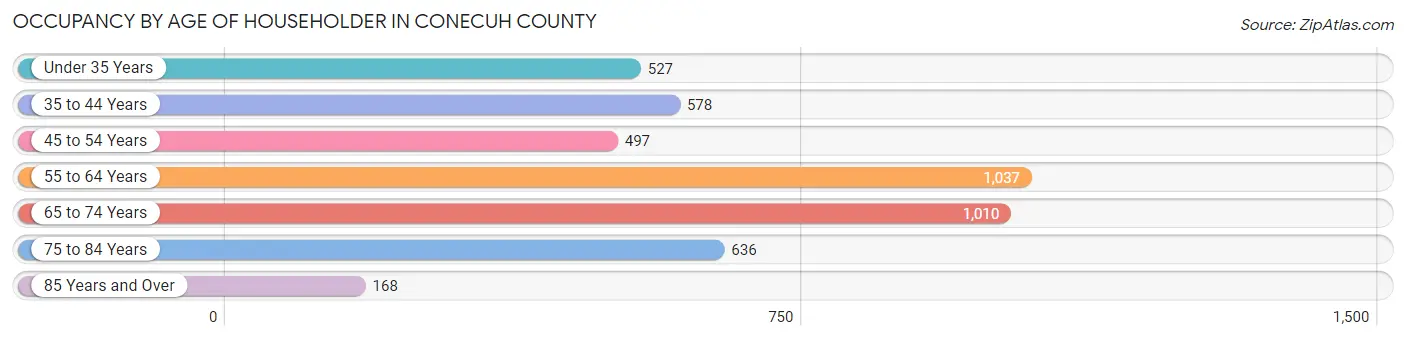
| Age Bracket | # Households | % Households |
| Under 35 Years | 527 | 11.8% |
| 35 to 44 Years | 578 | 13.0% |
| 45 to 54 Years | 497 | 11.2% |
| 55 to 64 Years | 1,037 | 23.3% |
| 65 to 74 Years | 1,010 | 22.7% |
| 75 to 84 Years | 636 | 14.3% |
| 85 Years and Over | 168 | 3.8% |
| Total | 4,453 | 100.0% |
Housing Finances in Conecuh County
Median Income by Occupancy in Conecuh County
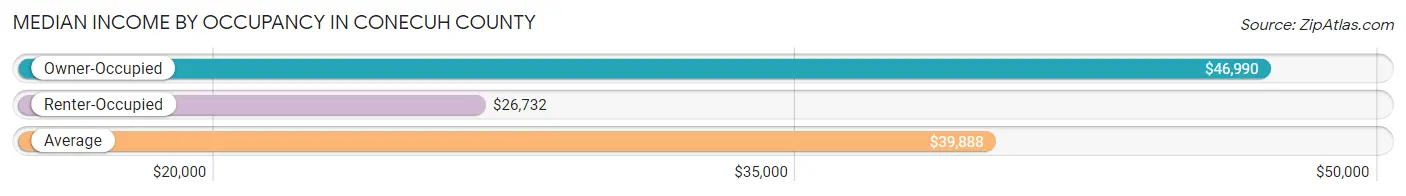
| Occupancy Type | # Households | Median Income |
| Owner-Occupied | 3,326 (74.7%) | $46,990 |
| Renter-Occupied | 1,127 (25.3%) | $26,732 |
| Average | 4,453 (100.0%) | $39,888 |
Occupancy by Householder Income Bracket in Conecuh County
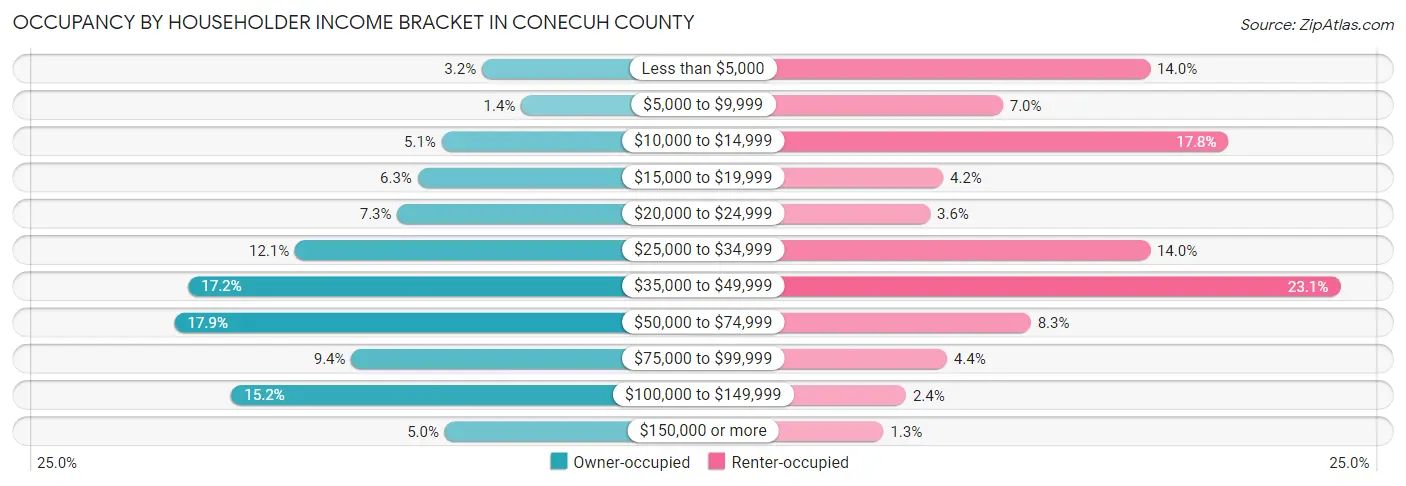
| Income Bracket | Owner-occupied | Renter-occupied |
| Less than $5,000 | 107 (3.2%) | 158 (14.0%) |
| $5,000 to $9,999 | 45 (1.3%) | 79 (7.0%) |
| $10,000 to $14,999 | 171 (5.1%) | 200 (17.7%) |
| $15,000 to $19,999 | 209 (6.3%) | 47 (4.2%) |
| $20,000 to $24,999 | 241 (7.2%) | 40 (3.5%) |
| $25,000 to $34,999 | 403 (12.1%) | 158 (14.0%) |
| $35,000 to $49,999 | 572 (17.2%) | 260 (23.1%) |
| $50,000 to $74,999 | 594 (17.9%) | 94 (8.3%) |
| $75,000 to $99,999 | 314 (9.4%) | 49 (4.3%) |
| $100,000 to $149,999 | 504 (15.1%) | 27 (2.4%) |
| $150,000 or more | 166 (5.0%) | 15 (1.3%) |
| Total | 3,326 (100.0%) | 1,127 (100.0%) |
Monthly Housing Cost Tiers in Conecuh County
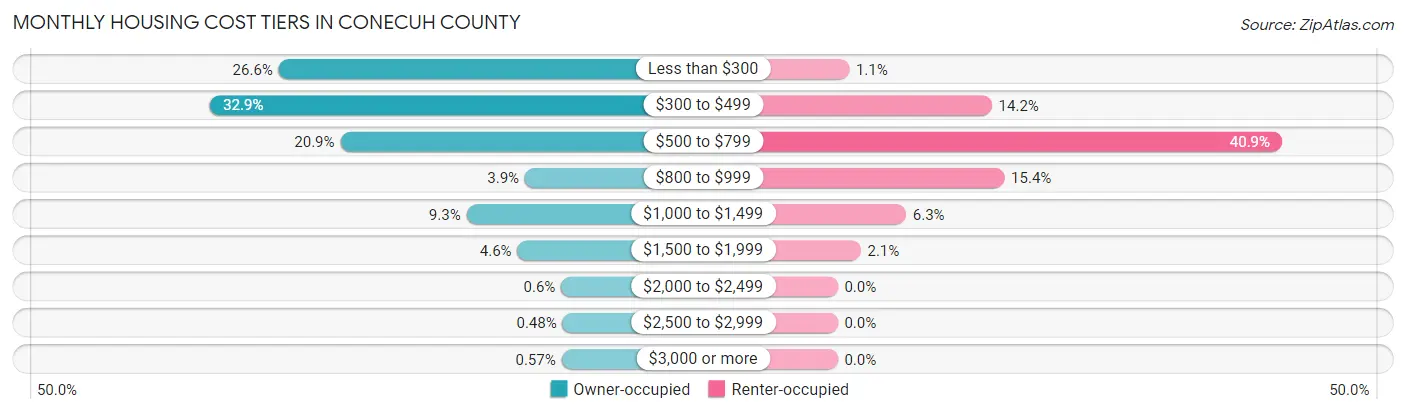
| Monthly Cost | Owner-occupied | Renter-occupied |
| Less than $300 | 885 (26.6%) | 12 (1.1%) |
| $300 to $499 | 1,095 (32.9%) | 160 (14.2%) |
| $500 to $799 | 696 (20.9%) | 461 (40.9%) |
| $800 to $999 | 131 (3.9%) | 173 (15.3%) |
| $1,000 to $1,499 | 310 (9.3%) | 71 (6.3%) |
| $1,500 to $1,999 | 154 (4.6%) | 24 (2.1%) |
| $2,000 to $2,499 | 20 (0.6%) | 0 (0.0%) |
| $2,500 to $2,999 | 16 (0.5%) | 0 (0.0%) |
| $3,000 or more | 19 (0.6%) | 0 (0.0%) |
| Total | 3,326 (100.0%) | 1,127 (100.0%) |
Physical Housing Characteristics in Conecuh County
Housing Structures in Conecuh County
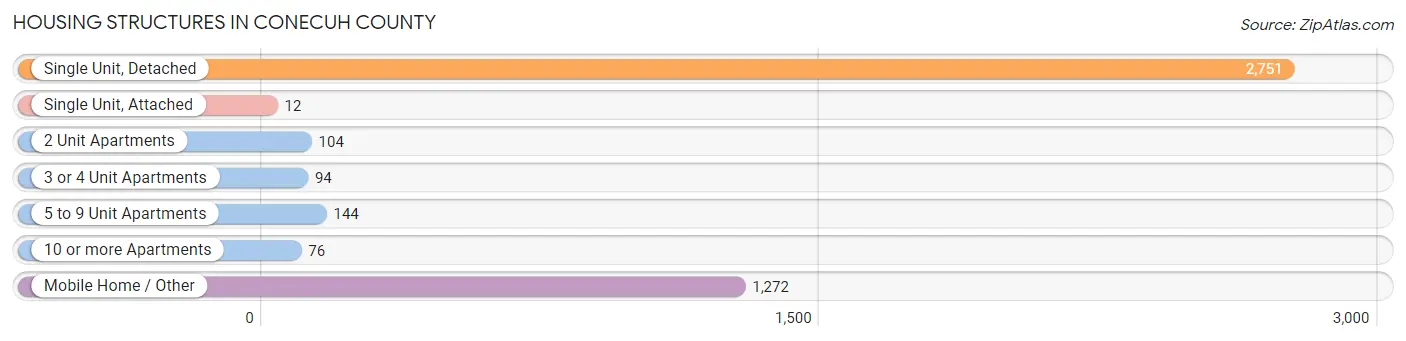
| Structure Type | # Housing Units | % Housing Units |
| Single Unit, Detached | 2,751 | 61.8% |
| Single Unit, Attached | 12 | 0.3% |
| 2 Unit Apartments | 104 | 2.3% |
| 3 or 4 Unit Apartments | 94 | 2.1% |
| 5 to 9 Unit Apartments | 144 | 3.2% |
| 10 or more Apartments | 76 | 1.7% |
| Mobile Home / Other | 1,272 | 28.6% |
| Total | 4,453 | 100.0% |
Housing Structures by Occupancy in Conecuh County
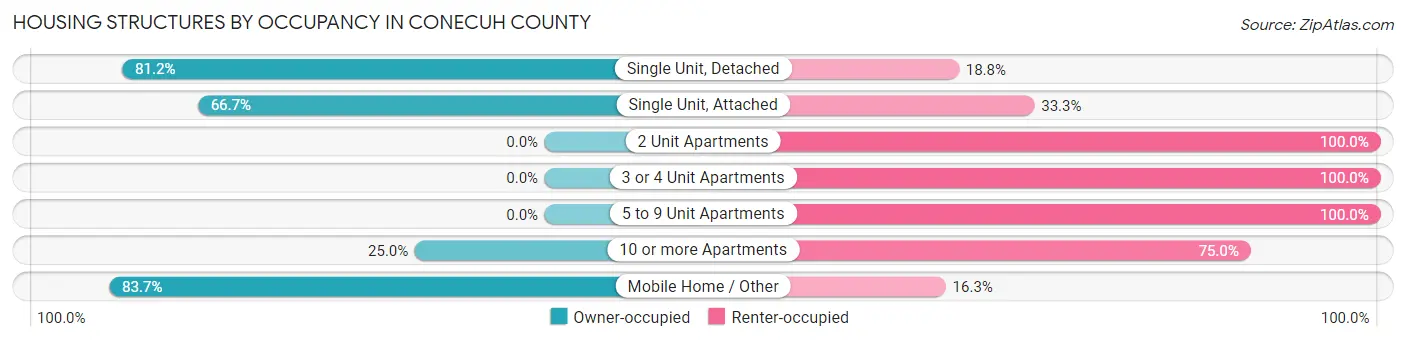
| Structure Type | Owner-occupied | Renter-occupied |
| Single Unit, Detached | 2,234 (81.2%) | 517 (18.8%) |
| Single Unit, Attached | 8 (66.7%) | 4 (33.3%) |
| 2 Unit Apartments | 0 (0.0%) | 104 (100.0%) |
| 3 or 4 Unit Apartments | 0 (0.0%) | 94 (100.0%) |
| 5 to 9 Unit Apartments | 0 (0.0%) | 144 (100.0%) |
| 10 or more Apartments | 19 (25.0%) | 57 (75.0%) |
| Mobile Home / Other | 1,065 (83.7%) | 207 (16.3%) |
| Total | 3,326 (74.7%) | 1,127 (25.3%) |
Housing Structures by Number of Rooms in Conecuh County
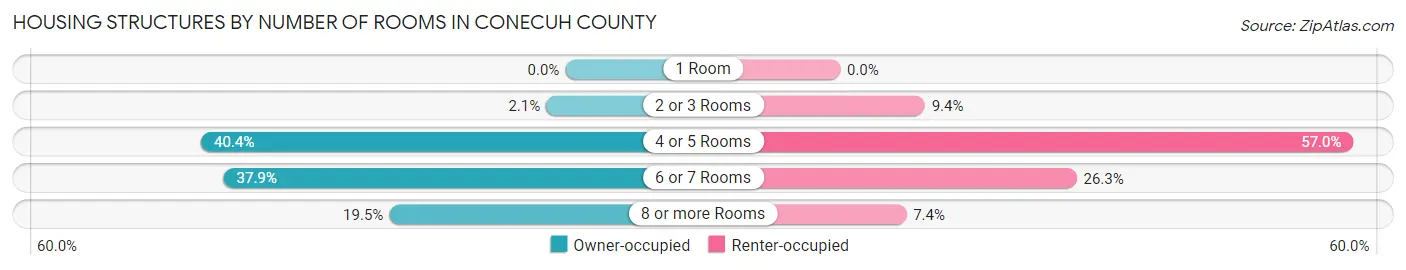
| Number of Rooms | Owner-occupied | Renter-occupied |
| 1 Room | 0 (0.0%) | 0 (0.0%) |
| 2 or 3 Rooms | 71 (2.1%) | 106 (9.4%) |
| 4 or 5 Rooms | 1,344 (40.4%) | 642 (57.0%) |
| 6 or 7 Rooms | 1,261 (37.9%) | 296 (26.3%) |
| 8 or more Rooms | 650 (19.5%) | 83 (7.4%) |
| Total | 3,326 (100.0%) | 1,127 (100.0%) |
Housing Structure by Heating Type in Conecuh County
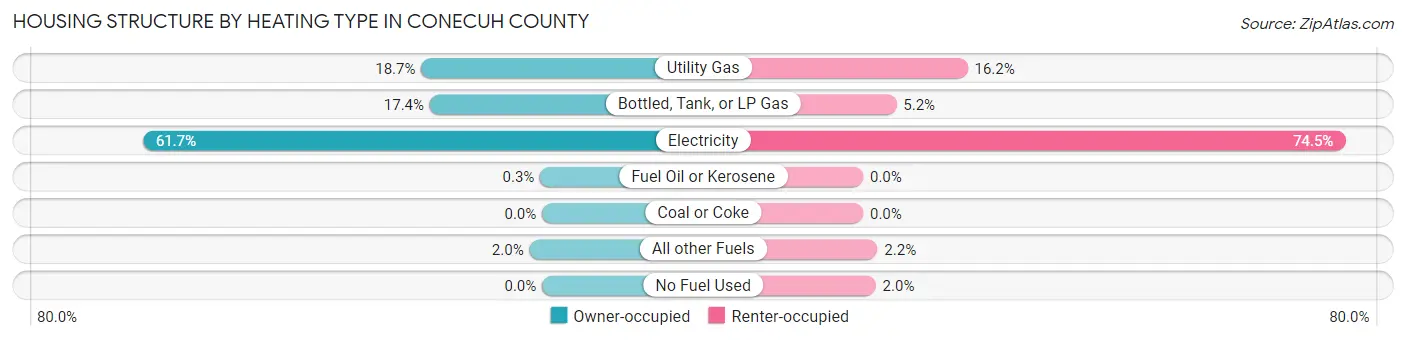
| Heating Type | Owner-occupied | Renter-occupied |
| Utility Gas | 621 (18.7%) | 182 (16.2%) |
| Bottled, Tank, or LP Gas | 577 (17.3%) | 58 (5.1%) |
| Electricity | 2,053 (61.7%) | 840 (74.5%) |
| Fuel Oil or Kerosene | 10 (0.3%) | 0 (0.0%) |
| Coal or Coke | 0 (0.0%) | 0 (0.0%) |
| All other Fuels | 65 (1.9%) | 25 (2.2%) |
| No Fuel Used | 0 (0.0%) | 22 (1.9%) |
| Total | 3,326 (100.0%) | 1,127 (100.0%) |
Household Vehicle Usage in Conecuh County
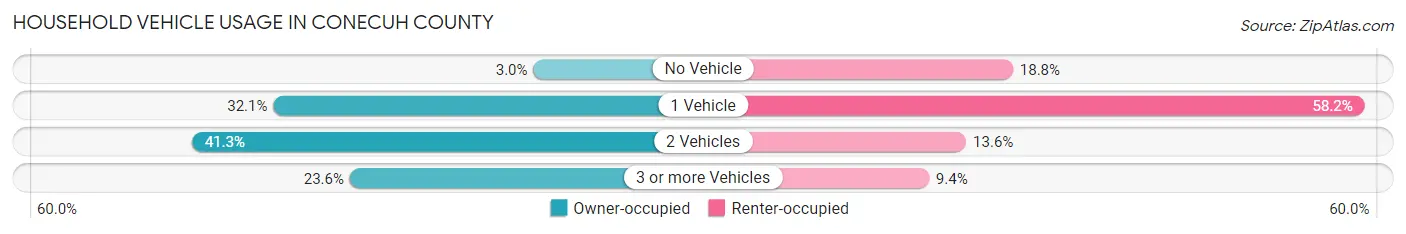
| Vehicles per Household | Owner-occupied | Renter-occupied |
| No Vehicle | 100 (3.0%) | 212 (18.8%) |
| 1 Vehicle | 1,069 (32.1%) | 656 (58.2%) |
| 2 Vehicles | 1,373 (41.3%) | 153 (13.6%) |
| 3 or more Vehicles | 784 (23.6%) | 106 (9.4%) |
| Total | 3,326 (100.0%) | 1,127 (100.0%) |
Real Estate & Mortgages in Conecuh County
Real Estate and Mortgage Overview in Conecuh County
| Characteristic | Without Mortgage | With Mortgage |
| Housing Units | 2,426 | 900 |
| Median Property Value | $87,900 | $132,000 |
| Median Household Income | $44,886 | $112 |
| Monthly Housing Costs | $360 | $19 |
| Real Estate Taxes | $255 | $133 |
Property Value by Mortgage Status in Conecuh County
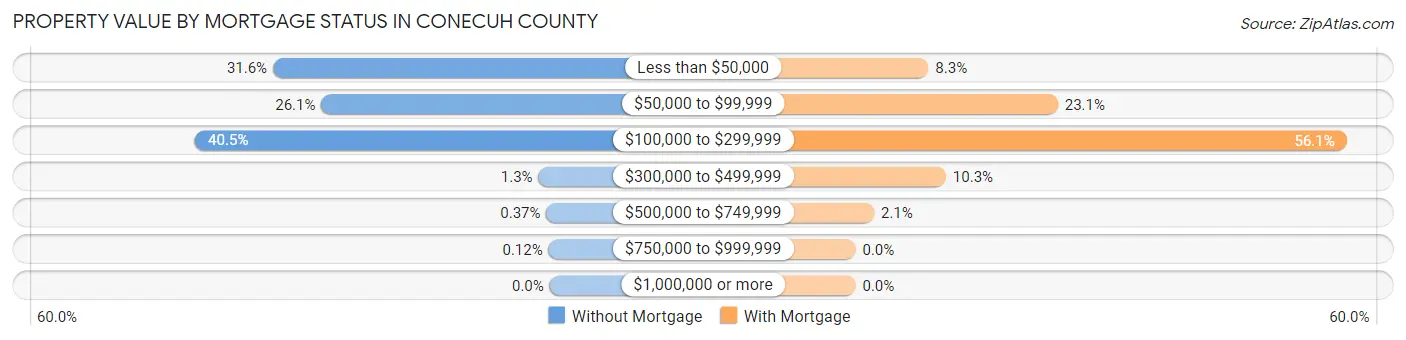
| Property Value | Without Mortgage | With Mortgage |
| Less than $50,000 | 767 (31.6%) | 75 (8.3%) |
| $50,000 to $99,999 | 633 (26.1%) | 208 (23.1%) |
| $100,000 to $299,999 | 983 (40.5%) | 505 (56.1%) |
| $300,000 to $499,999 | 31 (1.3%) | 93 (10.3%) |
| $500,000 to $749,999 | 9 (0.4%) | 19 (2.1%) |
| $750,000 to $999,999 | 3 (0.1%) | 0 (0.0%) |
| $1,000,000 or more | 0 (0.0%) | 0 (0.0%) |
| Total | 2,426 (100.0%) | 900 (100.0%) |
Household Income by Mortgage Status in Conecuh County
| Household Income | Without Mortgage | With Mortgage |
| Less than $10,000 | 125 (5.1%) | 12 (1.3%) |
| $10,000 to $24,999 | 488 (20.1%) | 27 (3.0%) |
| $25,000 to $34,999 | 335 (13.8%) | 133 (14.8%) |
| $35,000 to $49,999 | 399 (16.5%) | 68 (7.6%) |
| $50,000 to $74,999 | 481 (19.8%) | 173 (19.2%) |
| $75,000 to $99,999 | 263 (10.8%) | 113 (12.6%) |
| $100,000 to $149,999 | 281 (11.6%) | 51 (5.7%) |
| $150,000 or more | 54 (2.2%) | 223 (24.8%) |
| Total | 2,426 (100.0%) | 900 (100.0%) |
Property Value to Household Income Ratio in Conecuh County
| Value-to-Income Ratio | Without Mortgage | With Mortgage |
| Less than 2.0x | 1,299 (53.5%) | 64,375 (7,152.8%) |
| 2.0x to 2.9x | 334 (13.8%) | 457 (50.8%) |
| 3.0x to 3.9x | 139 (5.7%) | 112 (12.4%) |
| 4.0x or more | 573 (23.6%) | 82 (9.1%) |
| Total | 2,426 (100.0%) | 900 (100.0%) |
Real Estate Taxes by Mortgage Status in Conecuh County
| Property Taxes | Without Mortgage | With Mortgage |
| Less than $800 | 1,554 (64.1%) | 1 (0.1%) |
| $800 to $1,499 | 112 (4.6%) | 658 (73.1%) |
| $800 to $1,499 | 6 (0.3%) | 109 (12.1%) |
| Total | 2,426 (100.0%) | 900 (100.0%) |
Health & Disability in Conecuh County
Health Insurance Coverage by Age in Conecuh County
| Age Bracket | With Coverage | Without Coverage |
| Under 6 Years | 596 (96.1%) | 24 (3.9%) |
| 6 to 18 Years | 1,798 (95.8%) | 78 (4.2%) |
| 19 to 25 Years | 641 (73.9%) | 227 (26.2%) |
| 26 to 34 Years | 1,114 (87.4%) | 160 (12.6%) |
| 35 to 44 Years | 952 (90.6%) | 99 (9.4%) |
| 45 to 54 Years | 1,174 (86.1%) | 189 (13.9%) |
| 55 to 64 Years | 1,544 (88.0%) | 211 (12.0%) |
| 65 to 74 Years | 1,522 (100.0%) | 0 (0.0%) |
| 75 Years and older | 1,189 (100.0%) | 0 (0.0%) |
| Total | 10,530 (91.4%) | 988 (8.6%) |
Health Insurance Coverage by Citizenship Status in Conecuh County
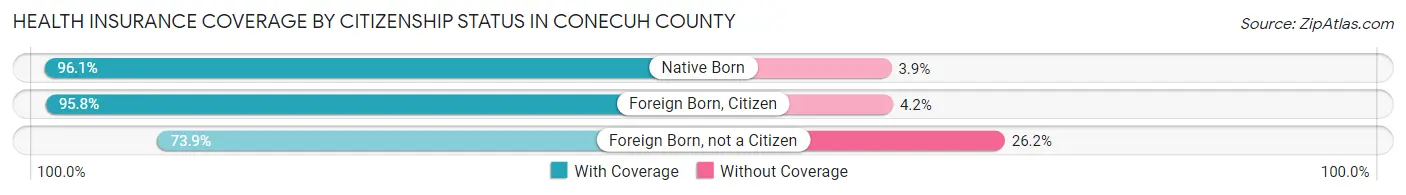
| Citizenship Status | With Coverage | Without Coverage |
| Native Born | 596 (96.1%) | 24 (3.9%) |
| Foreign Born, Citizen | 1,798 (95.8%) | 78 (4.2%) |
| Foreign Born, not a Citizen | 641 (73.9%) | 227 (26.2%) |
Health Insurance Coverage by Household Income in Conecuh County
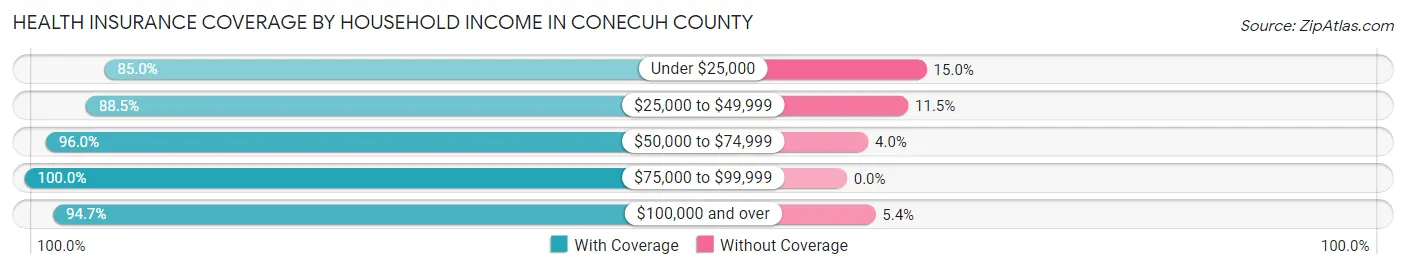
| Household Income | With Coverage | Without Coverage |
| Under $25,000 | 2,246 (85.0%) | 395 (15.0%) |
| $25,000 to $49,999 | 3,004 (88.5%) | 390 (11.5%) |
| $50,000 to $74,999 | 2,192 (96.0%) | 91 (4.0%) |
| $75,000 to $99,999 | 1,106 (100.0%) | 0 (0.0%) |
| $100,000 and over | 1,982 (94.7%) | 112 (5.3%) |
Public vs Private Health Insurance Coverage by Age in Conecuh County
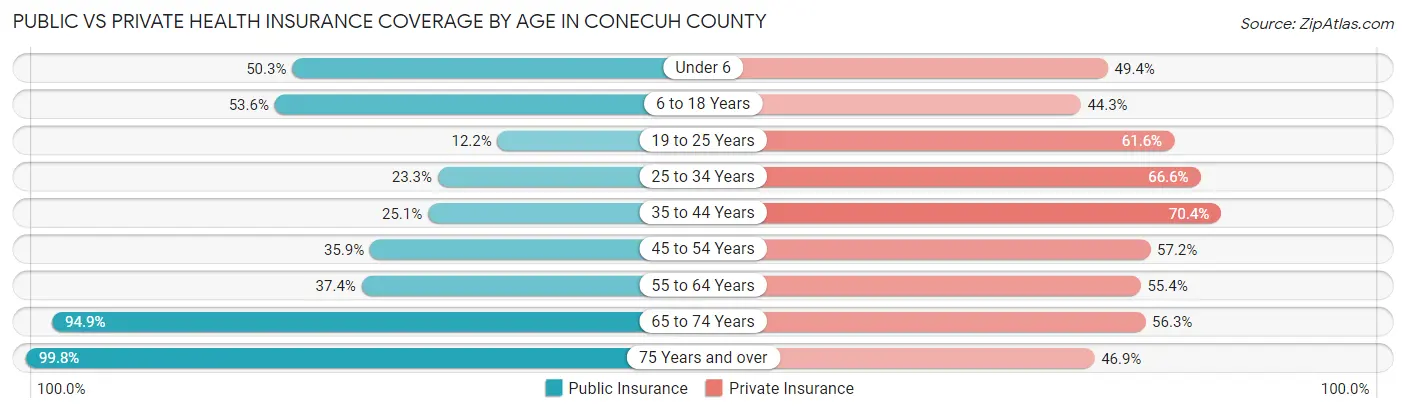
| Age Bracket | Public Insurance | Private Insurance |
| Under 6 | 312 (50.3%) | 306 (49.3%) |
| 6 to 18 Years | 1,005 (53.6%) | 831 (44.3%) |
| 19 to 25 Years | 106 (12.2%) | 535 (61.6%) |
| 25 to 34 Years | 297 (23.3%) | 848 (66.6%) |
| 35 to 44 Years | 264 (25.1%) | 740 (70.4%) |
| 45 to 54 Years | 489 (35.9%) | 780 (57.2%) |
| 55 to 64 Years | 657 (37.4%) | 973 (55.4%) |
| 65 to 74 Years | 1,444 (94.9%) | 857 (56.3%) |
| 75 Years and over | 1,186 (99.8%) | 557 (46.9%) |
| Total | 5,760 (50.0%) | 6,427 (55.8%) |
Disability Status by Sex by Age in Conecuh County
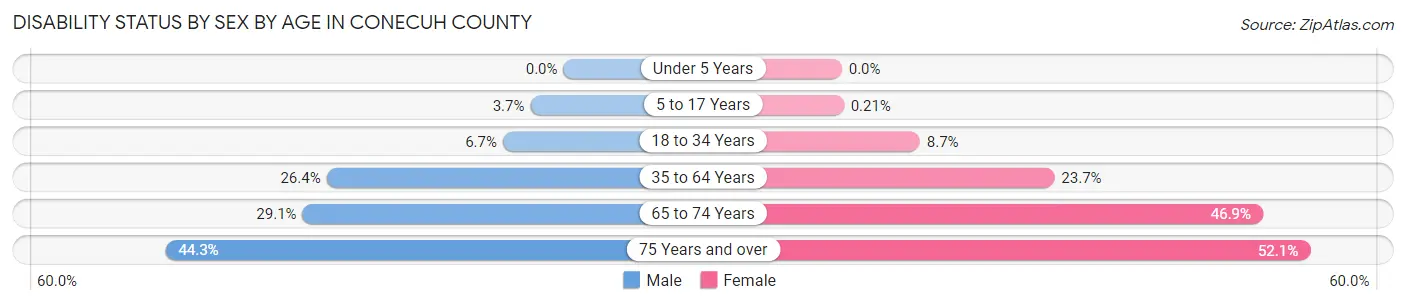
| Age Bracket | Male | Female |
| Under 5 Years | 0 (0.0%) | 0 (0.0%) |
| 5 to 17 Years | 35 (3.7%) | 2 (0.2%) |
| 18 to 34 Years | 84 (6.7%) | 89 (8.7%) |
| 35 to 64 Years | 496 (26.4%) | 542 (23.7%) |
| 65 to 74 Years | 213 (29.1%) | 370 (46.9%) |
| 75 Years and over | 226 (44.3%) | 354 (52.1%) |
Disability Class by Sex by Age in Conecuh County
Disability Class: Hearing Difficulty
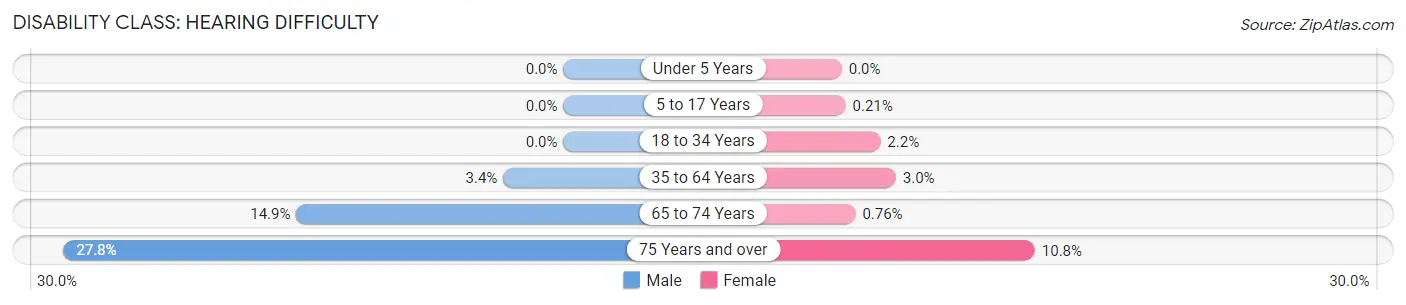
| Age Bracket | Male | Female |
| Under 5 Years | 0 (0.0%) | 0 (0.0%) |
| 5 to 17 Years | 0 (0.0%) | 2 (0.2%) |
| 18 to 34 Years | 0 (0.0%) | 22 (2.1%) |
| 35 to 64 Years | 63 (3.4%) | 69 (3.0%) |
| 65 to 74 Years | 109 (14.9%) | 6 (0.8%) |
| 75 Years and over | 142 (27.8%) | 73 (10.7%) |
Disability Class: Vision Difficulty
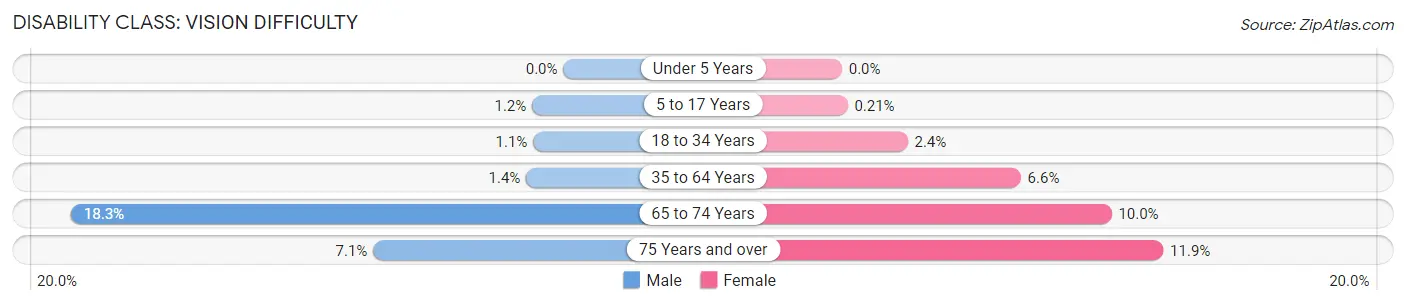
| Age Bracket | Male | Female |
| Under 5 Years | 0 (0.0%) | 0 (0.0%) |
| 5 to 17 Years | 11 (1.2%) | 2 (0.2%) |
| 18 to 34 Years | 14 (1.1%) | 25 (2.4%) |
| 35 to 64 Years | 26 (1.4%) | 152 (6.6%) |
| 65 to 74 Years | 134 (18.3%) | 79 (10.0%) |
| 75 Years and over | 36 (7.1%) | 81 (11.9%) |
Disability Class: Cognitive Difficulty
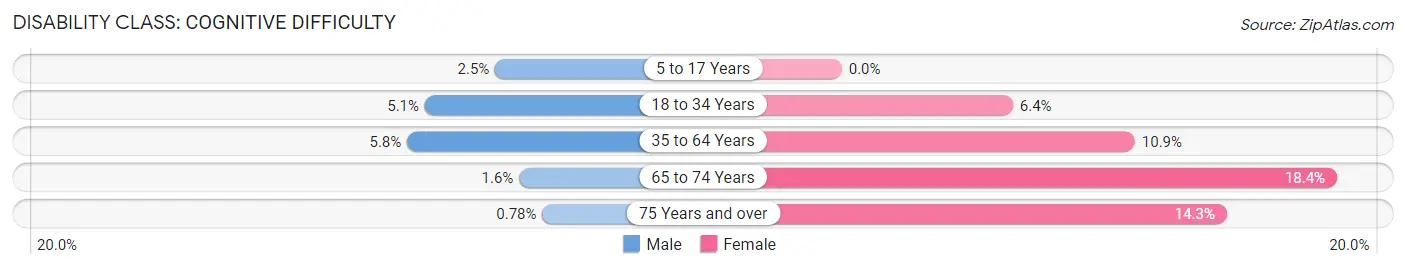
| Age Bracket | Male | Female |
| 5 to 17 Years | 24 (2.5%) | 0 (0.0%) |
| 18 to 34 Years | 64 (5.1%) | 65 (6.4%) |
| 35 to 64 Years | 109 (5.8%) | 249 (10.9%) |
| 65 to 74 Years | 12 (1.6%) | 145 (18.4%) |
| 75 Years and over | 4 (0.8%) | 97 (14.3%) |
Disability Class: Ambulatory Difficulty
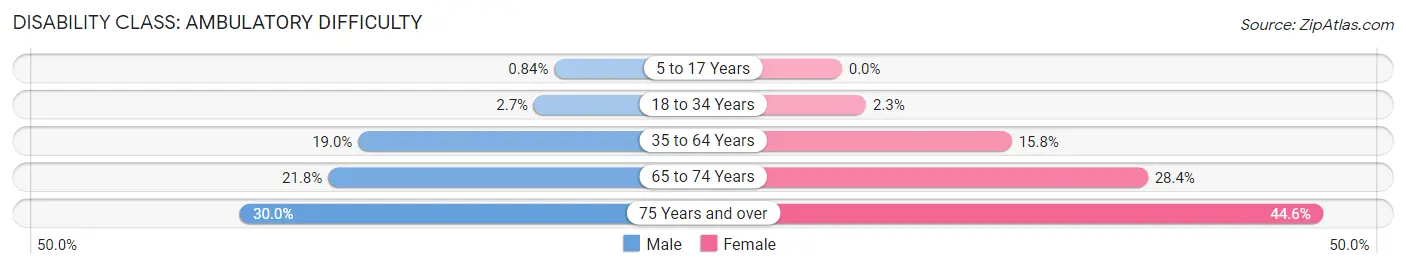
| Age Bracket | Male | Female |
| 5 to 17 Years | 8 (0.8%) | 0 (0.0%) |
| 18 to 34 Years | 34 (2.7%) | 23 (2.2%) |
| 35 to 64 Years | 358 (19.0%) | 361 (15.8%) |
| 65 to 74 Years | 160 (21.8%) | 224 (28.4%) |
| 75 Years and over | 153 (30.0%) | 303 (44.6%) |
Disability Class: Self-Care Difficulty
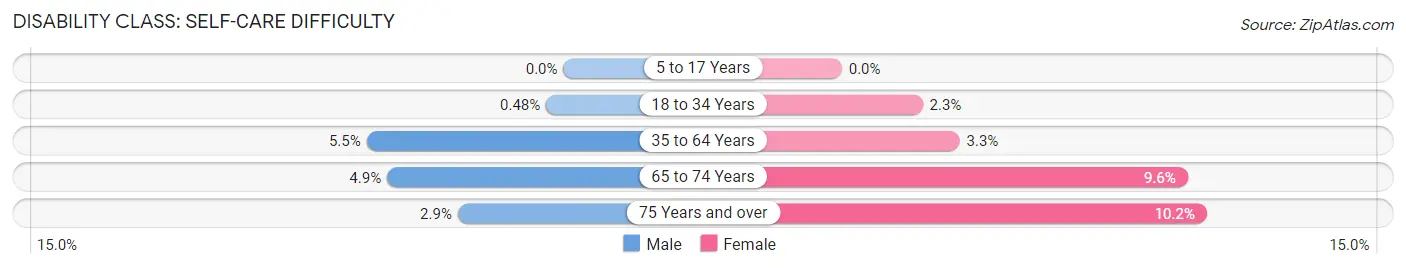
| Age Bracket | Male | Female |
| 5 to 17 Years | 0 (0.0%) | 0 (0.0%) |
| 18 to 34 Years | 6 (0.5%) | 23 (2.2%) |
| 35 to 64 Years | 103 (5.5%) | 75 (3.3%) |
| 65 to 74 Years | 36 (4.9%) | 76 (9.6%) |
| 75 Years and over | 15 (2.9%) | 69 (10.2%) |
Technology Access in Conecuh County
Computing Device Access in Conecuh County
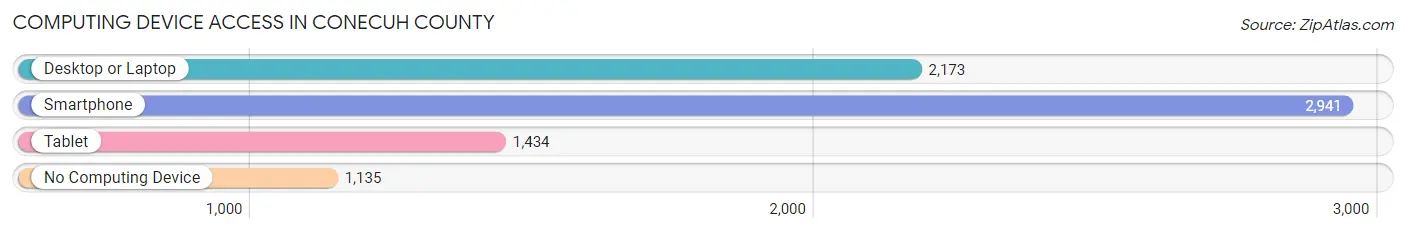
| Device Type | # Households | % Households |
| Desktop or Laptop | 2,173 | 48.8% |
| Smartphone | 2,941 | 66.0% |
| Tablet | 1,434 | 32.2% |
| No Computing Device | 1,135 | 25.5% |
| Total | 4,453 | 100.0% |
Internet Access in Conecuh County
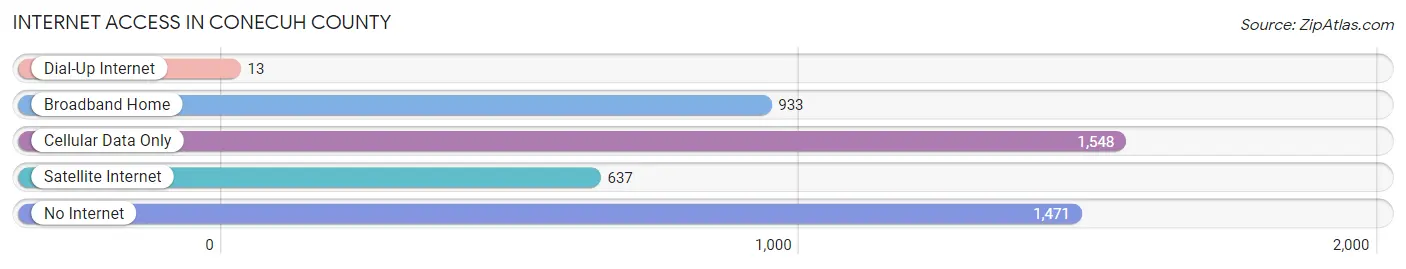
| Internet Type | # Households | % Households |
| Dial-Up Internet | 13 | 0.3% |
| Broadband Home | 933 | 20.9% |
| Cellular Data Only | 1,548 | 34.8% |
| Satellite Internet | 637 | 14.3% |
| No Internet | 1,471 | 33.0% |
| Total | 4,453 | 100.0% |
Conecuh County Summary
Conecuh County is located in the southeastern corner of Alabama, and is part of the Mobile metropolitan area. It is bordered by Escambia County, Florida to the south, Monroe County to the east, and Covington and Escambia Counties to the west. The county seat is Evergreen.
History
Conecuh County was established in 1818 from parts of Monroe and Escambia Counties. It was named for the Conecuh River, which flows through the county. The county was originally part of the Creek Nation, and was ceded to the United States in the Treaty of Fort Jackson in 1814.
The county was largely rural until the late 19th century, when the lumber industry began to develop. The county was home to several large sawmills, and the timber industry was a major source of employment for many years.
In the early 20th century, the county began to develop a more diversified economy. The county was home to several large farms, and the agricultural industry was a major source of employment. The county also had several small manufacturing plants, and the manufacturing industry was a major source of employment.
Geography
Conecuh County is located in the southeastern corner of Alabama, and is part of the Mobile metropolitan area. It is bordered by Escambia County, Florida to the south, Monroe County to the east, and Covington and Escambia Counties to the west. The county has a total area of 845 square miles, of which 843 square miles is land and 2 square miles is water.
The county is mostly flat, with some rolling hills in the northern part of the county. The Conecuh River flows through the county, and there are several small lakes and ponds. The county is mostly covered in pine and hardwood forests.
Economy
Conecuh County has a diversified economy. The county is home to several large farms, and the agricultural industry is a major source of employment. The county also has several small manufacturing plants, and the manufacturing industry is a major source of employment.
The county is also home to several large sawmills, and the timber industry is a major source of employment. The county is also home to several large retail stores, and the retail industry is a major source of employment.
Demographics
As of the 2010 census, Conecuh County had a population of 13,228. The racial makeup of the county was 73.3% White, 24.2% Black or African American, 0.3% Native American, 0.2% Asian, 0.1% Pacific Islander, 0.7% from other races, and 1.3% from two or more races. 1.7% of the population were Hispanic or Latino of any race.
The median income for a household in the county was $30,945, and the median income for a family was $37,917. The per capita income for the county was $15,945. About 19.3% of the population were below the poverty line.
Common Questions
What is Per Capita Income in Conecuh County?
Per Capita income in Conecuh County is $24,426.
What is the Median Family Income in Conecuh County?
Median Family Income in Conecuh County is $55,380.
What is the Median Household income in Conecuh County?
Median Household Income in Conecuh County is $39,888.
What is Income or Wage Gap in Conecuh County?
Income or Wage Gap in Conecuh County is 37.5%.
Women in Conecuh County earn 62.5 cents for every dollar earned by a man.
What is Family Income Deficit in Conecuh County?
Family Income Deficit in Conecuh County is $12,882.
Families that are below poverty line in Conecuh County earn $12,882 less on average than the poverty threshold level.
What is Inequality or Gini Index in Conecuh County?
Inequality or Gini Index in Conecuh County is 0.46.
What is the Total Population of Conecuh County?
Total Population of Conecuh County is 11,576.
What is the Total Male Population of Conecuh County?
Total Male Population of Conecuh County is 5,639.
What is the Total Female Population of Conecuh County?
Total Female Population of Conecuh County is 5,937.
What is the Ratio of Males per 100 Females in Conecuh County?
There are 94.98 Males per 100 Females in Conecuh County.
What is the Ratio of Females per 100 Males in Conecuh County?
There are 105.28 Females per 100 Males in Conecuh County.
What is the Median Population Age in Conecuh County?
Median Population Age in Conecuh County is 46.2 Years.
What is the Average Family Size in Conecuh County
Average Family Size in Conecuh County is 3.6 People.
What is the Average Household Size in Conecuh County
Average Household Size in Conecuh County is 2.6 People.
How Large is the Labor Force in Conecuh County?
There are 3,932 People in the Labor Forcein in Conecuh County.
What is the Percentage of People in the Labor Force in Conecuh County?
41.1% of People are in the Labor Force in Conecuh County.
What is the Unemployment Rate in Conecuh County?
Unemployment Rate in Conecuh County is 4.4%.