Immigrants from Zimbabwe 4 or more Vehicles in Household
COMPARE
Immigrants from Zimbabwe
Select to Compare
4 or more Vehicles in Household
Immigrants from Zimbabwe 4 or more Vehicles in Household
6.0%
4+ VEHICLES AVAILABLE
15.1/ 100
METRIC RATING
210th/ 347
METRIC RANK
Immigrants from Zimbabwe 4 or more Vehicles in Household Correlation Chart
The statistical analysis conducted on geographies consisting of 117,555,035 people shows a moderate positive correlation between the proportion of Immigrants from Zimbabwe and percentage of households with 4 or more vehicles available in the United States with a correlation coefficient (R) of 0.465 and weighted average of 6.0%. On average, for every 1% (one percent) increase in Immigrants from Zimbabwe within a typical geography, there is an increase of 1.2% in percentage of households with 4 or more vehicles available.
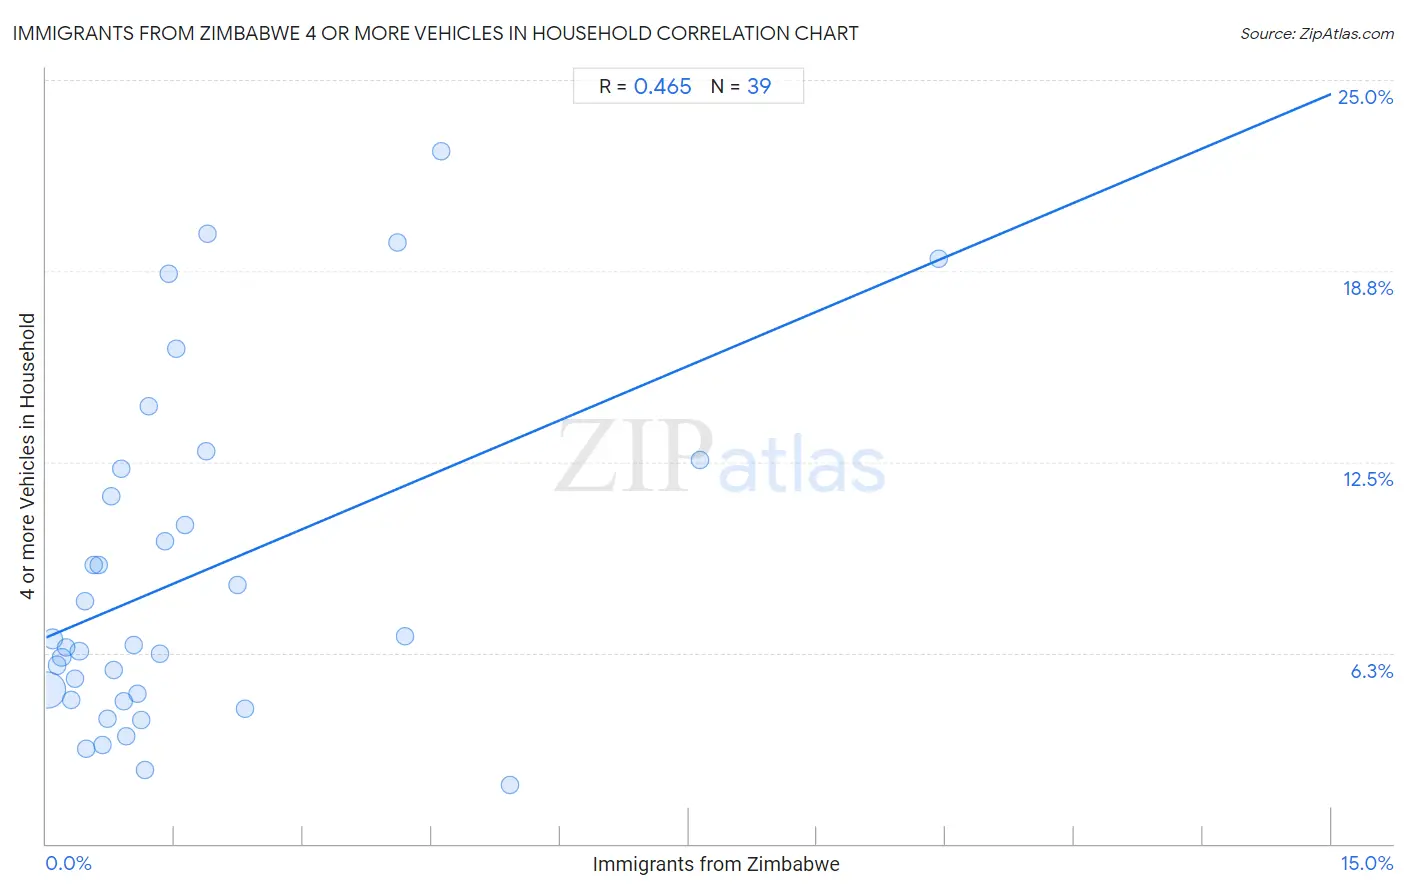
It is essential to understand that the correlation between the percentage of Immigrants from Zimbabwe and percentage of households with 4 or more vehicles available does not imply a direct cause-and-effect relationship. It remains uncertain whether the presence of Immigrants from Zimbabwe influences an upward or downward trend in the level of percentage of households with 4 or more vehicles available within an area, or if Immigrants from Zimbabwe simply ended up residing in those areas with higher or lower levels of percentage of households with 4 or more vehicles available due to other factors.
Demographics Similar to Immigrants from Zimbabwe by 4 or more Vehicles in Household
In terms of 4 or more vehicles in household, the demographic groups most similar to Immigrants from Zimbabwe are Immigrants from Honduras (6.1%, a difference of 0.050%), Panamanian (6.0%, a difference of 0.080%), Immigrants from Nigeria (6.1%, a difference of 0.090%), Immigrants from Egypt (6.0%, a difference of 0.10%), and Arab (6.0%, a difference of 0.15%).
| Demographics | Rating | Rank | 4 or more Vehicles in Household |
| Immigrants from Sierra Leone | 20.5 /100 | #203 | Fair 6.1% |
| Immigrants from Belize | 19.8 /100 | #204 | Poor 6.1% |
| Hondurans | 19.3 /100 | #205 | Poor 6.1% |
| Kenyans | 18.5 /100 | #206 | Poor 6.1% |
| Immigrants from Chile | 16.9 /100 | #207 | Poor 6.1% |
| Immigrants from Nigeria | 15.6 /100 | #208 | Poor 6.1% |
| Immigrants from Honduras | 15.4 /100 | #209 | Poor 6.1% |
| Immigrants from Zimbabwe | 15.1 /100 | #210 | Poor 6.0% |
| Panamanians | 14.8 /100 | #211 | Poor 6.0% |
| Immigrants from Egypt | 14.7 /100 | #212 | Poor 6.0% |
| Arabs | 14.4 /100 | #213 | Poor 6.0% |
| Immigrants from Austria | 14.3 /100 | #214 | Poor 6.0% |
| Immigrants from China | 13.8 /100 | #215 | Poor 6.0% |
| Immigrants from Romania | 13.8 /100 | #216 | Poor 6.0% |
| Nigerians | 12.2 /100 | #217 | Poor 6.0% |
Immigrants from Zimbabwe 4 or more Vehicles in Household Correlation Summary
| Measurement | Immigrants from Zimbabwe Data | 4 or more Vehicles in Household Data |
| Minimum | 0.017% | 1.9% |
| Maximum | 10.4% | 22.7% |
| Range | 10.4% | 20.7% |
| Mean | 1.7% | 8.8% |
| Median | 1.0% | 6.5% |
| Interquartile 25% (IQ1) | 0.47% | 4.7% |
| Interquartile 75% (IQ3) | 1.9% | 12.3% |
| Interquartile Range (IQR) | 1.4% | 7.6% |
| Standard Deviation (Sample) | 2.2% | 5.5% |
| Standard Deviation (Population) | 2.1% | 5.4% |
Correlation Details
| Immigrants from Zimbabwe Percentile | Sample Size | 4 or more Vehicles in Household |
[ 0.0% - 0.5% ] 0.017% | 96,492,335 | 5.0% |
[ 0.0% - 0.5% ] 0.074% | 11,481,414 | 6.7% |
[ 0.0% - 0.5% ] 0.13% | 3,962,043 | 5.8% |
[ 0.0% - 0.5% ] 0.18% | 2,077,262 | 6.1% |
[ 0.0% - 0.5% ] 0.23% | 880,238 | 6.4% |
[ 0.0% - 0.5% ] 0.29% | 650,251 | 4.7% |
[ 0.0% - 0.5% ] 0.33% | 478,711 | 5.4% |
[ 0.0% - 0.5% ] 0.39% | 322,052 | 6.3% |
[ 0.0% - 0.5% ] 0.45% | 353,018 | 7.9% |
[ 0.0% - 0.5% ] 0.47% | 90,163 | 3.1% |
[ 0.5% - 1.0% ] 0.55% | 232,113 | 9.1% |
[ 0.5% - 1.0% ] 0.61% | 74,834 | 9.1% |
[ 0.5% - 1.0% ] 0.66% | 42,362 | 3.2% |
[ 0.5% - 1.0% ] 0.71% | 39,523 | 4.1% |
[ 0.5% - 1.0% ] 0.76% | 76,479 | 11.4% |
[ 0.5% - 1.0% ] 0.79% | 52,753 | 5.7% |
[ 0.5% - 1.0% ] 0.88% | 13,719 | 12.3% |
[ 0.5% - 1.0% ] 0.91% | 55,300 | 4.7% |
[ 0.5% - 1.0% ] 0.94% | 3,935 | 3.5% |
[ 1.0% - 1.5% ] 1.02% | 32,114 | 6.5% |
[ 1.0% - 1.5% ] 1.06% | 4,790 | 4.9% |
[ 1.0% - 1.5% ] 1.11% | 31,316 | 4.0% |
[ 1.0% - 1.5% ] 1.16% | 4,413 | 2.4% |
[ 1.0% - 1.5% ] 1.20% | 916 | 14.3% |
[ 1.0% - 1.5% ] 1.33% | 18,115 | 6.2% |
[ 1.0% - 1.5% ] 1.38% | 4,773 | 9.9% |
[ 1.0% - 1.5% ] 1.43% | 3,572 | 18.7% |
[ 1.5% - 2.0% ] 1.52% | 197 | 16.2% |
[ 1.5% - 2.0% ] 1.62% | 26,607 | 10.4% |
[ 1.5% - 2.0% ] 1.86% | 1,664 | 12.8% |
[ 1.5% - 2.0% ] 1.88% | 1,221 | 20.0% |
[ 2.0% - 2.5% ] 2.23% | 20,716 | 8.5% |
[ 2.0% - 2.5% ] 2.32% | 18,077 | 4.4% |
[ 4.0% - 4.5% ] 4.10% | 1,513 | 19.7% |
[ 4.0% - 4.5% ] 4.19% | 2,961 | 6.8% |
[ 4.5% - 5.0% ] 4.62% | 1,473 | 22.7% |
[ 5.0% - 5.5% ] 5.42% | 1,366 | 1.9% |
[ 7.5% - 8.0% ] 7.64% | 419 | 12.6% |
[ 10.0% - 10.5% ] 10.42% | 307 | 19.1% |