Immigrants from Oceania Disability

COMPARE

Immigrants from Oceania
Race
Ancestry
AfghanAfricanAlaska NativeAlaskan AthabascanAlbanianAleutAlsatianAmericanApacheArabArapahoArgentineanArmenianAssyrian/Chaldean/SyriacAustralianAustrianBahamianBangladeshiBarbadianBasqueBelgianBelizeanBermudanBhutaneseBlackfeetBolivianBrazilianBritishBritish West IndianBulgarianBurmeseCajunCambodianCanadianCape VerdeanCarpatho RusynCelticCentral AmericanCentral American IndianCherokeeCheyenneChickasawChileanChineseChippewaChoctawColombianColvilleComancheCosta RicanCreeCreekCroatianCrowCubanCypriotCzechCzechoslovakianDanishDelawareDominicanDutchDutch West IndianEastern EuropeanEcuadorianEgyptianEnglishEstonianEthiopianEuropeanFijianFilipinoFinnishFrenchFrench American IndianFrench CanadianGermanGerman RussianGhanaianGreekGuamanian/ChamorroGuatemalanGuyaneseHaitianHmongHonduranHopiHoumaHungarianIcelanderIndian (Asian)IndonesianInupiatIranianIraqiIrishIroquoisIsraeliItalianJamaicanJapaneseJordanianKenyanKiowaKoreanLaotianLatvianLebaneseLiberianLithuanianLumbeeLuxembourgerMacedonianMalaysianMalteseMarshalleseMenomineeMexicanMexican American IndianMongolianMoroccanNative HawaiianNavajoNepaleseNew ZealanderNicaraguanNigerianNorthern EuropeanNorwegianOkinawanOsageOttawaPaiutePakistaniPalestinianPanamanianParaguayanPennsylvania GermanPeruvianPimaPolishPortuguesePotawatomiPuebloPuerto RicanPuget Sound SalishRomanianRussianSalvadoranSamoanScandinavianScotch-IrishScottishSeminoleSenegaleseSerbianShoshoneSierra LeoneanSiouxSlavicSlovakSloveneSomaliSouth AfricanSouth AmericanSouth American IndianSoviet UnionSpaniardSpanishSpanish AmericanSpanish American IndianSri LankanSubsaharan AfricanSudaneseSwedishSwissSyrianTaiwaneseThaiTlingit-HaidaTohono O'OdhamTonganTrinidadian and TobagonianTsimshianTurkishU.S. Virgin IslanderUgandanUkrainianUruguayanUteVenezuelanVietnameseWelshWest IndianYakamaYaquiYugoslavianYumanYup'ikZimbabwean
Immigration
NonimmigrantsImmigrantsAfghanistanAfricaAlbaniaArgentinaArmeniaAsiaAustraliaAustriaBahamasBangladeshBarbadosBelarusBelgiumBelizeBoliviaBosnia and HerzegovinaBrazilBulgariaBurma/MyanmarCabo VerdeCambodiaCameroonCanadaCaribbeanCentral AmericaChileChinaColombiaCongoCosta RicaCroatiaCubaCzechoslovakiaDenmarkDominicaDominican RepublicEastern AfricaEastern AsiaEastern EuropeEcuadorEgyptEl SalvadorEnglandEritreaEthiopiaEuropeFijiFranceGermanyGhanaGreeceGrenadaGuatemalaGuyanaHaitiHondurasHong KongHungaryIndiaIndonesiaIranIraqIrelandIsraelItalyJamaicaJapanJordanKazakhstanKenyaKoreaKuwaitLaosLatin AmericaLatviaLebanonLiberiaLithuaniaMalaysiaMexicoMicronesiaMiddle AfricaMoldovaMoroccoNepalNetherlandsNicaraguaNigeriaNorth AmericaNorth MacedoniaNorthern AfricaNorthern EuropeNorwayOceaniaPakistanPanamaPeruPhilippinesPolandPortugalRomaniaRussiaSaudi ArabiaScotlandSenegalSerbiaSierra LeoneSingaporeSomaliaSouth AfricaSouth AmericaSouth Central AsiaSouth Eastern AsiaSouthern EuropeSpainSri LankaSt. Vincent and the GrenadinesSudanSwedenSwitzerlandSyriaTaiwanThailandTrinidad and TobagoTurkeyUgandaUkraineUruguayUzbekistanVenezuelaVietnamWest IndiesWestern AfricaWestern AsiaWestern EuropeYemenZaireZimbabweAzores
Select to Compare
Race
Ancestry
AfghanAfricanAlaska NativeAlaskan AthabascanAlbanianAleutAlsatianAmericanApacheArabArapahoArgentineanArmenianAssyrian/Chaldean/SyriacAustralianAustrianBahamianBangladeshiBarbadianBasqueBelgianBelizeanBermudanBhutaneseBlackfeetBolivianBrazilianBritishBritish West IndianBulgarianBurmeseCajunCambodianCanadianCape VerdeanCarpatho RusynCelticCentral AmericanCentral American IndianCherokeeCheyenneChickasawChileanChineseChippewaChoctawColombianColvilleComancheCosta RicanCreeCreekCroatianCrowCubanCypriotCzechCzechoslovakianDanishDelawareDominicanDutchDutch West IndianEastern EuropeanEcuadorianEgyptianEnglishEstonianEthiopianEuropeanFijianFilipinoFinnishFrenchFrench American IndianFrench CanadianGermanGerman RussianGhanaianGreekGuamanian/ChamorroGuatemalanGuyaneseHaitianHmongHonduranHopiHoumaHungarianIcelanderIndian (Asian)IndonesianInupiatIranianIraqiIrishIroquoisIsraeliItalianJamaicanJapaneseJordanianKenyanKiowaKoreanLaotianLatvianLebaneseLiberianLithuanianLumbeeLuxembourgerMacedonianMalaysianMalteseMarshalleseMenomineeMexicanMexican American IndianMongolianMoroccanNative HawaiianNavajoNepaleseNew ZealanderNicaraguanNigerianNorthern EuropeanNorwegianOkinawanOsageOttawaPaiutePakistaniPalestinianPanamanianParaguayanPennsylvania GermanPeruvianPimaPolishPortuguesePotawatomiPuebloPuerto RicanPuget Sound SalishRomanianRussianSalvadoranSamoanScandinavianScotch-IrishScottishSeminoleSenegaleseSerbianShoshoneSierra LeoneanSiouxSlavicSlovakSloveneSomaliSouth AfricanSouth AmericanSouth American IndianSoviet UnionSpaniardSpanishSpanish AmericanSpanish American IndianSri LankanSubsaharan AfricanSudaneseSwedishSwissSyrianTaiwaneseThaiTlingit-HaidaTohono O'OdhamTonganTrinidadian and TobagonianTsimshianTurkishU.S. Virgin IslanderUgandanUkrainianUruguayanUteVenezuelanVietnameseWelshWest IndianYakamaYaquiYugoslavianYumanYup'ikZimbabwean
Immigration
NonimmigrantsImmigrantsAfghanistanAfricaAlbaniaArgentinaArmeniaAsiaAustraliaAustriaBahamasBangladeshBarbadosBelarusBelgiumBelizeBoliviaBosnia and HerzegovinaBrazilBulgariaBurma/MyanmarCabo VerdeCambodiaCameroonCanadaCaribbeanCentral AmericaChileChinaColombiaCongoCosta RicaCroatiaCubaCzechoslovakiaDenmarkDominicaDominican RepublicEastern AfricaEastern AsiaEastern EuropeEcuadorEgyptEl SalvadorEnglandEritreaEthiopiaEuropeFijiFranceGermanyGhanaGreeceGrenadaGuatemalaGuyanaHaitiHondurasHong KongHungaryIndiaIndonesiaIranIraqIrelandIsraelItalyJamaicaJapanJordanKazakhstanKenyaKoreaKuwaitLaosLatin AmericaLatviaLebanonLiberiaLithuaniaMalaysiaMexicoMicronesiaMiddle AfricaMoldovaMoroccoNepalNetherlandsNicaraguaNigeriaNorth AmericaNorth MacedoniaNorthern AfricaNorthern EuropeNorwayPakistanPanamaPeruPhilippinesPolandPortugalRomaniaRussiaSaudi ArabiaScotlandSenegalSerbiaSierra LeoneSingaporeSomaliaSouth AfricaSouth AmericaSouth Central AsiaSouth Eastern AsiaSouthern EuropeSpainSri LankaSt. Vincent and the GrenadinesSudanSwedenSwitzerlandSyriaTaiwanThailandTrinidad and TobagoTurkeyUgandaUkraineUruguayUzbekistanVenezuelaVietnamWest IndiesWestern AfricaWestern AsiaWestern EuropeYemenZaireZimbabweAzores
Disability
Income
Poverty
Unemployment
Labor Participation
Family Structure
Vehicle Availability
Education Level
Disability

Immigrants from Oceania Disability
Fair

11.8%
DISABILITY
34.3/ 100
METRIC RATING
181st/ 347
METRIC RANK

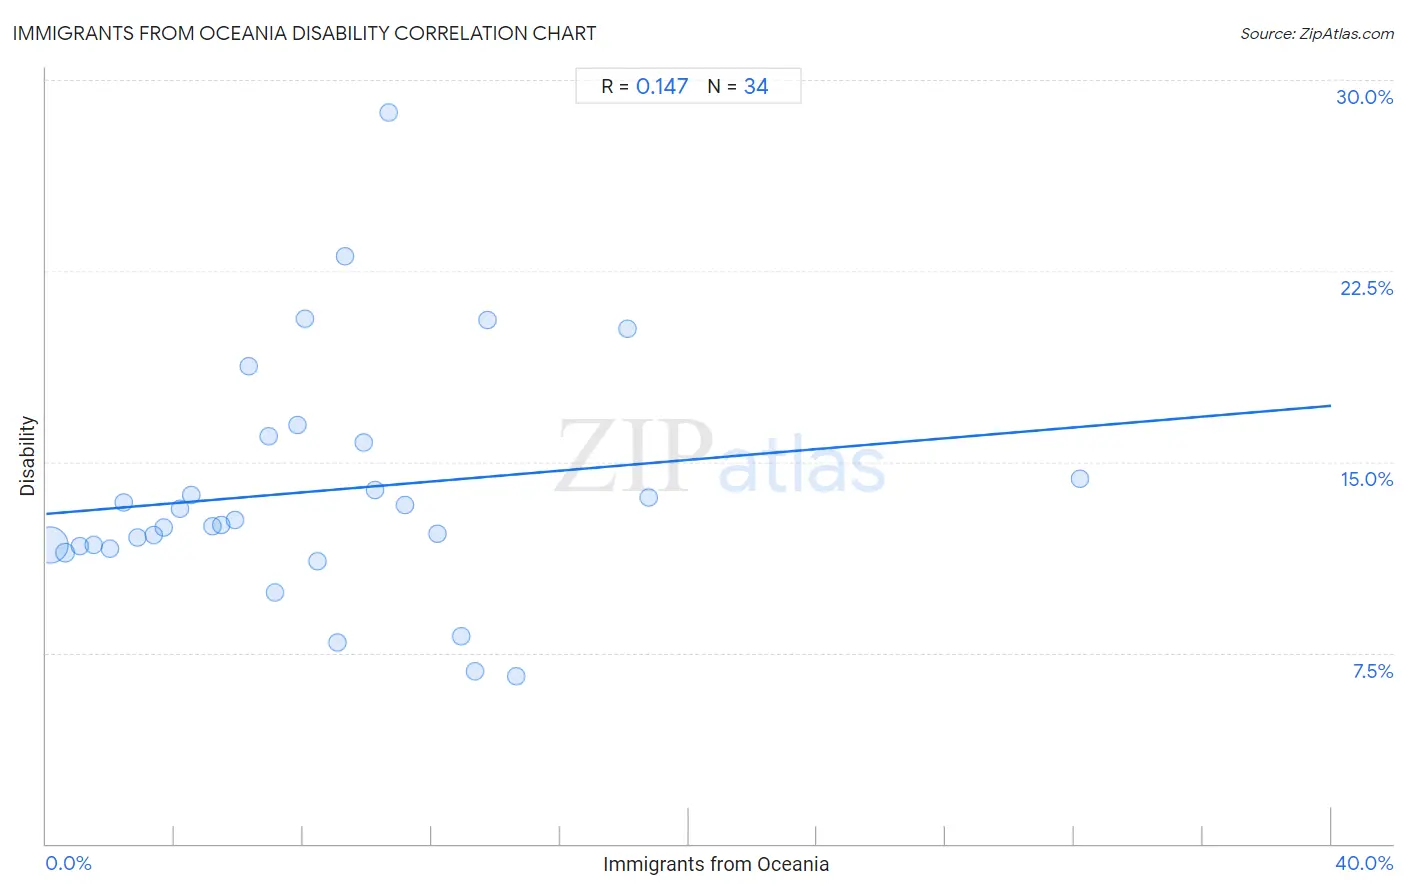
Immigrants from Oceania Disability Correlation Chart

The statistical analysis conducted on geographies consisting of 305,494,892 people shows a poor positive correlation between the proportion of Immigrants from Oceania and percentage of population with a disability in the United States with a correlation coefficient (R) of 0.147 and weighted average of 11.8%. On average, for every 1% (one percent) increase in Immigrants from Oceania within a typical geography, there is an increase of 0.11% in percentage of population with a disability.
Immigrants from Oceania Disability
It is essential to understand that the correlation between the percentage of Immigrants from Oceania and percentage of population with a disability does not imply a direct cause-and-effect relationship. It remains uncertain whether the presence of Immigrants from Oceania influences an upward or downward trend in the level of percentage of population with a disability within an area, or if Immigrants from Oceania simply ended up residing in those areas with higher or lower levels of percentage of population with a disability due to other factors.

Demographics Similar to Immigrants from Oceania by Disability

In terms of disability, the demographic groups most similar to Immigrants from Oceania are Icelander (11.8%, a difference of 0.010%), Honduran (11.8%, a difference of 0.15%), Immigrants from Honduras (11.8%, a difference of 0.17%), Iraqi (11.8%, a difference of 0.21%), and Immigrants from Burma/Myanmar (11.8%, a difference of 0.30%).
DemographicsRating | RankDisability
Albanians
50.0
/100
|
#174
Average
11.7%
Haitians
48.6
/100
|
#175
Average
11.7%
Immigrants from Western Africa
47.5
/100
|
#176
Average
11.7%
Immigrants from Central America
46.6
/100
|
#177
Average
11.7%
Greeks
46.2
/100
|
#178
Average
11.7%
Immigrants from Armenia
41.9
/100
|
#179
Average
11.7%
Immigrants from Honduras
37.8
/100
|
#180
Fair
11.8%
Immigrants from Oceania
34.3
/100
|
#181
Fair
11.8%
Icelanders
34.0
/100
|
#182
Fair
11.8%
Hondurans
31.2
/100
|
#183
Fair
11.8%
Iraqis
30.0
/100
|
#184
Fair
11.8%
Immigrants from Burma/Myanmar
28.5
/100
|
#185
Fair
11.8%
Immigrants from Scotland
28.2
/100
|
#186
Fair
11.8%
Lebanese
27.9
/100
|
#187
Fair
11.8%
Immigrants from Mexico
23.8
/100
|
#188
Fair
11.9%

Immigrants from Oceania Disability Correlation Summary

MeasurementImmigrants from Oceania DataDisability Data
Minimum0.11%6.6%
Maximum32.2%28.7%
Range32.1%22.1%
Mean8.3%13.8%
Median7.5%12.6%
Interquartile 25% (IQ1)3.6%11.7%
Interquartile 75% (IQ3)11.2%15.8%
Interquartile Range (IQR)7.5%4.1%
Standard Deviation (Sample)6.4%4.6%
Standard Deviation (Population)6.3%4.6%

Correlation Details

Immigrants from Oceania PercentileSample SizeDisability
[
0.0%
-
0.5%
]
0.11%
281,286,10911.7%
[
0.5%
-
1.0%
]
0.60%
14,214,91911.4%
[
1.0%
-
1.5%
]
1.06%
4,771,82411.7%
[
1.0%
-
1.5%
]
1.49%
2,254,47811.7%
[
1.5%
-
2.0%
]
1.97%
821,61311.6%
[
2.0%
-
2.5%
]
2.42%
510,96313.4%
[
2.5%
-
3.0%
]
2.84%
638,68112.0%
[
3.0%
-
3.5%
]
3.36%
184,13112.1%
[
3.5%
-
4.0%
]
3.65%
261,84612.4%
[
4.0%
-
4.5%
]
4.16%
83,39013.2%
[
4.0%
-
4.5%
]
4.50%
81,48013.7%
[
5.0%
-
5.5%
]
5.17%
208,62712.5%
[
5.0%
-
5.5%
]
5.43%
42,81412.5%
[
5.5%
-
6.0%
]
5.89%
4,43312.7%
[
6.0%
-
6.5%
]
6.32%
6,90118.8%
[
6.5%
-
7.0%
]
6.94%
6,15616.0%
[
7.0%
-
7.5%
]
7.12%
63,3749.9%
[
7.5%
-
8.0%
]
7.82%
15,34216.5%
[
8.0%
-
8.5%
]
8.06%
7,39220.6%
[
8.0%
-
8.5%
]
8.45%
5,22111.1%
[
9.0%
-
9.5%
]
9.07%
1,0917.9%
[
9.0%
-
9.5%
]
9.32%
71923.1%
[
9.5%
-
10.0%
]
9.89%
2,17415.8%
[
10.0%
-
10.5%
]
10.25%
4,21413.9%
[
10.5%
-
11.0%
]
10.67%
1,05928.7%
[
11.0%
-
11.5%
]
11.17%
1,67413.3%
[
12.0%
-
12.5%
]
12.20%
4112.2%
[
12.5%
-
13.0%
]
12.94%
7,2368.2%
[
13.0%
-
13.5%
]
13.36%
5,4116.8%
[
13.5%
-
14.0%
]
13.73%
10220.6%
[
14.5%
-
15.0%
]
14.65%
1986.6%
[
18.0%
-
18.5%
]
18.09%
18820.2%
[
18.5%
-
19.0%
]
18.76%
69313.6%
[
32.0%
-
32.5%
]
32.16%
39814.3%