Smithsburg, MD Map & Demographics
Smithsburg Map
Smithsburg Overview
$37,171
PER CAPITA INCOME
$111,000
AVG FAMILY INCOME
$89,167
AVG HOUSEHOLD INCOME
31.8%
WAGE / INCOME GAP [ % ]
68.2¢/ $1
WAGE / INCOME GAP [ $ ]
0.39
INEQUALITY / GINI INDEX
3,028
TOTAL POPULATION
1,377
MALE POPULATION
1,651
FEMALE POPULATION
83.40
MALES / 100 FEMALES
119.90
FEMALES / 100 MALES
34.4
MEDIAN AGE
3.4
AVG FAMILY SIZE
2.9
AVG HOUSEHOLD SIZE
1,549
LABOR FORCE [ PEOPLE ]
70.2%
PERCENT IN LABOR FORCE
3.4%
UNEMPLOYMENT RATE
Smithsburg Zip Codes
Income in Smithsburg
Income Overview in Smithsburg
Per Capita Income in Smithsburg is $37,171, while median incomes of families and households are $111,000 and $89,167 respectively.
| Characteristic | Number | Measure |
| Per Capita Income | 3,028 | $37,171 |
| Median Family Income | 782 | $111,000 |
| Mean Family Income | 782 | $113,822 |
| Median Household Income | 1,040 | $89,167 |
| Mean Household Income | 1,040 | $106,137 |
| Income Deficit | 782 | $0 |
| Wage / Income Gap (%) | 3,028 | 31.81% |
| Wage / Income Gap ($) | 3,028 | 68.19¢ per $1 |
| Gini / Inequality Index | 3,028 | 0.39 |
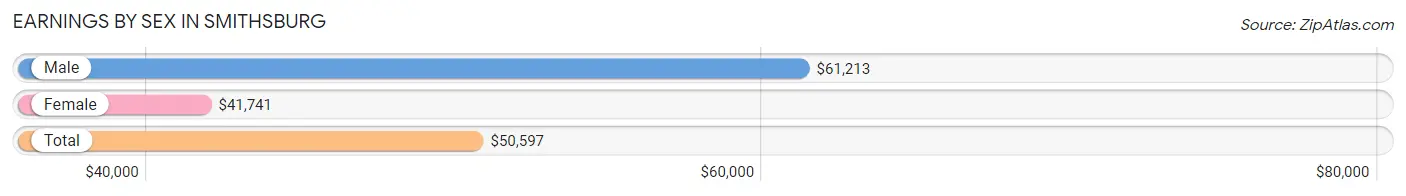
Earnings by Sex in Smithsburg
Average Earnings in Smithsburg are $50,597, $61,213 for men and $41,741 for women, a difference of 31.8%.
| Sex | Number | Average Earnings |
| Male | 731 (46.6%) | $61,213 |
| Female | 838 (53.4%) | $41,741 |
| Total | 1,569 (100.0%) | $50,597 |
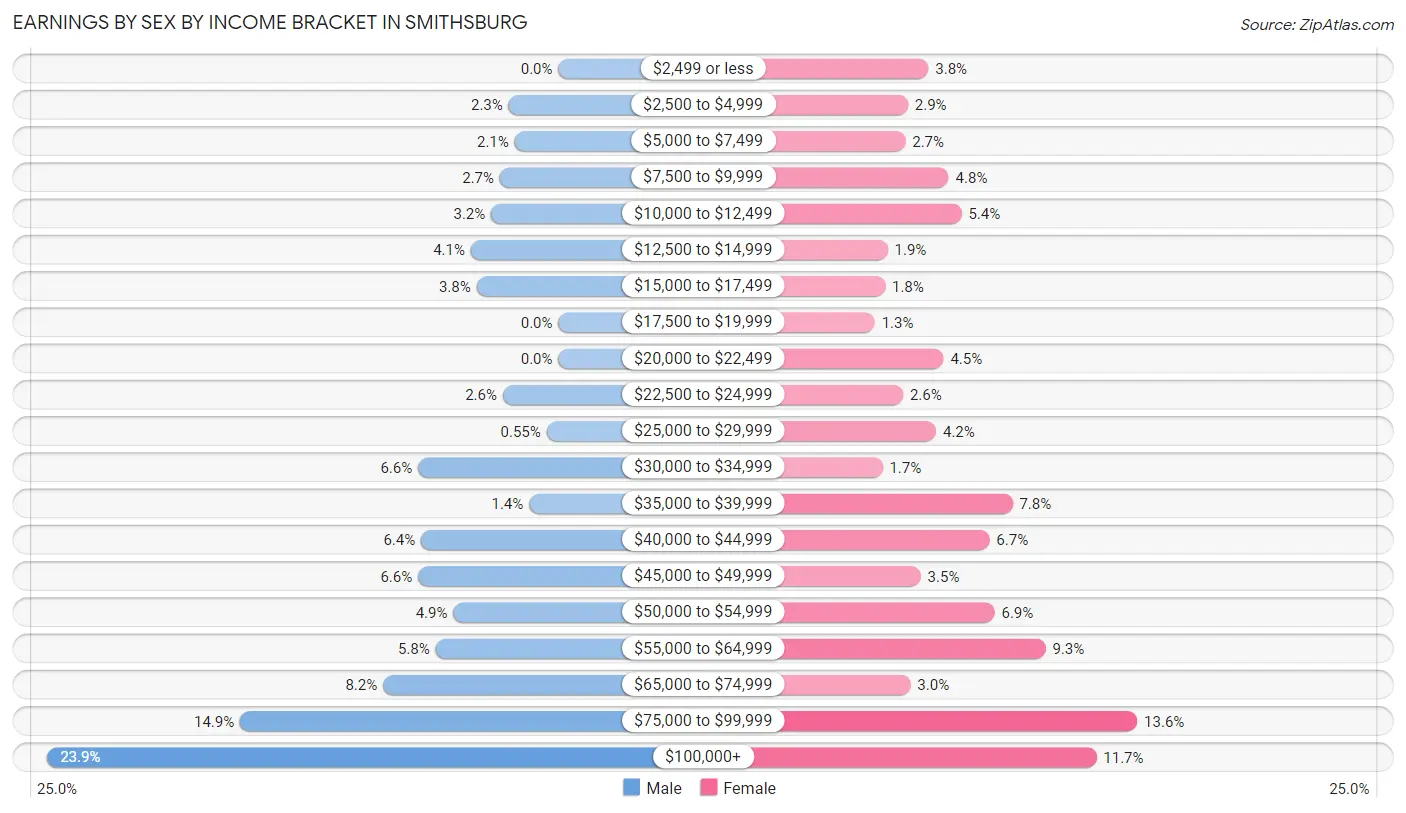
Earnings by Sex by Income Bracket in Smithsburg
The most common earnings brackets in Smithsburg are $100,000+ for men (175 | 23.9%) and $75,000 to $99,999 for women (114 | 13.6%).
| Income | Male | Female |
| $2,499 or less | 0 (0.0%) | 32 (3.8%) |
| $2,500 to $4,999 | 17 (2.3%) | 24 (2.9%) |
| $5,000 to $7,499 | 15 (2.1%) | 23 (2.7%) |
| $7,500 to $9,999 | 20 (2.7%) | 40 (4.8%) |
| $10,000 to $12,499 | 23 (3.2%) | 45 (5.4%) |
| $12,500 to $14,999 | 30 (4.1%) | 16 (1.9%) |
| $15,000 to $17,499 | 28 (3.8%) | 15 (1.8%) |
| $17,500 to $19,999 | 0 (0.0%) | 11 (1.3%) |
| $20,000 to $22,499 | 0 (0.0%) | 38 (4.5%) |
| $22,500 to $24,999 | 19 (2.6%) | 22 (2.6%) |
| $25,000 to $29,999 | 4 (0.5%) | 35 (4.2%) |
| $30,000 to $34,999 | 48 (6.6%) | 14 (1.7%) |
| $35,000 to $39,999 | 10 (1.4%) | 65 (7.8%) |
| $40,000 to $44,999 | 47 (6.4%) | 56 (6.7%) |
| $45,000 to $49,999 | 48 (6.6%) | 29 (3.5%) |
| $50,000 to $54,999 | 36 (4.9%) | 58 (6.9%) |
| $55,000 to $64,999 | 42 (5.8%) | 78 (9.3%) |
| $65,000 to $74,999 | 60 (8.2%) | 25 (3.0%) |
| $75,000 to $99,999 | 109 (14.9%) | 114 (13.6%) |
| $100,000+ | 175 (23.9%) | 98 (11.7%) |
| Total | 731 (100.0%) | 838 (100.0%) |
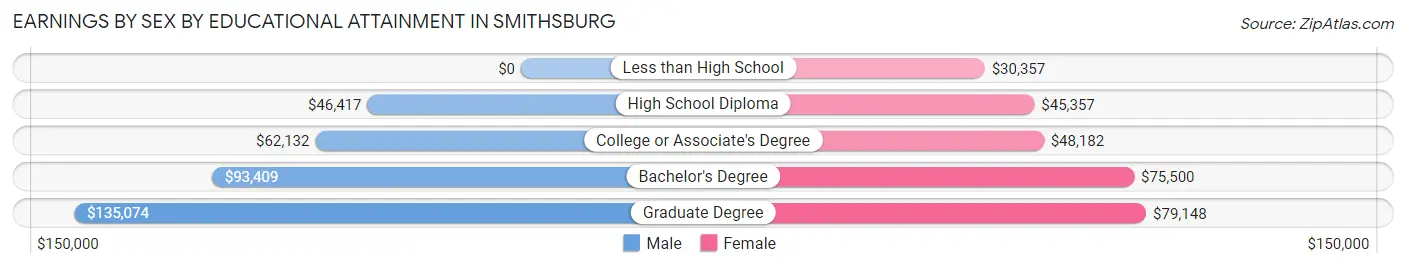
Earnings by Sex by Educational Attainment in Smithsburg
Average earnings in Smithsburg are $65,550 for men and $52,587 for women, a difference of 19.8%. Men with an educational attainment of graduate degree enjoy the highest average annual earnings of $135,074, while those with high school diploma education earn the least with $46,417. Women with an educational attainment of graduate degree earn the most with the average annual earnings of $79,148, while those with less than high school education have the smallest earnings of $30,357.
| Educational Attainment | Male Income | Female Income |
| Less than High School | - | - |
| High School Diploma | $46,417 | $45,357 |
| College or Associate's Degree | $62,132 | $48,182 |
| Bachelor's Degree | $93,409 | $75,500 |
| Graduate Degree | $135,074 | $79,148 |
| Total | $65,550 | $52,587 |
Family Income in Smithsburg
Family Income Brackets in Smithsburg
According to the Smithsburg family income data, there are 257 families falling into the $100,000 to $149,999 income range, which is the most common income bracket and makes up 32.9% of all families.
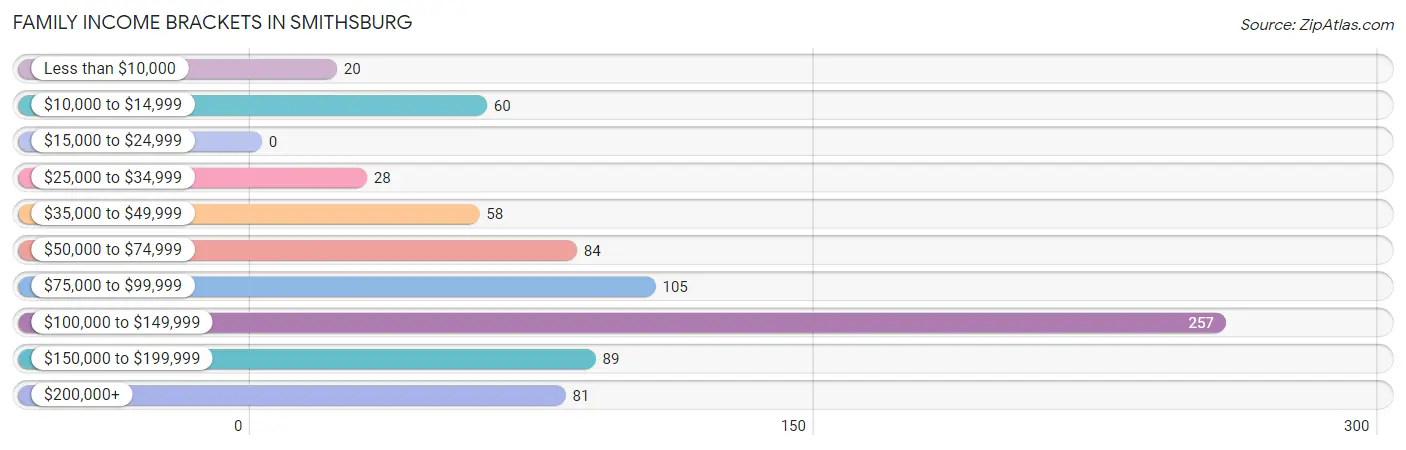
| Income Bracket | # Families | % Families |
| Less than $10,000 | 20 | 2.6% |
| $10,000 to $14,999 | 60 | 7.7% |
| $15,000 to $24,999 | 0 | 0.0% |
| $25,000 to $34,999 | 28 | 3.6% |
| $35,000 to $49,999 | 58 | 7.4% |
| $50,000 to $74,999 | 84 | 10.7% |
| $75,000 to $99,999 | 105 | 13.4% |
| $100,000 to $149,999 | 257 | 32.9% |
| $150,000 to $199,999 | 89 | 11.4% |
| $200,000+ | 81 | 10.4% |
Family Income by Famaliy Size in Smithsburg
5-person families (39 | 5.0%) account for the highest median family income in Smithsburg with $149,766 per family, while 2-person families (330 | 42.2%) have the highest median income of $43,988 per family member.
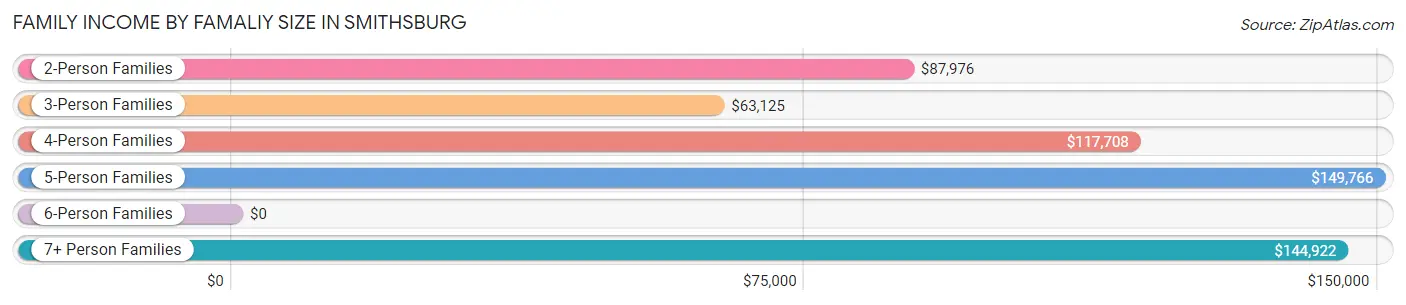
| Income Bracket | # Families | Median Income |
| 2-Person Families | 330 (42.2%) | $87,976 |
| 3-Person Families | 144 (18.4%) | $63,125 |
| 4-Person Families | 197 (25.2%) | $117,708 |
| 5-Person Families | 39 (5.0%) | $149,766 |
| 6-Person Families | 17 (2.2%) | $0 |
| 7+ Person Families | 55 (7.0%) | $144,922 |
| Total | 782 (100.0%) | $111,000 |
Family Income by Number of Earners in Smithsburg
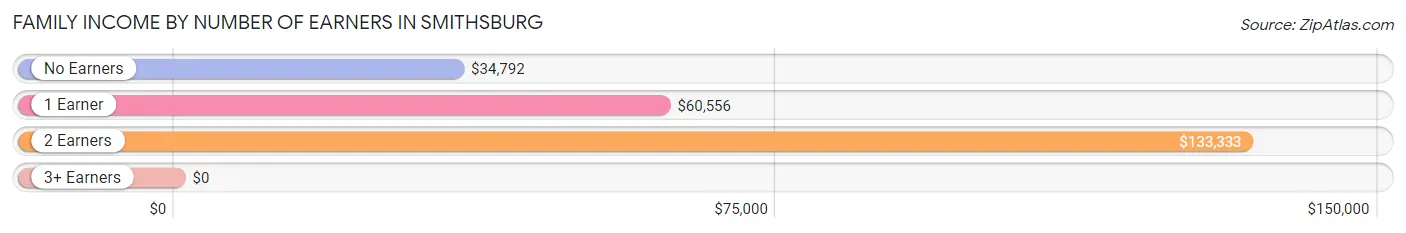
| Number of Earners | # Families | Median Income |
| No Earners | 87 (11.1%) | $34,792 |
| 1 Earner | 246 (31.5%) | $60,556 |
| 2 Earners | 348 (44.5%) | $133,333 |
| 3+ Earners | 101 (12.9%) | $0 |
| Total | 782 (100.0%) | $111,000 |
Household Income in Smithsburg
Household Income Brackets in Smithsburg
With 290 households falling in the category, the $100,000 to $149,999 income range is the most frequent in Smithsburg, accounting for 27.9% of all households. In contrast, only 16 households (1.5%) fall into the less than $10,000 income bracket, making it the least populous group.
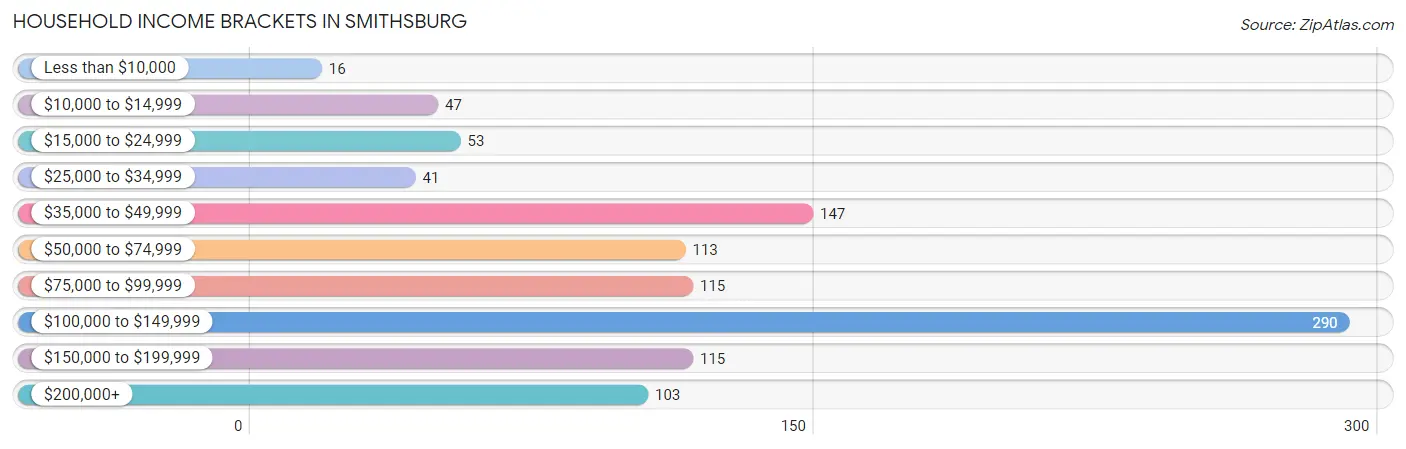
| Income Bracket | # Households | % Households |
| Less than $10,000 | 16 | 1.5% |
| $10,000 to $14,999 | 47 | 4.5% |
| $15,000 to $24,999 | 53 | 5.1% |
| $25,000 to $34,999 | 41 | 3.9% |
| $35,000 to $49,999 | 147 | 14.1% |
| $50,000 to $74,999 | 113 | 10.9% |
| $75,000 to $99,999 | 115 | 11.1% |
| $100,000 to $149,999 | 290 | 27.9% |
| $150,000 to $199,999 | 115 | 11.1% |
| $200,000+ | 103 | 9.9% |
Household Income by Householder Age in Smithsburg
The median household income in Smithsburg is $89,167, with the highest median household income of $111,719 found in the 45 to 64 years age bracket for the primary householder. A total of 442 households (42.5%) fall into this category. Meanwhile, the 15 to 24 years age bracket for the primary householder has the lowest median household income of $0, with 49 households (4.7%) in this group.
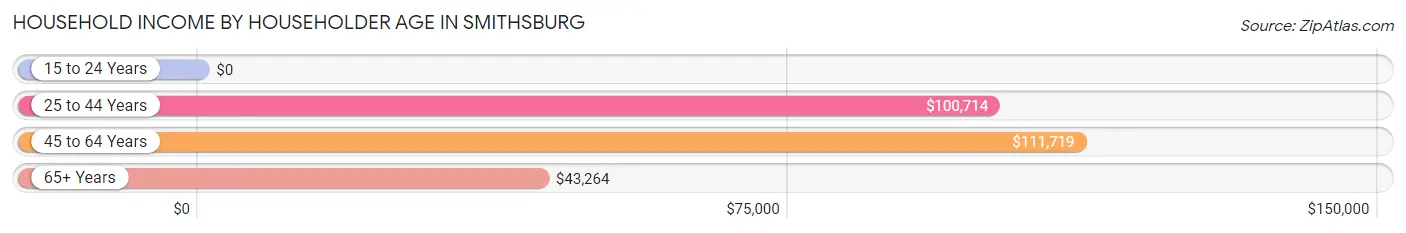
| Income Bracket | # Households | Median Income |
| 15 to 24 Years | 49 (4.7%) | $0 |
| 25 to 44 Years | 330 (31.7%) | $100,714 |
| 45 to 64 Years | 442 (42.5%) | $111,719 |
| 65+ Years | 219 (21.1%) | $43,264 |
| Total | 1,040 (100.0%) | $89,167 |
Poverty in Smithsburg
Income Below Poverty by Sex and Age in Smithsburg
With 14.8% poverty level for males and 8.9% for females among the residents of Smithsburg, 5 year old males and 25 to 34 year old females are the most vulnerable to poverty, with 22 males (100.0%) and 62 females (27.8%) in their respective age groups living below the poverty level.
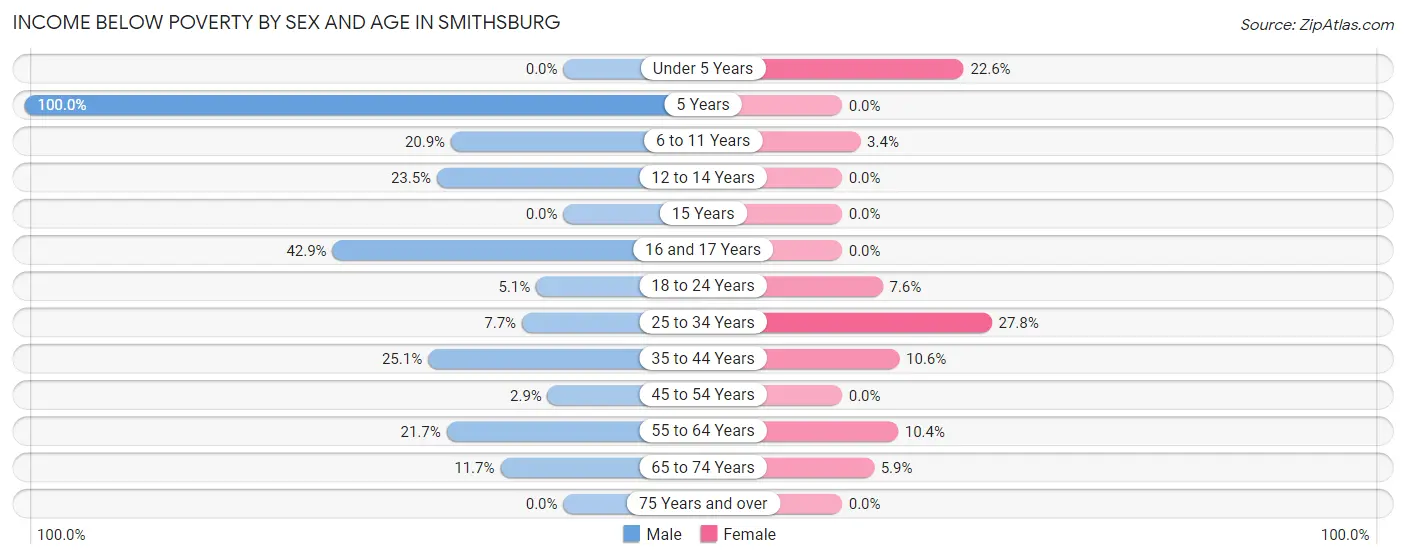
| Age Bracket | Male | Female |
| Under 5 Years | 0 (0.0%) | 21 (22.6%) |
| 5 Years | 22 (100.0%) | 0 (0.0%) |
| 6 to 11 Years | 29 (20.9%) | 6 (3.4%) |
| 12 to 14 Years | 19 (23.5%) | 0 (0.0%) |
| 15 Years | 0 (0.0%) | 0 (0.0%) |
| 16 and 17 Years | 18 (42.9%) | 0 (0.0%) |
| 18 to 24 Years | 8 (5.1%) | 9 (7.6%) |
| 25 to 34 Years | 11 (7.7%) | 62 (27.8%) |
| 35 to 44 Years | 48 (25.1%) | 20 (10.6%) |
| 45 to 54 Years | 6 (2.9%) | 0 (0.0%) |
| 55 to 64 Years | 31 (21.7%) | 21 (10.4%) |
| 65 to 74 Years | 11 (11.7%) | 8 (5.9%) |
| 75 Years and over | 0 (0.0%) | 0 (0.0%) |
| Total | 203 (14.8%) | 147 (8.9%) |
Income Above Poverty by Sex and Age in Smithsburg
According to the poverty statistics in Smithsburg, males aged under 5 years and females aged 5 years are the age groups that are most secure financially, with 100.0% of males and 100.0% of females in these age groups living above the poverty line.
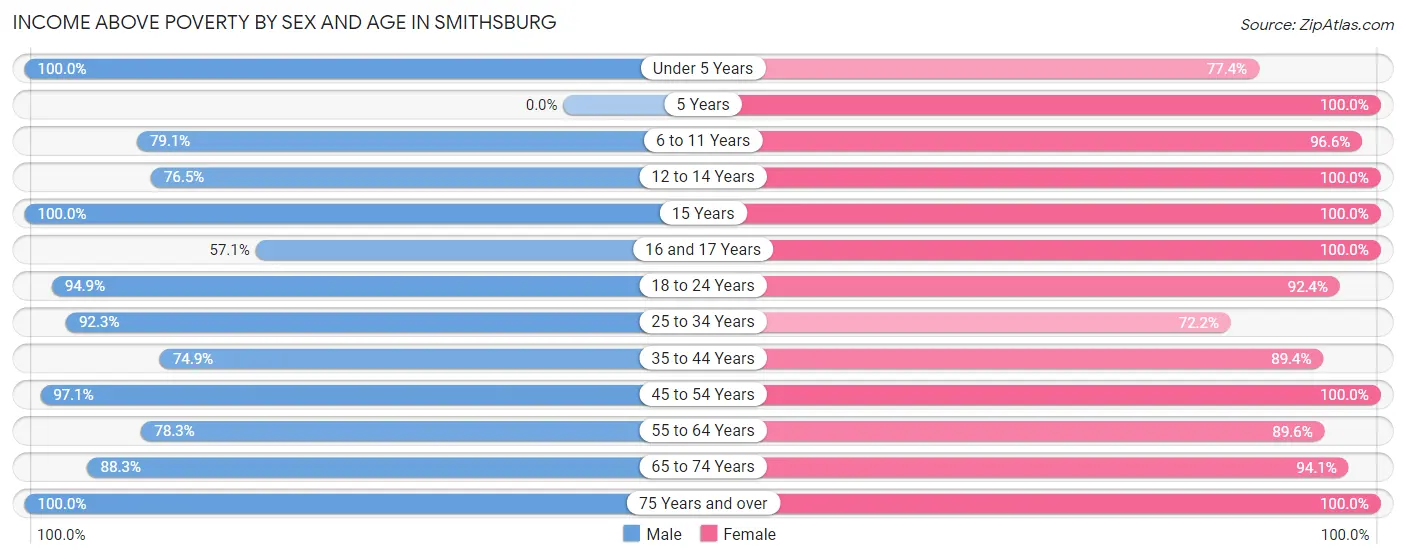
| Age Bracket | Male | Female |
| Under 5 Years | 70 (100.0%) | 72 (77.4%) |
| 5 Years | 0 (0.0%) | 24 (100.0%) |
| 6 to 11 Years | 110 (79.1%) | 170 (96.6%) |
| 12 to 14 Years | 62 (76.5%) | 113 (100.0%) |
| 15 Years | 53 (100.0%) | 45 (100.0%) |
| 16 and 17 Years | 24 (57.1%) | 51 (100.0%) |
| 18 to 24 Years | 150 (94.9%) | 110 (92.4%) |
| 25 to 34 Years | 132 (92.3%) | 161 (72.2%) |
| 35 to 44 Years | 143 (74.9%) | 168 (89.4%) |
| 45 to 54 Years | 200 (97.1%) | 200 (100.0%) |
| 55 to 64 Years | 112 (78.3%) | 181 (89.6%) |
| 65 to 74 Years | 83 (88.3%) | 127 (94.1%) |
| 75 Years and over | 30 (100.0%) | 82 (100.0%) |
| Total | 1,169 (85.2%) | 1,504 (91.1%) |
Income Below Poverty Among Married-Couple Families in Smithsburg
The poverty statistics for married-couple families in Smithsburg show that 4.1% or 22 of the total 539 families live below the poverty line. Families with 3 or 4 children have the highest poverty rate of 9.5%, comprising of 7 families. On the other hand, families with 5 or more children have the lowest poverty rate of 0.0%, which includes 0 families.
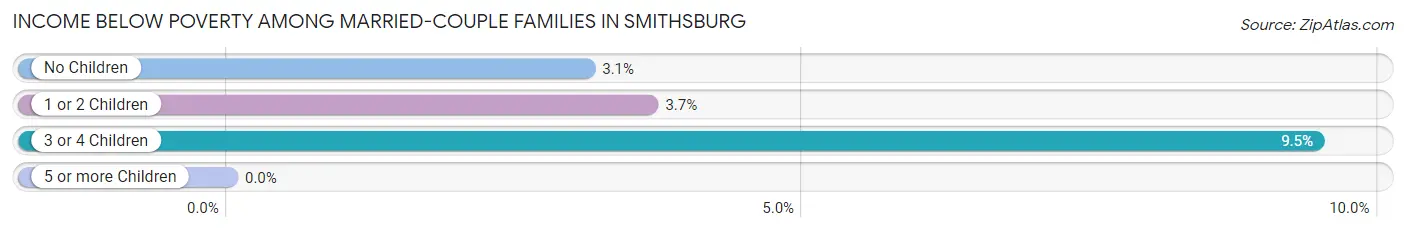
| Children | Above Poverty | Below Poverty |
| No Children | 280 (96.9%) | 9 (3.1%) |
| 1 or 2 Children | 158 (96.3%) | 6 (3.7%) |
| 3 or 4 Children | 67 (90.5%) | 7 (9.5%) |
| 5 or more Children | 12 (100.0%) | 0 (0.0%) |
| Total | 517 (95.9%) | 22 (4.1%) |
Income Below Poverty Among Single-Parent Households in Smithsburg
According to the poverty data in Smithsburg, 52.3% or 23 single-father households and 21.1% or 42 single-mother households are living below the poverty line. Among single-father households, those with no children have the highest poverty rate, with 23 households (100.0%) experiencing poverty. Likewise, among single-mother households, those with 3 or 4 children have the highest poverty rate, with 25 households (58.1%) falling below the poverty line.
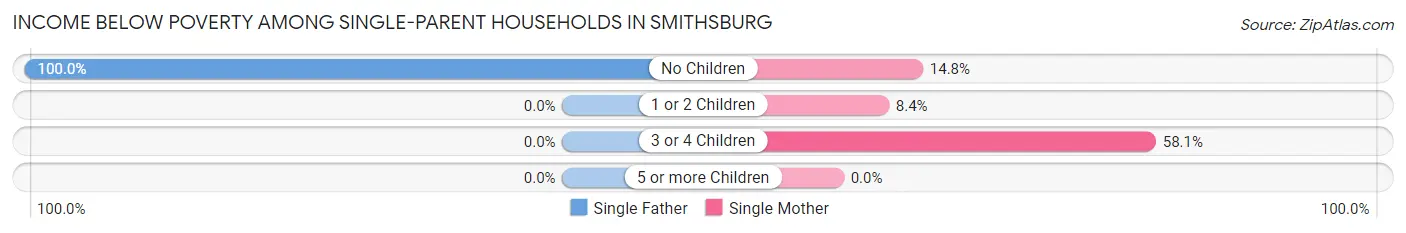
| Children | Single Father | Single Mother |
| No Children | 23 (100.0%) | 9 (14.7%) |
| 1 or 2 Children | 0 (0.0%) | 8 (8.4%) |
| 3 or 4 Children | 0 (0.0%) | 25 (58.1%) |
| 5 or more Children | 0 (0.0%) | 0 (0.0%) |
| Total | 23 (52.3%) | 42 (21.1%) |
Income Below Poverty Among Married-Couple vs Single-Parent Households in Smithsburg
The poverty data for Smithsburg shows that 22 of the married-couple family households (4.1%) and 65 of the single-parent households (26.8%) are living below the poverty level. Within the married-couple family households, those with 3 or 4 children have the highest poverty rate, with 7 households (9.5%) falling below the poverty line. Among the single-parent households, those with 3 or 4 children have the highest poverty rate, with 25 household (53.2%) living below poverty.
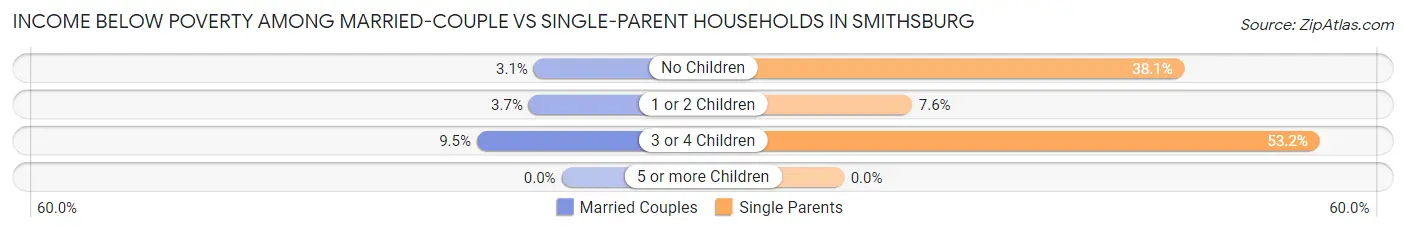
| Children | Married-Couple Families | Single-Parent Households |
| No Children | 9 (3.1%) | 32 (38.1%) |
| 1 or 2 Children | 6 (3.7%) | 8 (7.6%) |
| 3 or 4 Children | 7 (9.5%) | 25 (53.2%) |
| 5 or more Children | 0 (0.0%) | 0 (0.0%) |
| Total | 22 (4.1%) | 65 (26.8%) |
Race in Smithsburg
The most populous races in Smithsburg are White / Caucasian (2,808 | 92.7%), Black / African American (100 | 3.3%), and Two or more Races (80 | 2.6%).
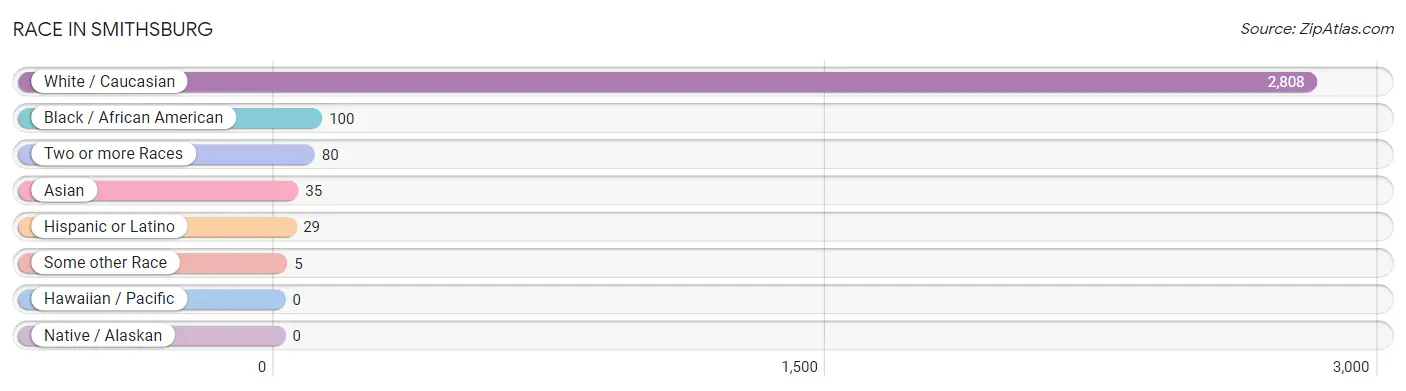
| Race | # Population | % Population |
| Asian | 35 | 1.2% |
| Black / African American | 100 | 3.3% |
| Hawaiian / Pacific | 0 | 0.0% |
| Hispanic or Latino | 29 | 1.0% |
| Native / Alaskan | 0 | 0.0% |
| White / Caucasian | 2,808 | 92.7% |
| Two or more Races | 80 | 2.6% |
| Some other Race | 5 | 0.2% |
| Total | 3,028 | 100.0% |
Ancestry in Smithsburg
The most populous ancestries reported in Smithsburg are German (884 | 29.2%), Irish (658 | 21.7%), English (336 | 11.1%), French (217 | 7.2%), and American (137 | 4.5%), together accounting for 73.7% of all Smithsburg residents.
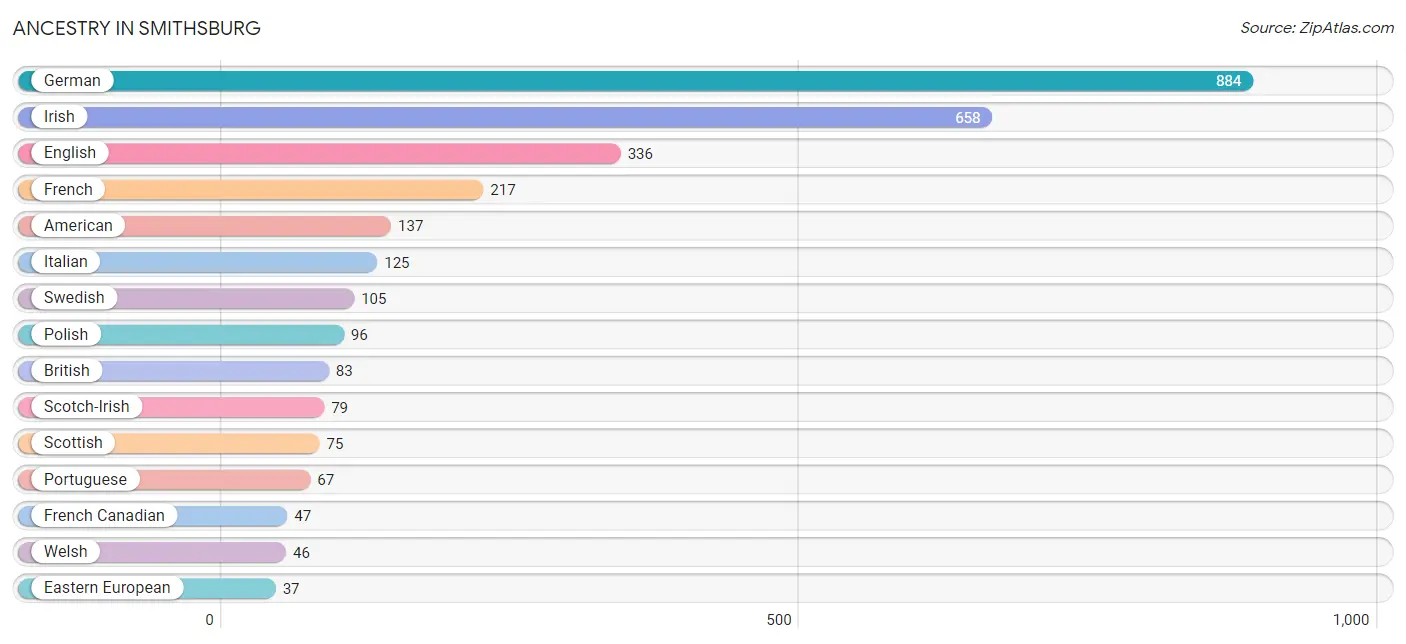
| Ancestry | # Population | % Population |
| American | 137 | 4.5% |
| Arab | 7 | 0.2% |
| Bhutanese | 14 | 0.5% |
| British | 83 | 2.7% |
| Central American | 15 | 0.5% |
| Cherokee | 1 | 0.0% |
| Czechoslovakian | 15 | 0.5% |
| Dutch | 21 | 0.7% |
| Eastern European | 37 | 1.2% |
| English | 336 | 11.1% |
| European | 23 | 0.8% |
| French | 217 | 7.2% |
| French Canadian | 47 | 1.5% |
| German | 884 | 29.2% |
| Ghanaian | 6 | 0.2% |
| Greek | 20 | 0.7% |
| Honduran | 12 | 0.4% |
| Hungarian | 15 | 0.5% |
| Indian (Asian) | 37 | 1.2% |
| Irish | 658 | 21.7% |
| Italian | 125 | 4.1% |
| Korean | 24 | 0.8% |
| Lebanese | 7 | 0.2% |
| Lithuanian | 15 | 0.5% |
| Mexican | 5 | 0.2% |
| Norwegian | 11 | 0.4% |
| Panamanian | 3 | 0.1% |
| Polish | 96 | 3.2% |
| Portuguese | 67 | 2.2% |
| Puerto Rican | 9 | 0.3% |
| Russian | 4 | 0.1% |
| Scandinavian | 6 | 0.2% |
| Scotch-Irish | 79 | 2.6% |
| Scottish | 75 | 2.5% |
| Sierra Leonean | 16 | 0.5% |
| Slovak | 8 | 0.3% |
| Slovene | 14 | 0.5% |
| Subsaharan African | 22 | 0.7% |
| Swedish | 105 | 3.5% |
| Trinidadian and Tobagonian | 11 | 0.4% |
| Ukrainian | 10 | 0.3% |
| Welsh | 46 | 1.5% | View All 42 Rows |
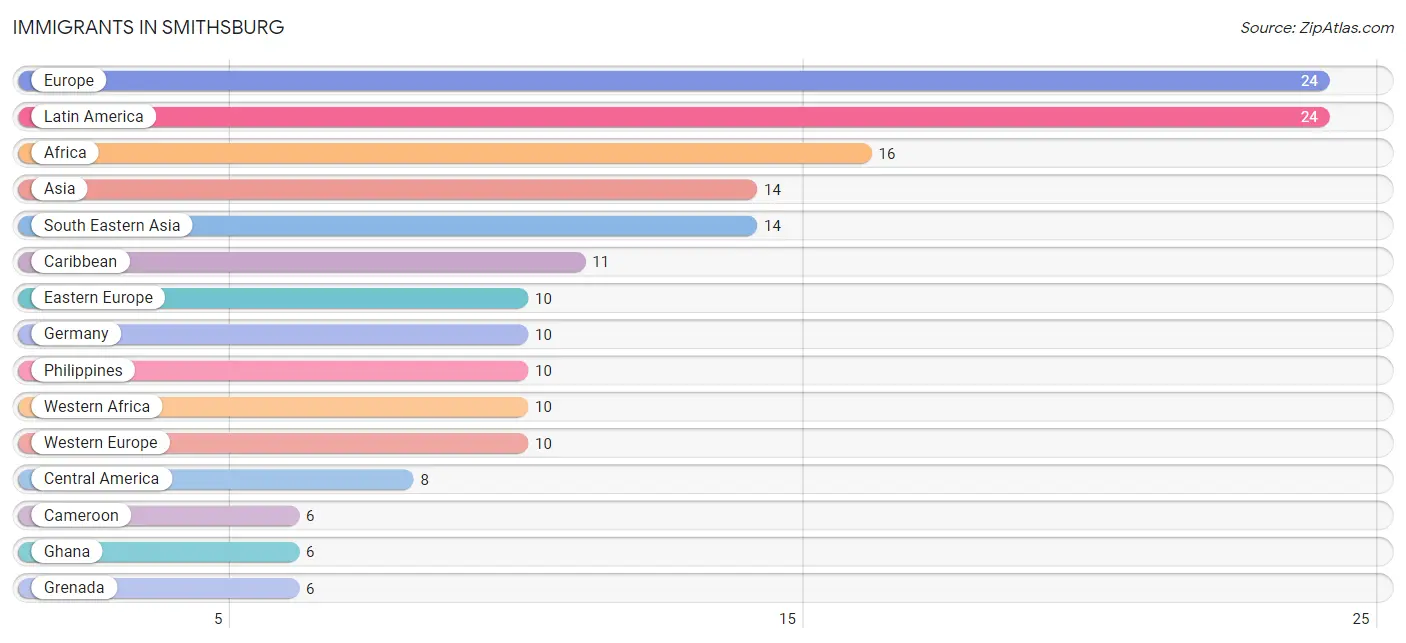
Immigrants in Smithsburg
The most numerous immigrant groups reported in Smithsburg came from Europe (24 | 0.8%), Latin America (24 | 0.8%), Africa (16 | 0.5%), Asia (14 | 0.5%), and South Eastern Asia (14 | 0.5%), together accounting for 3.0% of all Smithsburg residents.
| Immigration Origin | # Population | % Population |
| Africa | 16 | 0.5% |
| Asia | 14 | 0.5% |
| Cameroon | 6 | 0.2% |
| Canada | 3 | 0.1% |
| Caribbean | 11 | 0.4% |
| Central America | 8 | 0.3% |
| Colombia | 5 | 0.2% |
| Eastern Europe | 10 | 0.3% |
| Europe | 24 | 0.8% |
| Germany | 10 | 0.3% |
| Ghana | 6 | 0.2% |
| Grenada | 6 | 0.2% |
| Latin America | 24 | 0.8% |
| Malaysia | 4 | 0.1% |
| Mexico | 5 | 0.2% |
| Middle Africa | 6 | 0.2% |
| Northern Europe | 4 | 0.1% |
| Panama | 3 | 0.1% |
| Philippines | 10 | 0.3% |
| Russia | 5 | 0.2% |
| Sierra Leone | 4 | 0.1% |
| South America | 5 | 0.2% |
| South Eastern Asia | 14 | 0.5% |
| Trinidad and Tobago | 5 | 0.2% |
| Ukraine | 5 | 0.2% |
| Western Africa | 10 | 0.3% |
| Western Europe | 10 | 0.3% | View All 27 Rows |
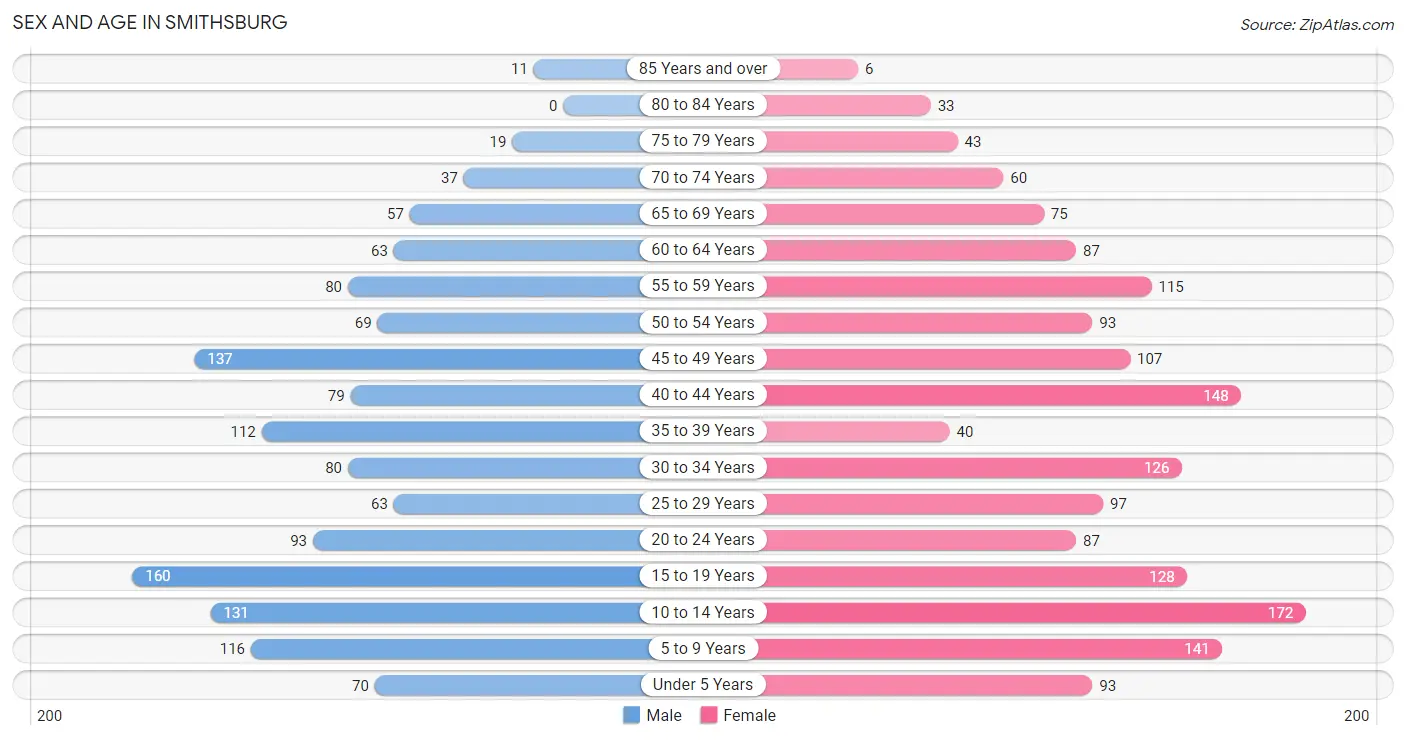
Sex and Age in Smithsburg
Sex and Age in Smithsburg
The most populous age groups in Smithsburg are 15 to 19 Years (160 | 11.6%) for men and 10 to 14 Years (172 | 10.4%) for women.
| Age Bracket | Male | Female |
| Under 5 Years | 70 (5.1%) | 93 (5.6%) |
| 5 to 9 Years | 116 (8.4%) | 141 (8.5%) |
| 10 to 14 Years | 131 (9.5%) | 172 (10.4%) |
| 15 to 19 Years | 160 (11.6%) | 128 (7.7%) |
| 20 to 24 Years | 93 (6.8%) | 87 (5.3%) |
| 25 to 29 Years | 63 (4.6%) | 97 (5.9%) |
| 30 to 34 Years | 80 (5.8%) | 126 (7.6%) |
| 35 to 39 Years | 112 (8.1%) | 40 (2.4%) |
| 40 to 44 Years | 79 (5.7%) | 148 (9.0%) |
| 45 to 49 Years | 137 (10.0%) | 107 (6.5%) |
| 50 to 54 Years | 69 (5.0%) | 93 (5.6%) |
| 55 to 59 Years | 80 (5.8%) | 115 (7.0%) |
| 60 to 64 Years | 63 (4.6%) | 87 (5.3%) |
| 65 to 69 Years | 57 (4.1%) | 75 (4.5%) |
| 70 to 74 Years | 37 (2.7%) | 60 (3.6%) |
| 75 to 79 Years | 19 (1.4%) | 43 (2.6%) |
| 80 to 84 Years | 0 (0.0%) | 33 (2.0%) |
| 85 Years and over | 11 (0.8%) | 6 (0.4%) |
| Total | 1,377 (100.0%) | 1,651 (100.0%) |
Families and Households in Smithsburg
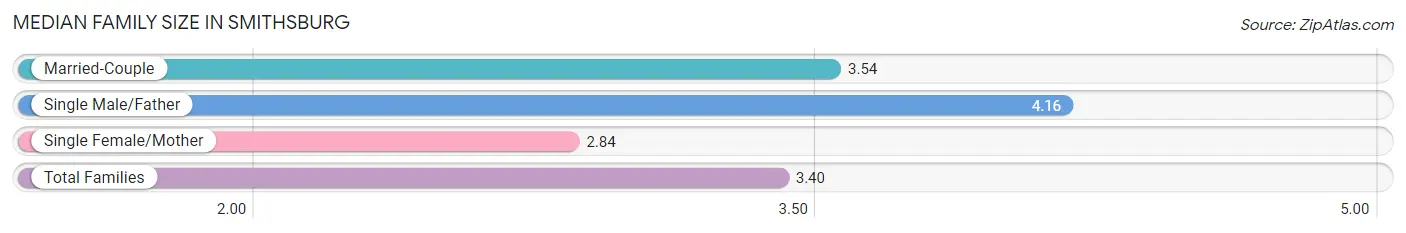
Median Family Size in Smithsburg
The median family size in Smithsburg is 3.40 persons per family, with single male/father families (44 | 5.6%) accounting for the largest median family size of 4.16 persons per family. On the other hand, single female/mother families (199 | 25.5%) represent the smallest median family size with 2.84 persons per family.
| Family Type | # Families | Family Size |
| Married-Couple | 539 (68.9%) | 3.54 |
| Single Male/Father | 44 (5.6%) | 4.16 |
| Single Female/Mother | 199 (25.5%) | 2.84 |
| Total Families | 782 (100.0%) | 3.40 |
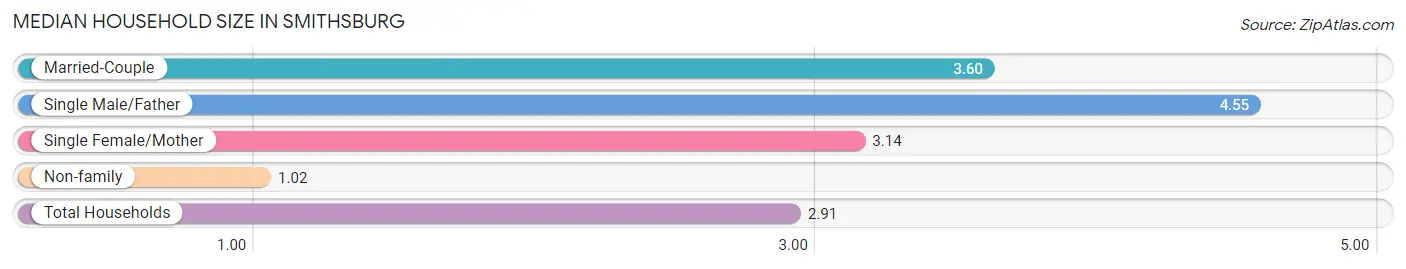
Median Household Size in Smithsburg
The median household size in Smithsburg is 2.91 persons per household, with single male/father households (44 | 4.2%) accounting for the largest median household size of 4.55 persons per household. non-family households (258 | 24.8%) represent the smallest median household size with 1.02 persons per household.
| Household Type | # Households | Household Size |
| Married-Couple | 539 (51.8%) | 3.60 |
| Single Male/Father | 44 (4.2%) | 4.55 |
| Single Female/Mother | 199 (19.1%) | 3.14 |
| Non-family | 258 (24.8%) | 1.02 |
| Total Households | 1,040 (100.0%) | 2.91 |
Household Size by Marriage Status in Smithsburg
Out of a total of 1,040 households in Smithsburg, 782 (75.2%) are family households, while 258 (24.8%) are nonfamily households. The most numerous type of family households are 2-person households, comprising 309, and the most common type of nonfamily households are 1-person households, comprising 250.
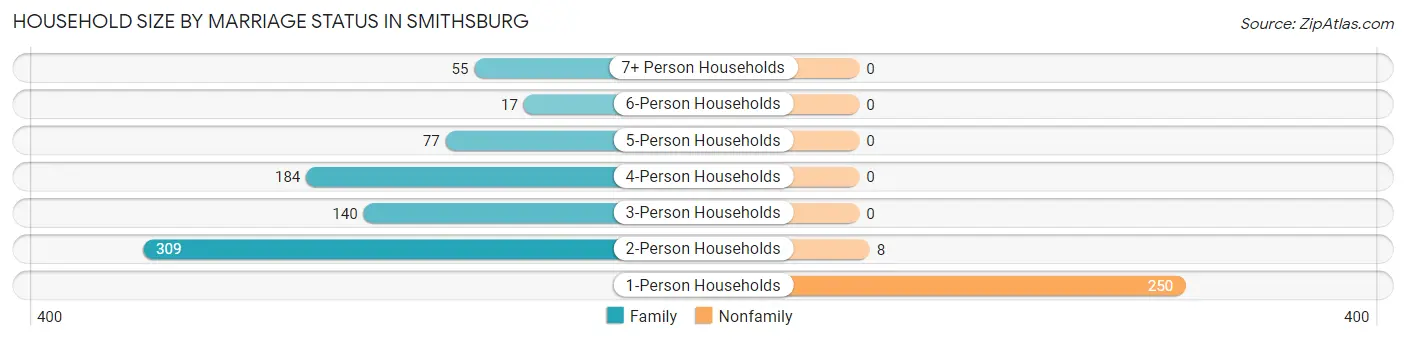
| Household Size | Family Households | Nonfamily Households |
| 1-Person Households | - | 250 (24.0%) |
| 2-Person Households | 309 (29.7%) | 8 (0.8%) |
| 3-Person Households | 140 (13.5%) | 0 (0.0%) |
| 4-Person Households | 184 (17.7%) | 0 (0.0%) |
| 5-Person Households | 77 (7.4%) | 0 (0.0%) |
| 6-Person Households | 17 (1.6%) | 0 (0.0%) |
| 7+ Person Households | 55 (5.3%) | 0 (0.0%) |
| Total | 782 (75.2%) | 258 (24.8%) |
Female Fertility in Smithsburg
Fertility by Age in Smithsburg
Average fertility rate in Smithsburg is 32.0 births per 1,000 women. Women in the age bracket of 35 to 50 years have the highest fertility rate with 53.0 births per 1,000 women. Women in the age bracket of 35 to 50 years acount for 72.0% of all women with births.
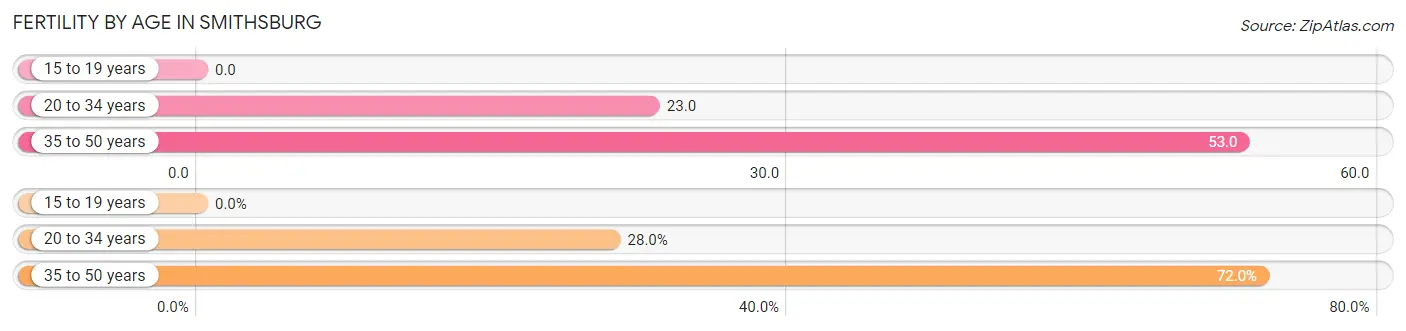
| Age Bracket | Women with Births | Births / 1,000 Women |
| 15 to 19 years | 0 (0.0%) | 0.0 |
| 20 to 34 years | 7 (28.0%) | 23.0 |
| 35 to 50 years | 18 (72.0%) | 53.0 |
| Total | 25 (100.0%) | 32.0 |
Fertility by Age by Marriage Status in Smithsburg
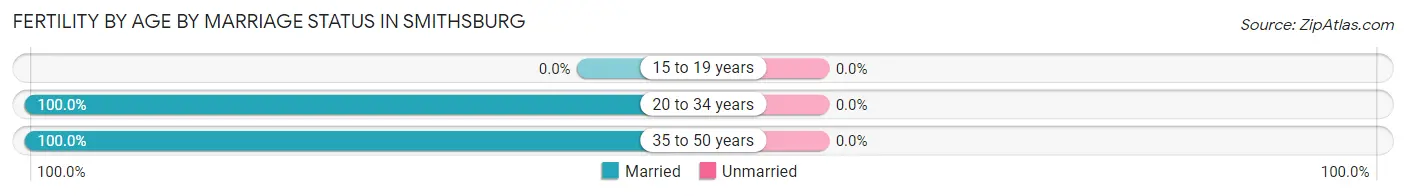
| Age Bracket | Married | Unmarried |
| 15 to 19 years | 0 (0.0%) | 0 (0.0%) |
| 20 to 34 years | 7 (100.0%) | 0 (0.0%) |
| 35 to 50 years | 18 (100.0%) | 0 (0.0%) |
| Total | 25 (100.0%) | 0 (0.0%) |
Fertility by Education in Smithsburg
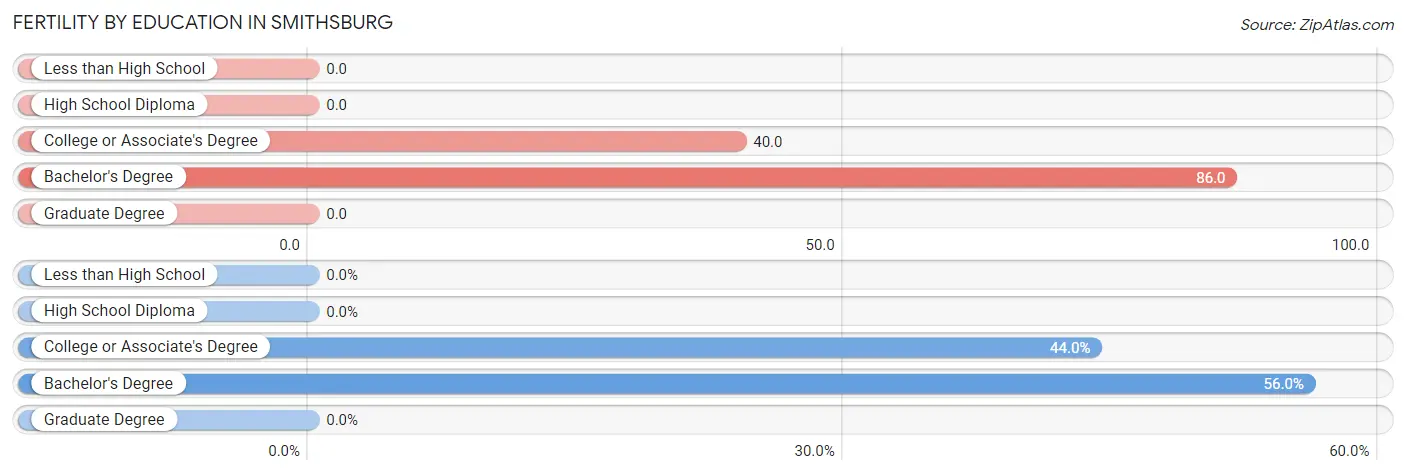
| Educational Attainment | Women with Births | Births / 1,000 Women |
| Less than High School | 0 (0.0%) | 0.0 |
| High School Diploma | 0 (0.0%) | 0.0 |
| College or Associate's Degree | 11 (44.0%) | 40.0 |
| Bachelor's Degree | 14 (56.0%) | 86.0 |
| Graduate Degree | 0 (0.0%) | 0.0 |
| Total | 25 (100.0%) | 32.0 |
Fertility by Education by Marriage Status in Smithsburg
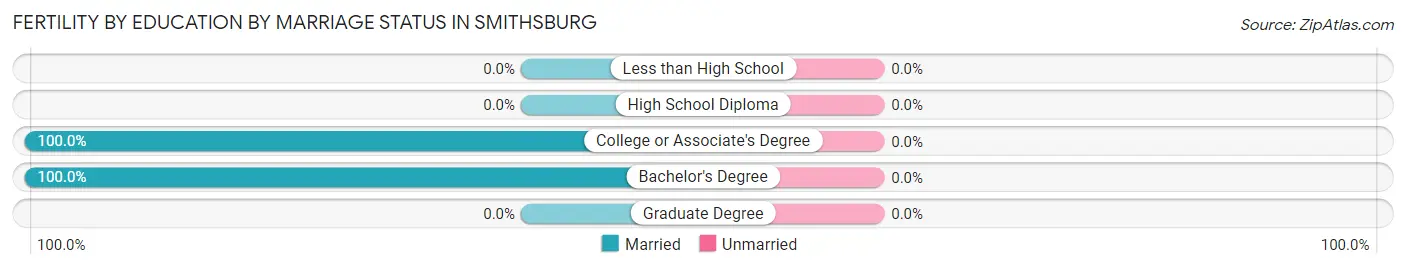
| Educational Attainment | Married | Unmarried |
| Less than High School | 0 (0.0%) | 0 (0.0%) |
| High School Diploma | 0 (0.0%) | 0 (0.0%) |
| College or Associate's Degree | 11 (100.0%) | 0 (0.0%) |
| Bachelor's Degree | 14 (100.0%) | 0 (0.0%) |
| Graduate Degree | 0 (0.0%) | 0 (0.0%) |
| Total | 25 (100.0%) | 0 (0.0%) |
Employment Characteristics in Smithsburg
Employment by Class of Employer in Smithsburg
Among the 1,468 employed individuals in Smithsburg, private company employees (1,042 | 71.0%), local government employees (137 | 9.3%), and not-for-profit organizations (85 | 5.8%) make up the most common classes of employment.
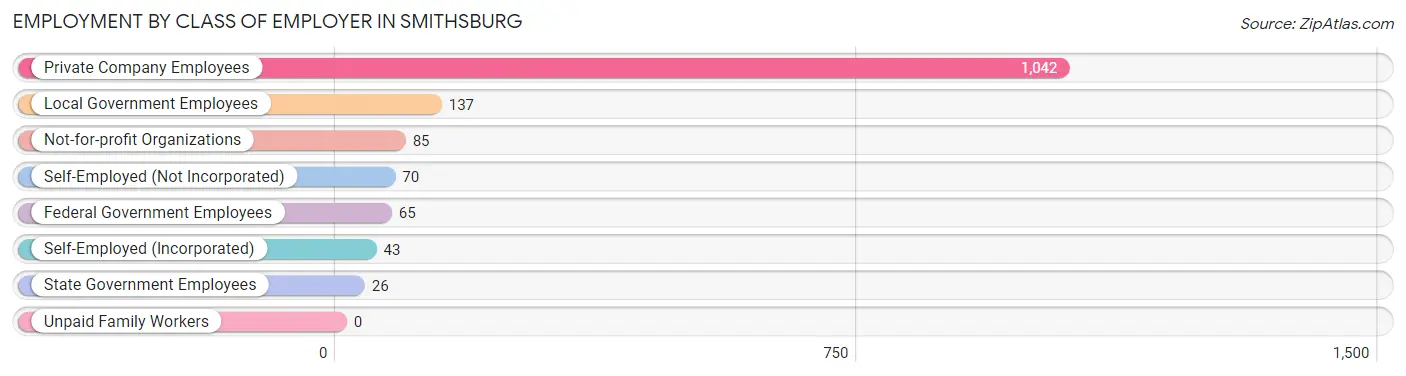
| Employer Class | # Employees | % Employees |
| Private Company Employees | 1,042 | 71.0% |
| Self-Employed (Incorporated) | 43 | 2.9% |
| Self-Employed (Not Incorporated) | 70 | 4.8% |
| Not-for-profit Organizations | 85 | 5.8% |
| Local Government Employees | 137 | 9.3% |
| State Government Employees | 26 | 1.8% |
| Federal Government Employees | 65 | 4.4% |
| Unpaid Family Workers | 0 | 0.0% |
| Total | 1,468 | 100.0% |
Employment Status by Age in Smithsburg
According to the labor force statistics for Smithsburg, out of the total population over 16 years of age (2,207), 70.2% or 1,549 individuals are in the labor force, with 3.4% or 53 of them unemployed. The age group with the highest labor force participation rate is 25 to 29 years, with 94.4% or 151 individuals in the labor force. Within the labor force, the 16 to 19 years age range has the highest percentage of unemployed individuals, with 30.9% or 29 of them being unemployed.
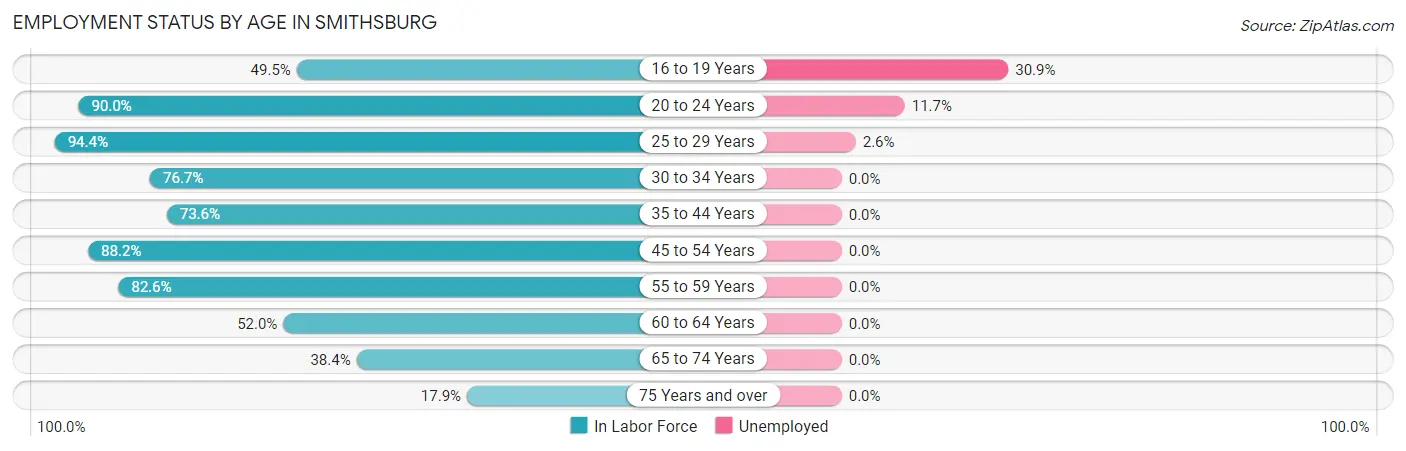
| Age Bracket | In Labor Force | Unemployed |
| 16 to 19 Years | 94 (49.5%) | 29 (30.9%) |
| 20 to 24 Years | 162 (90.0%) | 19 (11.7%) |
| 25 to 29 Years | 151 (94.4%) | 4 (2.6%) |
| 30 to 34 Years | 158 (76.7%) | 0 (0.0%) |
| 35 to 44 Years | 279 (73.6%) | 0 (0.0%) |
| 45 to 54 Years | 358 (88.2%) | 0 (0.0%) |
| 55 to 59 Years | 161 (82.6%) | 0 (0.0%) |
| 60 to 64 Years | 78 (52.0%) | 0 (0.0%) |
| 65 to 74 Years | 88 (38.4%) | 0 (0.0%) |
| 75 Years and over | 20 (17.9%) | 0 (0.0%) |
| Total | 1,549 (70.2%) | 53 (3.4%) |
Employment Status by Educational Attainment in Smithsburg
According to labor force statistics for Smithsburg, 79.2% of individuals (1,185) out of the total population between 25 and 64 years of age (1,496) are in the labor force, with 0.3% or 4 of them being unemployed. The group with the highest labor force participation rate are those with the educational attainment of bachelor's degree or higher, with 90.3% or 355 individuals in the labor force. Within the labor force, individuals with college / associate degree education have the highest percentage of unemployment, with 0.9% or 4 of them being unemployed.
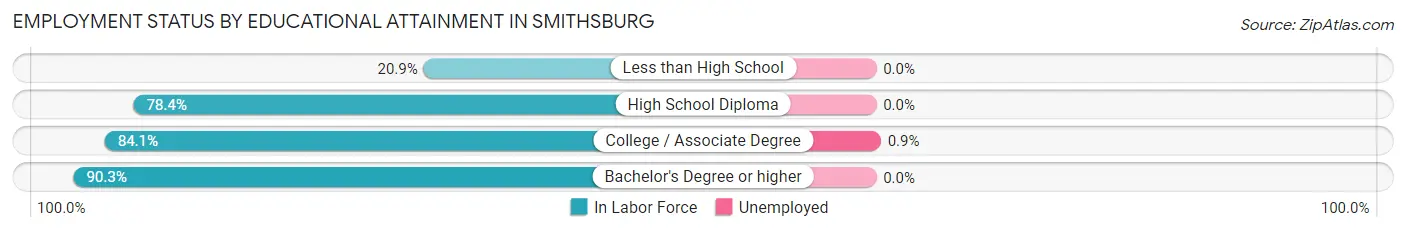
| Educational Attainment | In Labor Force | Unemployed |
| Less than High School | 24 (20.9%) | 0 (0.0%) |
| High School Diploma | 345 (78.4%) | 0 (0.0%) |
| College / Associate Degree | 461 (84.1%) | 5 (0.9%) |
| Bachelor's Degree or higher | 355 (90.3%) | 0 (0.0%) |
| Total | 1,185 (79.2%) | 4 (0.3%) |
Employment Occupations by Sex in Smithsburg
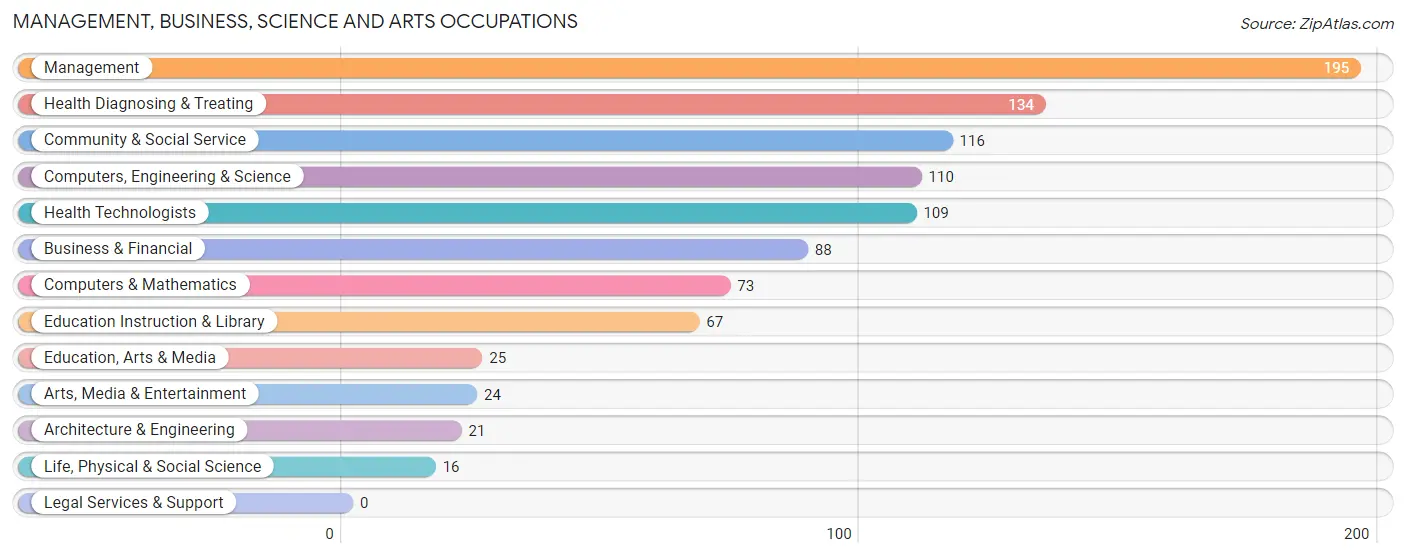
Management, Business, Science and Arts Occupations
The most common Management, Business, Science and Arts occupations in Smithsburg are Management (195 | 13.0%), Health Diagnosing & Treating (134 | 9.0%), Community & Social Service (116 | 7.7%), Computers, Engineering & Science (110 | 7.3%), and Health Technologists (109 | 7.3%).
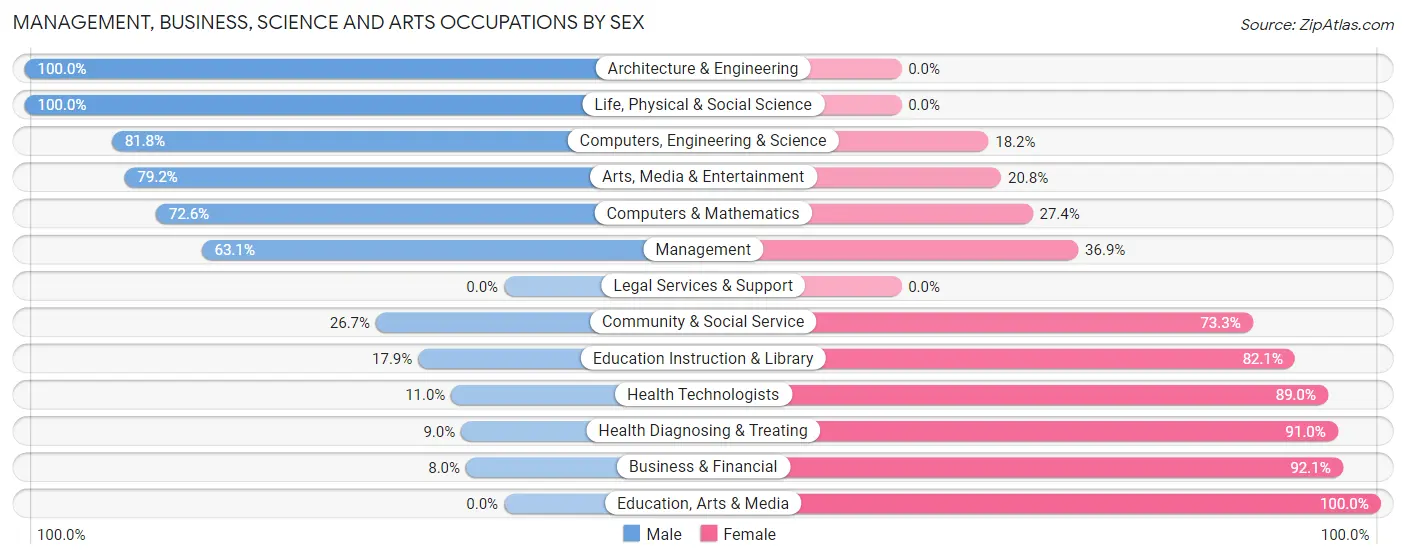
Management, Business, Science and Arts Occupations by Sex
Within the Management, Business, Science and Arts occupations in Smithsburg, the most male-oriented occupations are Architecture & Engineering (100.0%), Life, Physical & Social Science (100.0%), and Computers, Engineering & Science (81.8%), while the most female-oriented occupations are Education, Arts & Media (100.0%), Business & Financial (92.0%), and Health Diagnosing & Treating (91.0%).
| Occupation | Male | Female |
| Management | 123 (63.1%) | 72 (36.9%) |
| Business & Financial | 7 (8.0%) | 81 (92.0%) |
| Computers, Engineering & Science | 90 (81.8%) | 20 (18.2%) |
| Computers & Mathematics | 53 (72.6%) | 20 (27.4%) |
| Architecture & Engineering | 21 (100.0%) | 0 (0.0%) |
| Life, Physical & Social Science | 16 (100.0%) | 0 (0.0%) |
| Community & Social Service | 31 (26.7%) | 85 (73.3%) |
| Education, Arts & Media | 0 (0.0%) | 25 (100.0%) |
| Legal Services & Support | 0 (0.0%) | 0 (0.0%) |
| Education Instruction & Library | 12 (17.9%) | 55 (82.1%) |
| Arts, Media & Entertainment | 19 (79.2%) | 5 (20.8%) |
| Health Diagnosing & Treating | 12 (9.0%) | 122 (91.0%) |
| Health Technologists | 12 (11.0%) | 97 (89.0%) |
| Total (Category) | 263 (40.9%) | 380 (59.1%) |
| Total (Overall) | 708 (47.3%) | 788 (52.7%) |
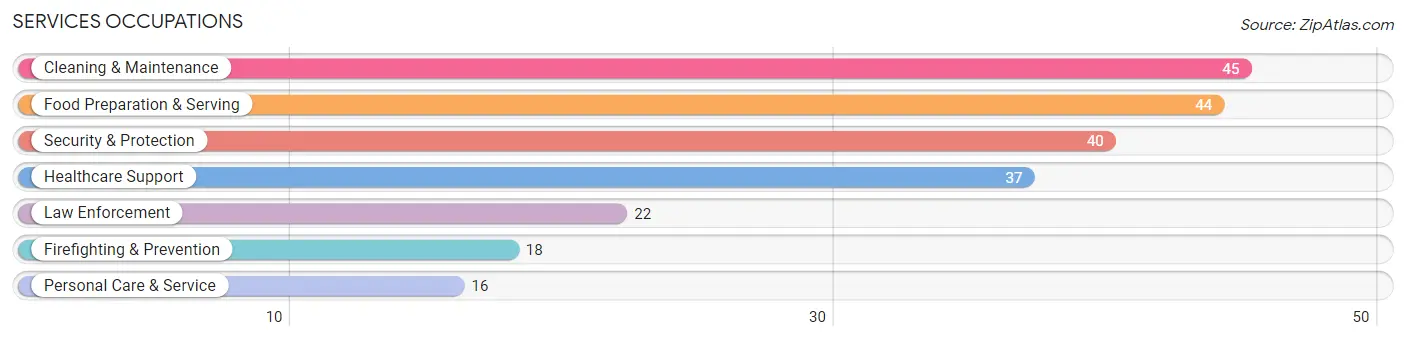
Services Occupations
The most common Services occupations in Smithsburg are Cleaning & Maintenance (45 | 3.0%), Food Preparation & Serving (44 | 2.9%), Security & Protection (40 | 2.7%), Healthcare Support (37 | 2.5%), and Law Enforcement (22 | 1.5%).
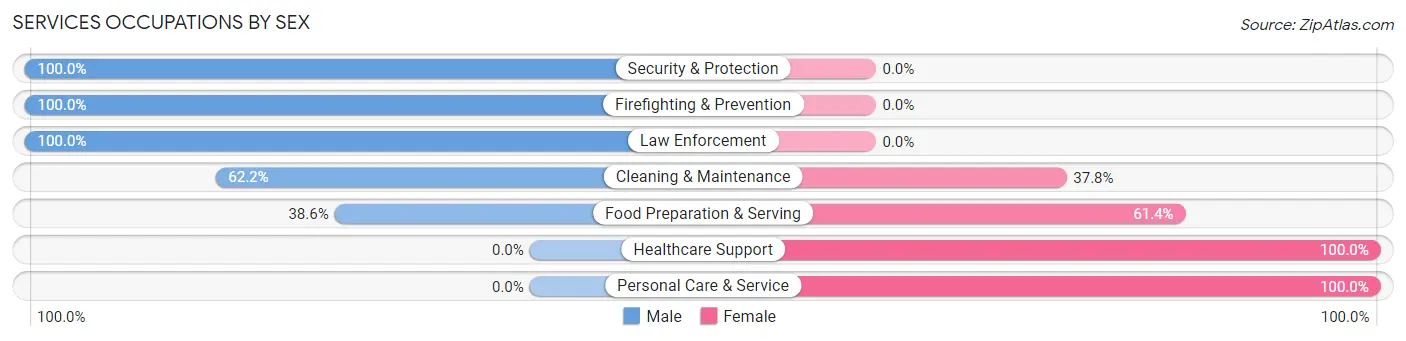
Services Occupations by Sex
Within the Services occupations in Smithsburg, the most male-oriented occupations are Security & Protection (100.0%), Firefighting & Prevention (100.0%), and Law Enforcement (100.0%), while the most female-oriented occupations are Healthcare Support (100.0%), Personal Care & Service (100.0%), and Food Preparation & Serving (61.4%).
| Occupation | Male | Female |
| Healthcare Support | 0 (0.0%) | 37 (100.0%) |
| Security & Protection | 40 (100.0%) | 0 (0.0%) |
| Firefighting & Prevention | 18 (100.0%) | 0 (0.0%) |
| Law Enforcement | 22 (100.0%) | 0 (0.0%) |
| Food Preparation & Serving | 17 (38.6%) | 27 (61.4%) |
| Cleaning & Maintenance | 28 (62.2%) | 17 (37.8%) |
| Personal Care & Service | 0 (0.0%) | 16 (100.0%) |
| Total (Category) | 85 (46.7%) | 97 (53.3%) |
| Total (Overall) | 708 (47.3%) | 788 (52.7%) |
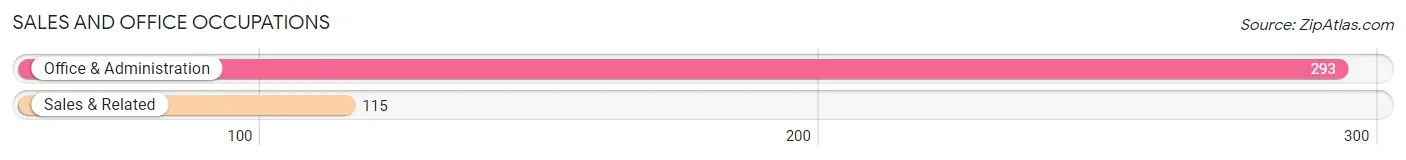
Sales and Office Occupations
The most common Sales and Office occupations in Smithsburg are Office & Administration (293 | 19.6%), and Sales & Related (115 | 7.7%).
Sales and Office Occupations by Sex
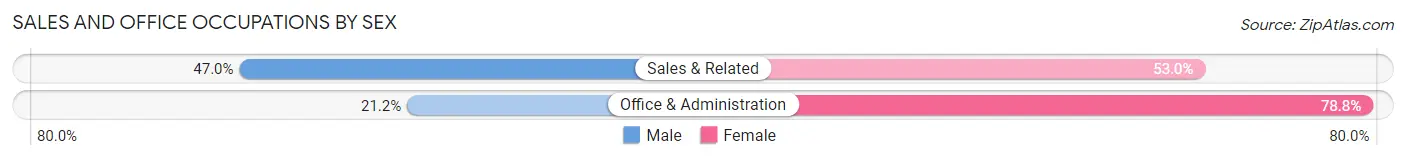
| Occupation | Male | Female |
| Sales & Related | 54 (47.0%) | 61 (53.0%) |
| Office & Administration | 62 (21.2%) | 231 (78.8%) |
| Total (Category) | 116 (28.4%) | 292 (71.6%) |
| Total (Overall) | 708 (47.3%) | 788 (52.7%) |
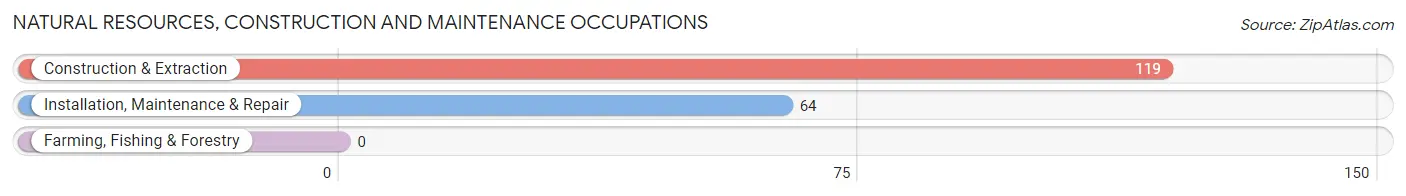
Natural Resources, Construction and Maintenance Occupations
The most common Natural Resources, Construction and Maintenance occupations in Smithsburg are Construction & Extraction (119 | 8.0%), and Installation, Maintenance & Repair (64 | 4.3%).
Natural Resources, Construction and Maintenance Occupations by Sex
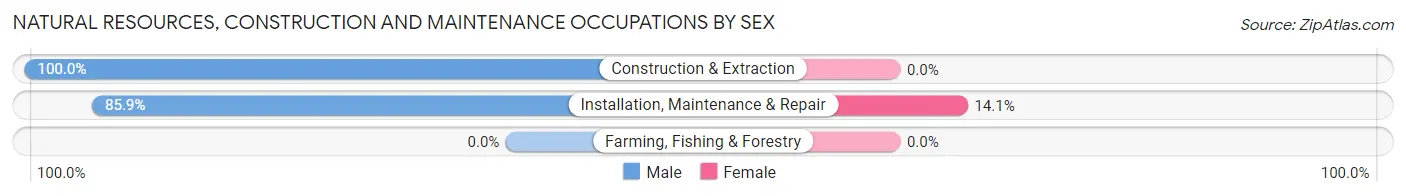
| Occupation | Male | Female |
| Farming, Fishing & Forestry | 0 (0.0%) | 0 (0.0%) |
| Construction & Extraction | 119 (100.0%) | 0 (0.0%) |
| Installation, Maintenance & Repair | 55 (85.9%) | 9 (14.1%) |
| Total (Category) | 174 (95.1%) | 9 (4.9%) |
| Total (Overall) | 708 (47.3%) | 788 (52.7%) |
Production, Transportation and Moving Occupations
The most common Production, Transportation and Moving occupations in Smithsburg are Material Moving (38 | 2.5%), Transportation (25 | 1.7%), and Production (17 | 1.1%).
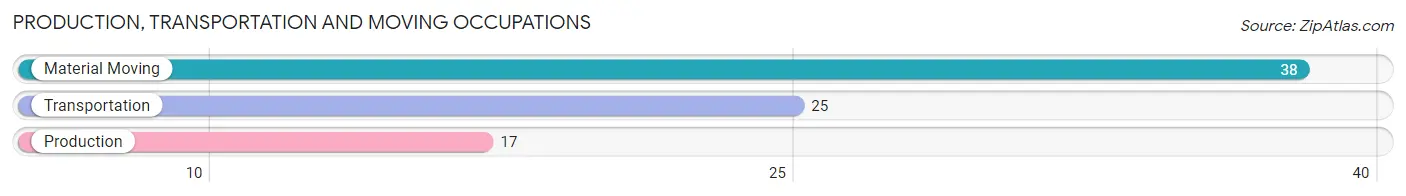
Production, Transportation and Moving Occupations by Sex
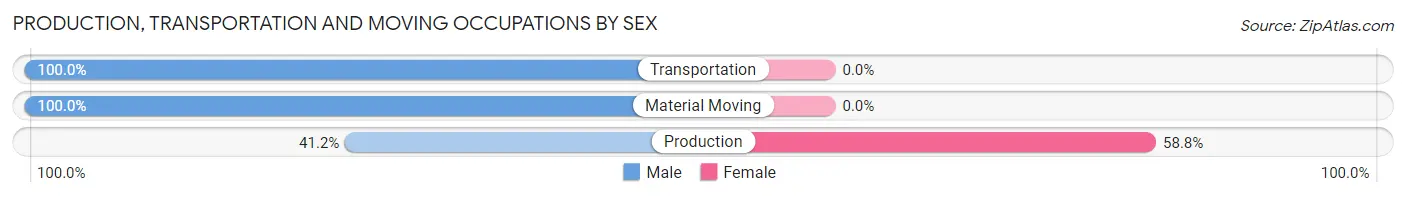
| Occupation | Male | Female |
| Production | 7 (41.2%) | 10 (58.8%) |
| Transportation | 25 (100.0%) | 0 (0.0%) |
| Material Moving | 38 (100.0%) | 0 (0.0%) |
| Total (Category) | 70 (87.5%) | 10 (12.5%) |
| Total (Overall) | 708 (47.3%) | 788 (52.7%) |
Employment Industries by Sex in Smithsburg
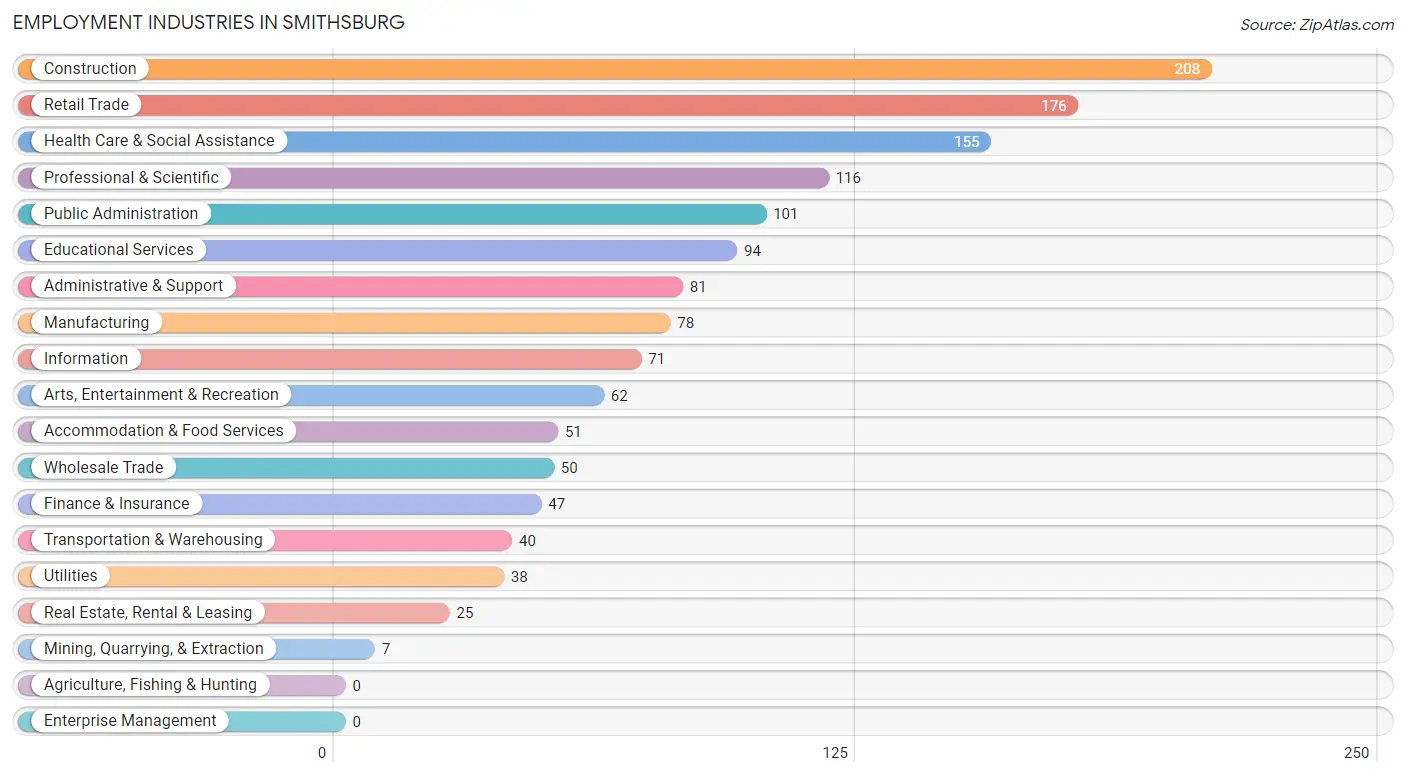
Employment Industries in Smithsburg
The major employment industries in Smithsburg include Construction (208 | 13.9%), Retail Trade (176 | 11.8%), Health Care & Social Assistance (155 | 10.4%), Professional & Scientific (116 | 7.7%), and Public Administration (101 | 6.8%).
Employment Industries by Sex in Smithsburg
The Smithsburg industries that see more men than women are Mining, Quarrying, & Extraction (100.0%), Utilities (100.0%), and Wholesale Trade (84.0%), whereas the industries that tend to have a higher number of women are Health Care & Social Assistance (97.4%), Finance & Insurance (87.2%), and Educational Services (87.2%).
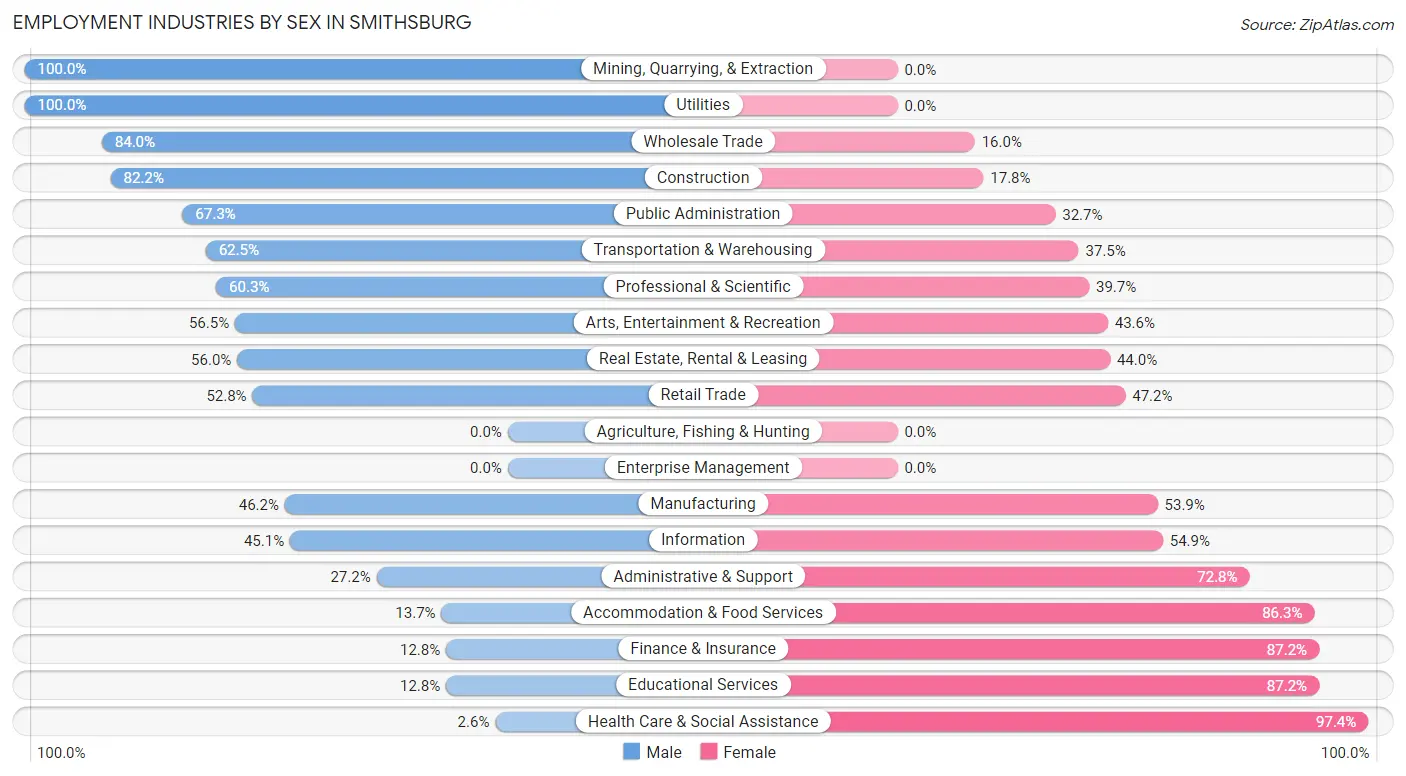
| Industry | Male | Female |
| Agriculture, Fishing & Hunting | 0 (0.0%) | 0 (0.0%) |
| Mining, Quarrying, & Extraction | 7 (100.0%) | 0 (0.0%) |
| Construction | 171 (82.2%) | 37 (17.8%) |
| Manufacturing | 36 (46.2%) | 42 (53.8%) |
| Wholesale Trade | 42 (84.0%) | 8 (16.0%) |
| Retail Trade | 93 (52.8%) | 83 (47.2%) |
| Transportation & Warehousing | 25 (62.5%) | 15 (37.5%) |
| Utilities | 38 (100.0%) | 0 (0.0%) |
| Information | 32 (45.1%) | 39 (54.9%) |
| Finance & Insurance | 6 (12.8%) | 41 (87.2%) |
| Real Estate, Rental & Leasing | 14 (56.0%) | 11 (44.0%) |
| Professional & Scientific | 70 (60.3%) | 46 (39.7%) |
| Enterprise Management | 0 (0.0%) | 0 (0.0%) |
| Administrative & Support | 22 (27.2%) | 59 (72.8%) |
| Educational Services | 12 (12.8%) | 82 (87.2%) |
| Health Care & Social Assistance | 4 (2.6%) | 151 (97.4%) |
| Arts, Entertainment & Recreation | 35 (56.5%) | 27 (43.5%) |
| Accommodation & Food Services | 7 (13.7%) | 44 (86.3%) |
| Public Administration | 68 (67.3%) | 33 (32.7%) |
| Total | 708 (47.3%) | 788 (52.7%) |
Education in Smithsburg
School Enrollment in Smithsburg
The most common levels of schooling among the 910 students in Smithsburg are high school (259 | 28.5%), middle school (257 | 28.2%), and elementary school (211 | 23.2%).
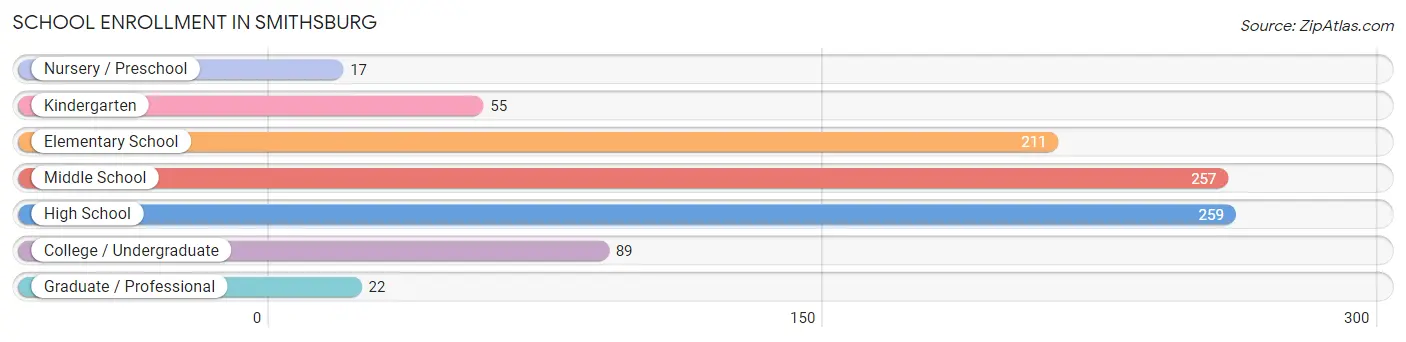
| School Level | # Students | % Students |
| Nursery / Preschool | 17 | 1.9% |
| Kindergarten | 55 | 6.0% |
| Elementary School | 211 | 23.2% |
| Middle School | 257 | 28.2% |
| High School | 259 | 28.5% |
| College / Undergraduate | 89 | 9.8% |
| Graduate / Professional | 22 | 2.4% |
| Total | 910 | 100.0% |
School Enrollment by Age by Funding Source in Smithsburg
Out of a total of 910 students who are enrolled in schools in Smithsburg, 171 (18.8%) attend a private institution, while the remaining 739 (81.2%) are enrolled in public schools. The age group of 20 to 24 year olds has the highest likelihood of being enrolled in private schools, with 17 (73.9% in the age bracket) enrolled. Conversely, the age group of 3 to 4 year olds has the lowest likelihood of being enrolled in a private school, with 17 (100.0% in the age bracket) attending a public institution.
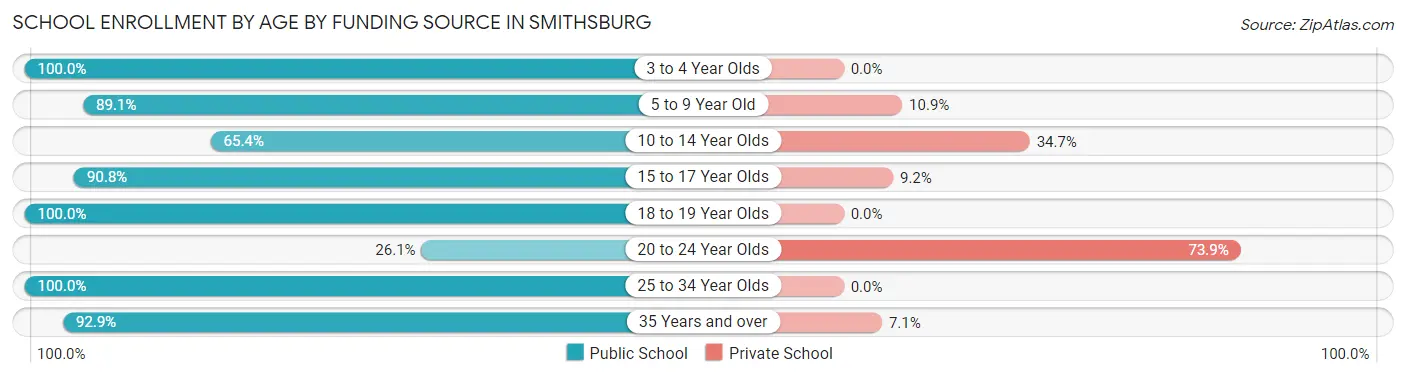
| Age Bracket | Public School | Private School |
| 3 to 4 Year Olds | 17 (100.0%) | 0 (0.0%) |
| 5 to 9 Year Old | 229 (89.1%) | 28 (10.9%) |
| 10 to 14 Year Olds | 198 (65.3%) | 105 (34.6%) |
| 15 to 17 Year Olds | 168 (90.8%) | 17 (9.2%) |
| 18 to 19 Year Olds | 57 (100.0%) | 0 (0.0%) |
| 20 to 24 Year Olds | 6 (26.1%) | 17 (73.9%) |
| 25 to 34 Year Olds | 12 (100.0%) | 0 (0.0%) |
| 35 Years and over | 52 (92.9%) | 4 (7.1%) |
| Total | 739 (81.2%) | 171 (18.8%) |
Educational Attainment by Field of Study in Smithsburg
Business (141 | 29.6%), bio, nature & agricultural (60 | 12.6%), education (50 | 10.5%), literature & languages (36 | 7.6%), and arts & humanities (35 | 7.3%) are the most common fields of study among 476 individuals in Smithsburg who have obtained a bachelor's degree or higher.
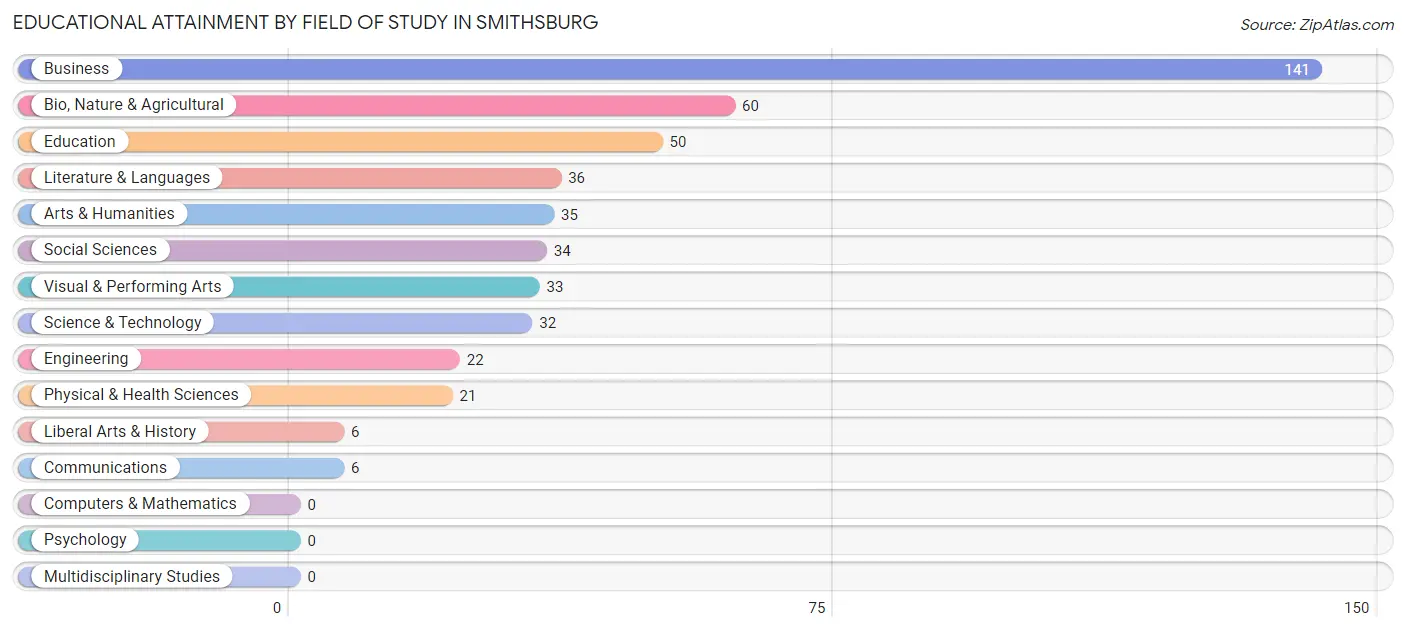
| Field of Study | # Graduates | % Graduates |
| Computers & Mathematics | 0 | 0.0% |
| Bio, Nature & Agricultural | 60 | 12.6% |
| Physical & Health Sciences | 21 | 4.4% |
| Psychology | 0 | 0.0% |
| Social Sciences | 34 | 7.1% |
| Engineering | 22 | 4.6% |
| Multidisciplinary Studies | 0 | 0.0% |
| Science & Technology | 32 | 6.7% |
| Business | 141 | 29.6% |
| Education | 50 | 10.5% |
| Literature & Languages | 36 | 7.6% |
| Liberal Arts & History | 6 | 1.3% |
| Visual & Performing Arts | 33 | 6.9% |
| Communications | 6 | 1.3% |
| Arts & Humanities | 35 | 7.3% |
| Total | 476 | 100.0% |
Transportation & Commute in Smithsburg
Vehicle Availability by Sex in Smithsburg
The most prevalent vehicle ownership categories in Smithsburg are males with 2 vehicles (325, accounting for 46.6%) and females with 2 vehicles (287, making up 42.2%).
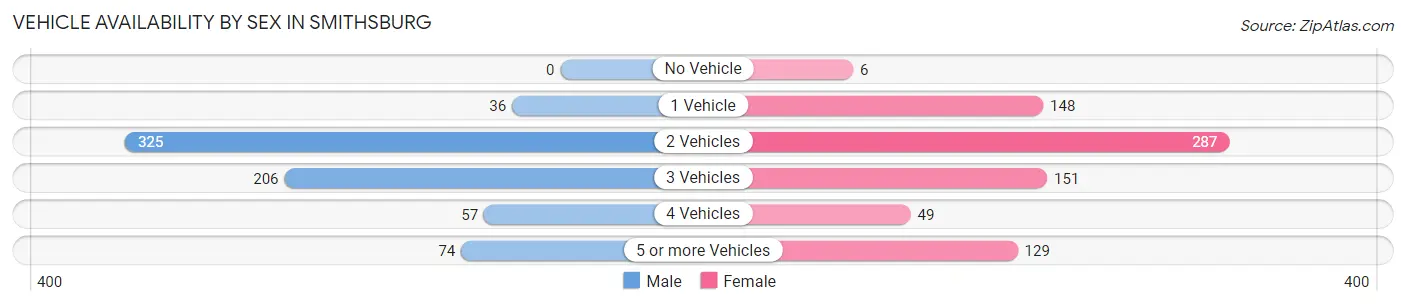
| Vehicles Available | Male | Female |
| No Vehicle | 0 (0.0%) | 6 (0.8%) |
| 1 Vehicle | 36 (5.2%) | 148 (19.2%) |
| 2 Vehicles | 325 (46.6%) | 287 (37.3%) |
| 3 Vehicles | 206 (29.5%) | 151 (19.6%) |
| 4 Vehicles | 57 (8.2%) | 49 (6.4%) |
| 5 or more Vehicles | 74 (10.6%) | 129 (16.8%) |
| Total | 698 (100.0%) | 770 (100.0%) |
Commute Time in Smithsburg
The most frequently occuring commute durations in Smithsburg are 20 to 24 minutes (255 commuters, 18.6%), 30 to 34 minutes (184 commuters, 13.5%), and 60 to 89 minutes (181 commuters, 13.2%).
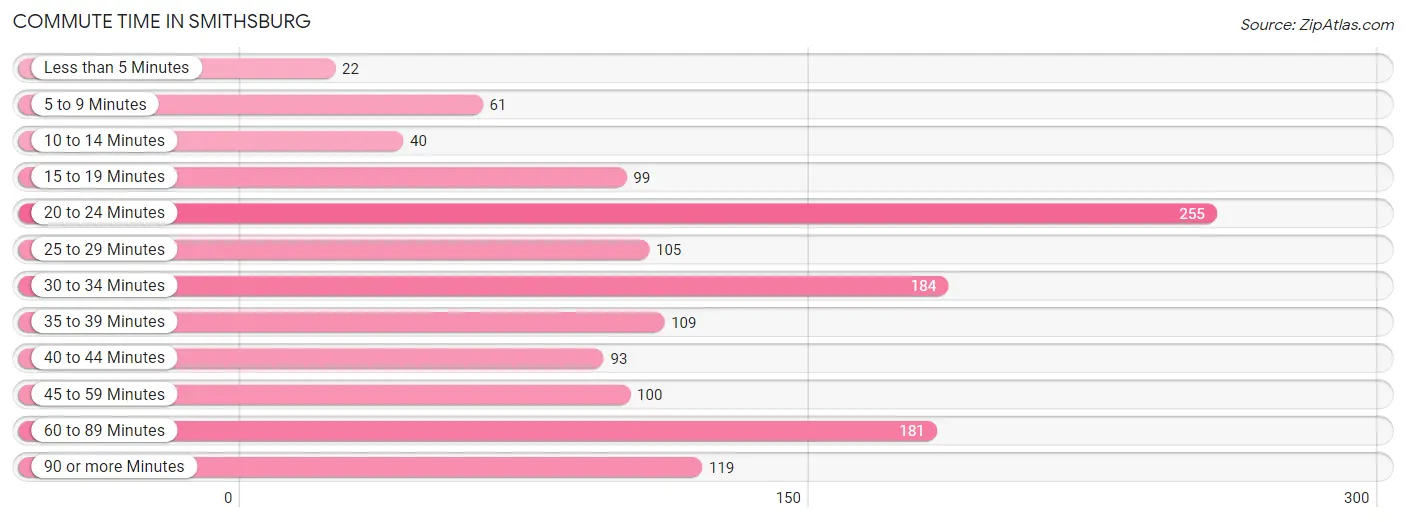
| Commute Time | # Commuters | % Commuters |
| Less than 5 Minutes | 22 | 1.6% |
| 5 to 9 Minutes | 61 | 4.5% |
| 10 to 14 Minutes | 40 | 2.9% |
| 15 to 19 Minutes | 99 | 7.2% |
| 20 to 24 Minutes | 255 | 18.6% |
| 25 to 29 Minutes | 105 | 7.7% |
| 30 to 34 Minutes | 184 | 13.5% |
| 35 to 39 Minutes | 109 | 8.0% |
| 40 to 44 Minutes | 93 | 6.8% |
| 45 to 59 Minutes | 100 | 7.3% |
| 60 to 89 Minutes | 181 | 13.2% |
| 90 or more Minutes | 119 | 8.7% |
Commute Time by Sex in Smithsburg
The most common commute times in Smithsburg are 60 to 89 minutes (147 commuters, 22.4%) for males and 20 to 24 minutes (194 commuters, 27.3%) for females.
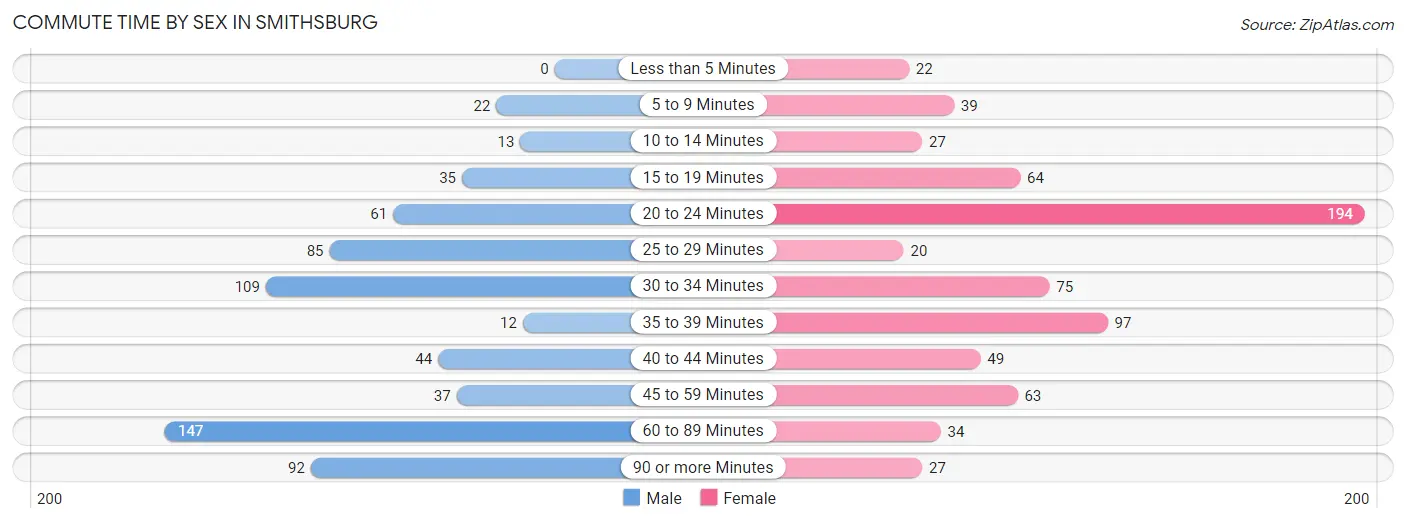
| Commute Time | Male | Female |
| Less than 5 Minutes | 0 (0.0%) | 22 (3.1%) |
| 5 to 9 Minutes | 22 (3.4%) | 39 (5.5%) |
| 10 to 14 Minutes | 13 (2.0%) | 27 (3.8%) |
| 15 to 19 Minutes | 35 (5.3%) | 64 (9.0%) |
| 20 to 24 Minutes | 61 (9.3%) | 194 (27.3%) |
| 25 to 29 Minutes | 85 (12.9%) | 20 (2.8%) |
| 30 to 34 Minutes | 109 (16.6%) | 75 (10.5%) |
| 35 to 39 Minutes | 12 (1.8%) | 97 (13.6%) |
| 40 to 44 Minutes | 44 (6.7%) | 49 (6.9%) |
| 45 to 59 Minutes | 37 (5.6%) | 63 (8.9%) |
| 60 to 89 Minutes | 147 (22.4%) | 34 (4.8%) |
| 90 or more Minutes | 92 (14.0%) | 27 (3.8%) |
Time of Departure to Work by Sex in Smithsburg
The most frequent times of departure to work in Smithsburg are 7:00 AM to 7:29 AM (158, 24.0%) for males and 8:00 AM to 8:29 AM (123, 17.3%) for females.
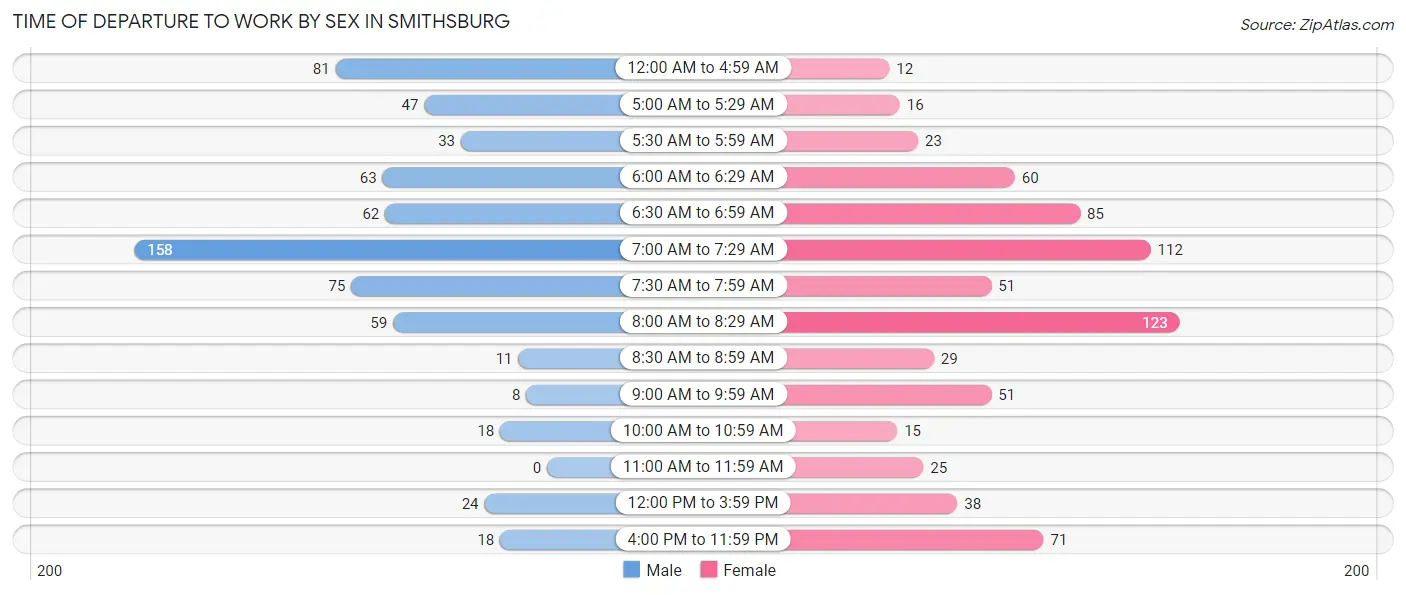
| Time of Departure | Male | Female |
| 12:00 AM to 4:59 AM | 81 (12.3%) | 12 (1.7%) |
| 5:00 AM to 5:29 AM | 47 (7.1%) | 16 (2.2%) |
| 5:30 AM to 5:59 AM | 33 (5.0%) | 23 (3.2%) |
| 6:00 AM to 6:29 AM | 63 (9.6%) | 60 (8.4%) |
| 6:30 AM to 6:59 AM | 62 (9.4%) | 85 (11.9%) |
| 7:00 AM to 7:29 AM | 158 (24.0%) | 112 (15.8%) |
| 7:30 AM to 7:59 AM | 75 (11.4%) | 51 (7.2%) |
| 8:00 AM to 8:29 AM | 59 (9.0%) | 123 (17.3%) |
| 8:30 AM to 8:59 AM | 11 (1.7%) | 29 (4.1%) |
| 9:00 AM to 9:59 AM | 8 (1.2%) | 51 (7.2%) |
| 10:00 AM to 10:59 AM | 18 (2.7%) | 15 (2.1%) |
| 11:00 AM to 11:59 AM | 0 (0.0%) | 25 (3.5%) |
| 12:00 PM to 3:59 PM | 24 (3.6%) | 38 (5.3%) |
| 4:00 PM to 11:59 PM | 18 (2.7%) | 71 (10.0%) |
| Total | 657 (100.0%) | 711 (100.0%) |
Housing Occupancy in Smithsburg
Occupancy by Ownership in Smithsburg
Of the total 1,040 dwellings in Smithsburg, owner-occupied units account for 757 (72.8%), while renter-occupied units make up 283 (27.2%).
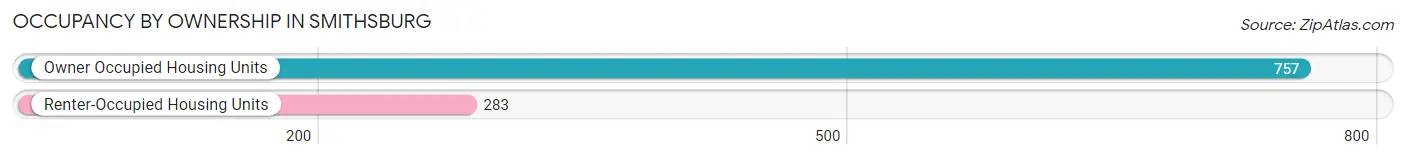
| Occupancy | # Housing Units | % Housing Units |
| Owner Occupied Housing Units | 757 | 72.8% |
| Renter-Occupied Housing Units | 283 | 27.2% |
| Total Occupied Housing Units | 1,040 | 100.0% |
Occupancy by Household Size in Smithsburg
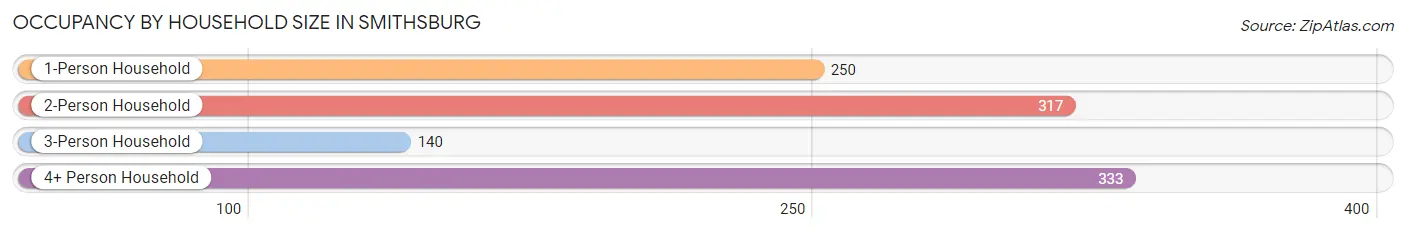
| Household Size | # Housing Units | % Housing Units |
| 1-Person Household | 250 | 24.0% |
| 2-Person Household | 317 | 30.5% |
| 3-Person Household | 140 | 13.5% |
| 4+ Person Household | 333 | 32.0% |
| Total Housing Units | 1,040 | 100.0% |
Occupancy by Ownership by Household Size in Smithsburg
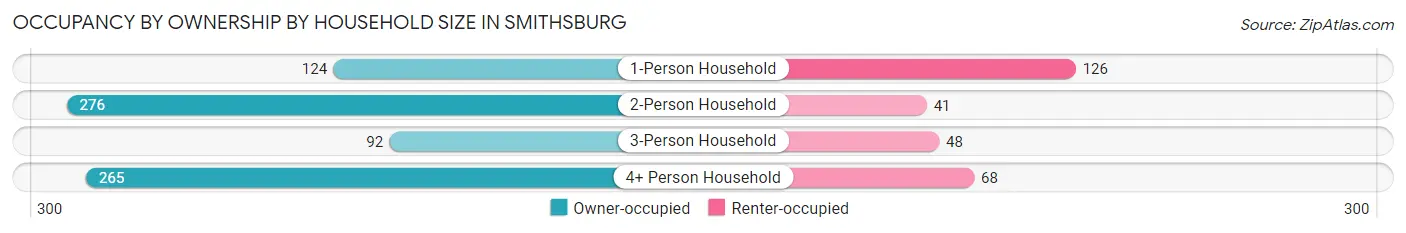
| Household Size | Owner-occupied | Renter-occupied |
| 1-Person Household | 124 (49.6%) | 126 (50.4%) |
| 2-Person Household | 276 (87.1%) | 41 (12.9%) |
| 3-Person Household | 92 (65.7%) | 48 (34.3%) |
| 4+ Person Household | 265 (79.6%) | 68 (20.4%) |
| Total Housing Units | 757 (72.8%) | 283 (27.2%) |
Occupancy by Educational Attainment in Smithsburg
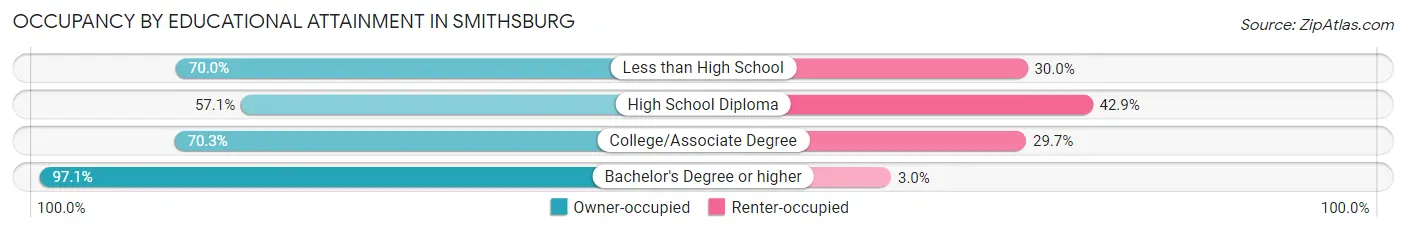
| Household Size | Owner-occupied | Renter-occupied |
| Less than High School | 21 (70.0%) | 9 (30.0%) |
| High School Diploma | 201 (57.1%) | 151 (42.9%) |
| College/Associate Degree | 272 (70.3%) | 115 (29.7%) |
| Bachelor's Degree or higher | 263 (97.1%) | 8 (2.9%) |
Occupancy by Age of Householder in Smithsburg
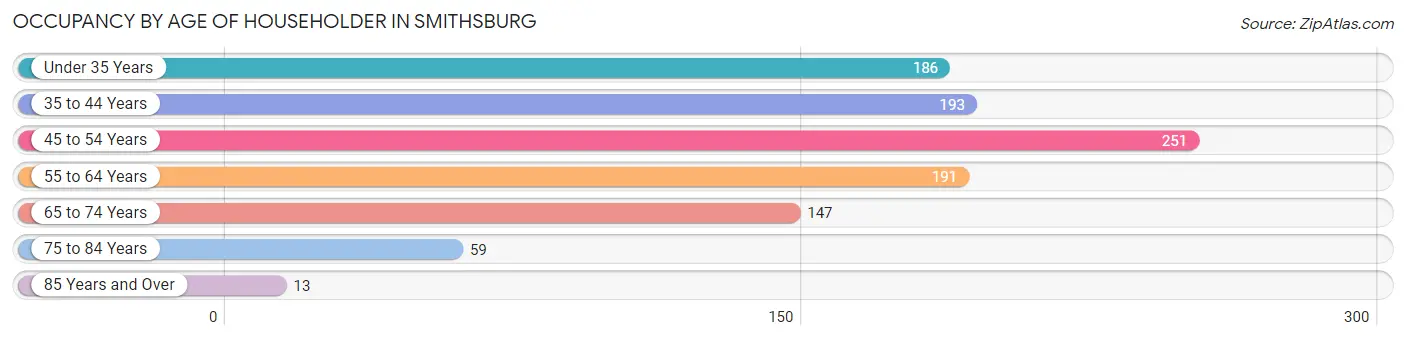
| Age Bracket | # Households | % Households |
| Under 35 Years | 186 | 17.9% |
| 35 to 44 Years | 193 | 18.6% |
| 45 to 54 Years | 251 | 24.1% |
| 55 to 64 Years | 191 | 18.4% |
| 65 to 74 Years | 147 | 14.1% |
| 75 to 84 Years | 59 | 5.7% |
| 85 Years and Over | 13 | 1.3% |
| Total | 1,040 | 100.0% |
Housing Finances in Smithsburg
Median Income by Occupancy in Smithsburg
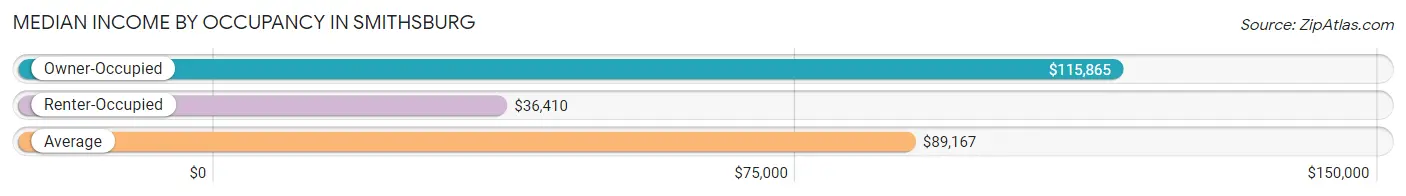
| Occupancy Type | # Households | Median Income |
| Owner-Occupied | 757 (72.8%) | $115,865 |
| Renter-Occupied | 283 (27.2%) | $36,410 |
| Average | 1,040 (100.0%) | $89,167 |
Occupancy by Householder Income Bracket in Smithsburg
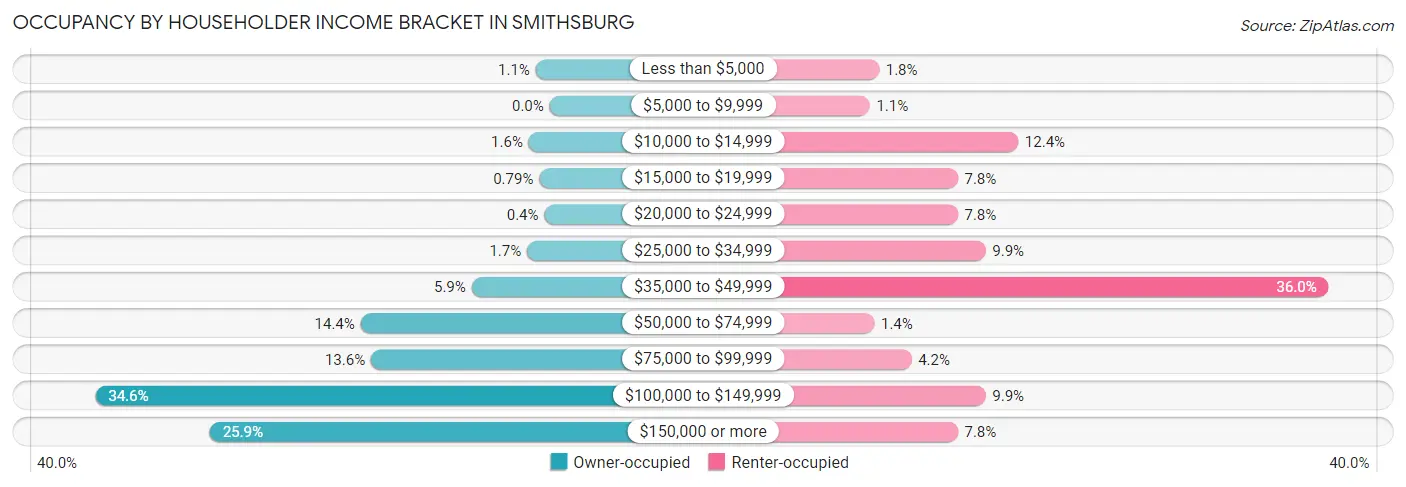
| Income Bracket | Owner-occupied | Renter-occupied |
| Less than $5,000 | 8 (1.1%) | 5 (1.8%) |
| $5,000 to $9,999 | 0 (0.0%) | 3 (1.1%) |
| $10,000 to $14,999 | 12 (1.6%) | 35 (12.4%) |
| $15,000 to $19,999 | 6 (0.8%) | 22 (7.8%) |
| $20,000 to $24,999 | 3 (0.4%) | 22 (7.8%) |
| $25,000 to $34,999 | 13 (1.7%) | 28 (9.9%) |
| $35,000 to $49,999 | 45 (5.9%) | 102 (36.0%) |
| $50,000 to $74,999 | 109 (14.4%) | 4 (1.4%) |
| $75,000 to $99,999 | 103 (13.6%) | 12 (4.2%) |
| $100,000 to $149,999 | 262 (34.6%) | 28 (9.9%) |
| $150,000 or more | 196 (25.9%) | 22 (7.8%) |
| Total | 757 (100.0%) | 283 (100.0%) |
Monthly Housing Cost Tiers in Smithsburg
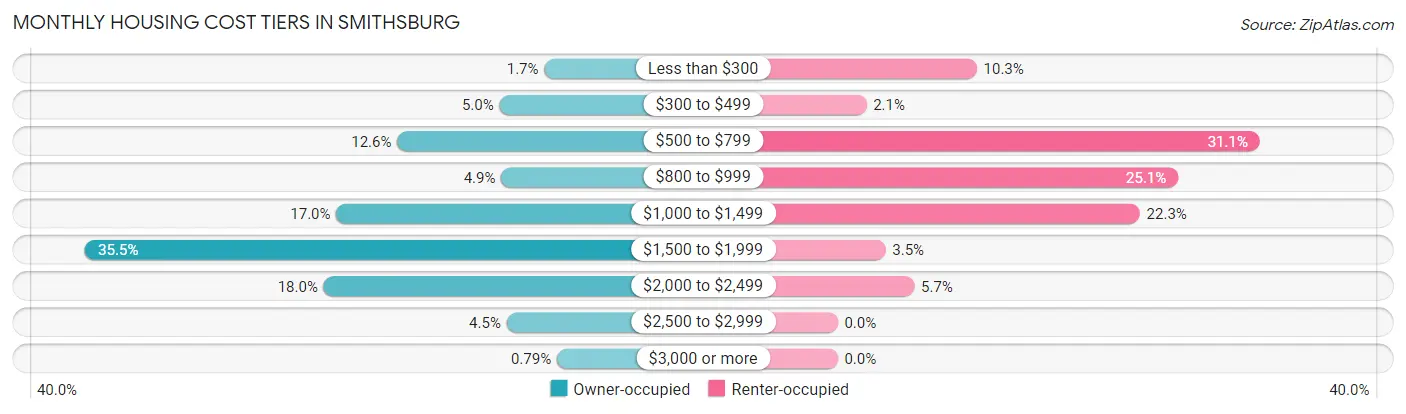
| Monthly Cost | Owner-occupied | Renter-occupied |
| Less than $300 | 13 (1.7%) | 29 (10.2%) |
| $300 to $499 | 38 (5.0%) | 6 (2.1%) |
| $500 to $799 | 95 (12.6%) | 88 (31.1%) |
| $800 to $999 | 37 (4.9%) | 71 (25.1%) |
| $1,000 to $1,499 | 129 (17.0%) | 63 (22.3%) |
| $1,500 to $1,999 | 269 (35.5%) | 10 (3.5%) |
| $2,000 to $2,499 | 136 (18.0%) | 16 (5.7%) |
| $2,500 to $2,999 | 34 (4.5%) | 0 (0.0%) |
| $3,000 or more | 6 (0.8%) | 0 (0.0%) |
| Total | 757 (100.0%) | 283 (100.0%) |
Physical Housing Characteristics in Smithsburg
Housing Structures in Smithsburg
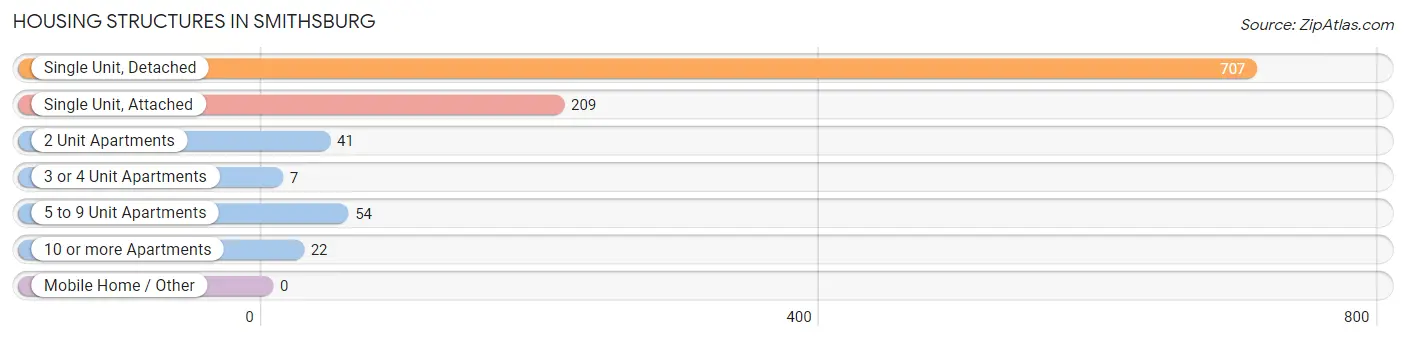
| Structure Type | # Housing Units | % Housing Units |
| Single Unit, Detached | 707 | 68.0% |
| Single Unit, Attached | 209 | 20.1% |
| 2 Unit Apartments | 41 | 3.9% |
| 3 or 4 Unit Apartments | 7 | 0.7% |
| 5 to 9 Unit Apartments | 54 | 5.2% |
| 10 or more Apartments | 22 | 2.1% |
| Mobile Home / Other | 0 | 0.0% |
| Total | 1,040 | 100.0% |
Housing Structures by Occupancy in Smithsburg
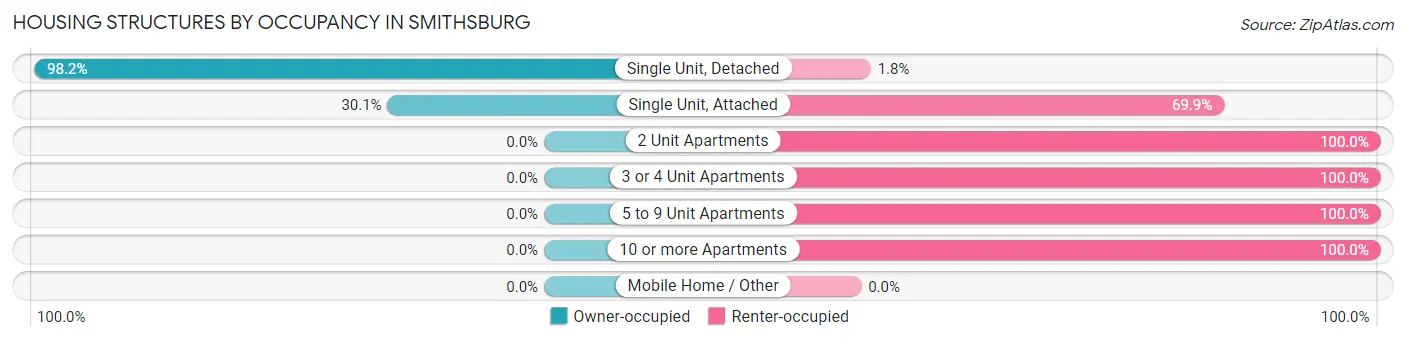
| Structure Type | Owner-occupied | Renter-occupied |
| Single Unit, Detached | 694 (98.2%) | 13 (1.8%) |
| Single Unit, Attached | 63 (30.1%) | 146 (69.9%) |
| 2 Unit Apartments | 0 (0.0%) | 41 (100.0%) |
| 3 or 4 Unit Apartments | 0 (0.0%) | 7 (100.0%) |
| 5 to 9 Unit Apartments | 0 (0.0%) | 54 (100.0%) |
| 10 or more Apartments | 0 (0.0%) | 22 (100.0%) |
| Mobile Home / Other | 0 (0.0%) | 0 (0.0%) |
| Total | 757 (72.8%) | 283 (27.2%) |
Housing Structures by Number of Rooms in Smithsburg
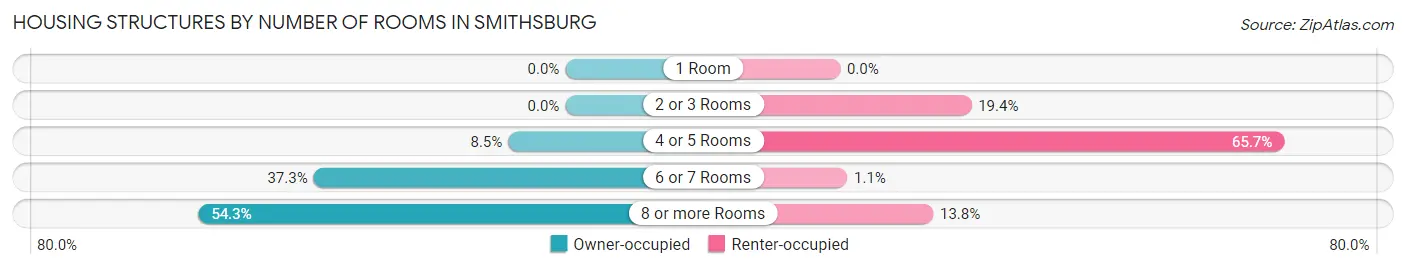
| Number of Rooms | Owner-occupied | Renter-occupied |
| 1 Room | 0 (0.0%) | 0 (0.0%) |
| 2 or 3 Rooms | 0 (0.0%) | 55 (19.4%) |
| 4 or 5 Rooms | 64 (8.5%) | 186 (65.7%) |
| 6 or 7 Rooms | 282 (37.2%) | 3 (1.1%) |
| 8 or more Rooms | 411 (54.3%) | 39 (13.8%) |
| Total | 757 (100.0%) | 283 (100.0%) |
Housing Structure by Heating Type in Smithsburg
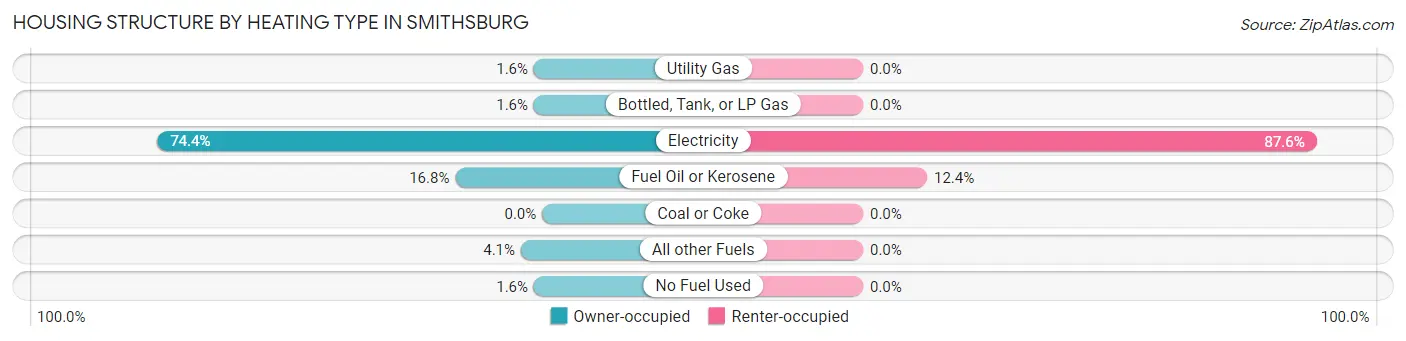
| Heating Type | Owner-occupied | Renter-occupied |
| Utility Gas | 12 (1.6%) | 0 (0.0%) |
| Bottled, Tank, or LP Gas | 12 (1.6%) | 0 (0.0%) |
| Electricity | 563 (74.4%) | 248 (87.6%) |
| Fuel Oil or Kerosene | 127 (16.8%) | 35 (12.4%) |
| Coal or Coke | 0 (0.0%) | 0 (0.0%) |
| All other Fuels | 31 (4.1%) | 0 (0.0%) |
| No Fuel Used | 12 (1.6%) | 0 (0.0%) |
| Total | 757 (100.0%) | 283 (100.0%) |
Household Vehicle Usage in Smithsburg
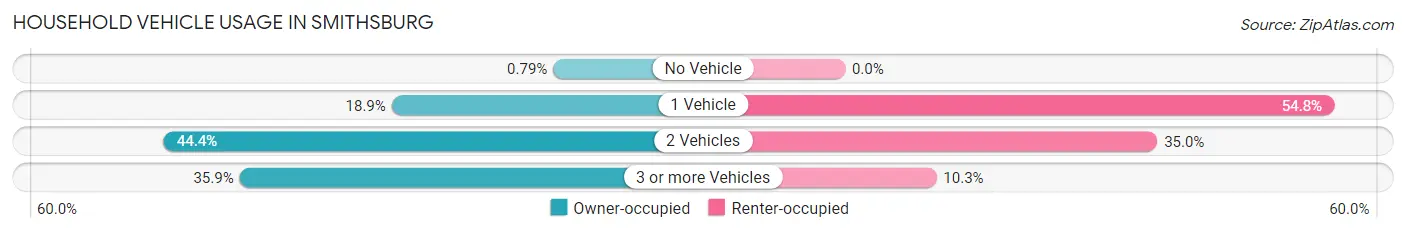
| Vehicles per Household | Owner-occupied | Renter-occupied |
| No Vehicle | 6 (0.8%) | 0 (0.0%) |
| 1 Vehicle | 143 (18.9%) | 155 (54.8%) |
| 2 Vehicles | 336 (44.4%) | 99 (35.0%) |
| 3 or more Vehicles | 272 (35.9%) | 29 (10.2%) |
| Total | 757 (100.0%) | 283 (100.0%) |
Real Estate & Mortgages in Smithsburg
Real Estate and Mortgage Overview in Smithsburg
| Characteristic | Without Mortgage | With Mortgage |
| Housing Units | 132 | 625 |
| Median Property Value | $290,900 | $290,000 |
| Median Household Income | $86,842 | $180 |
| Monthly Housing Costs | $542 | $6 |
| Real Estate Taxes | $2,638 | $11 |
Property Value by Mortgage Status in Smithsburg
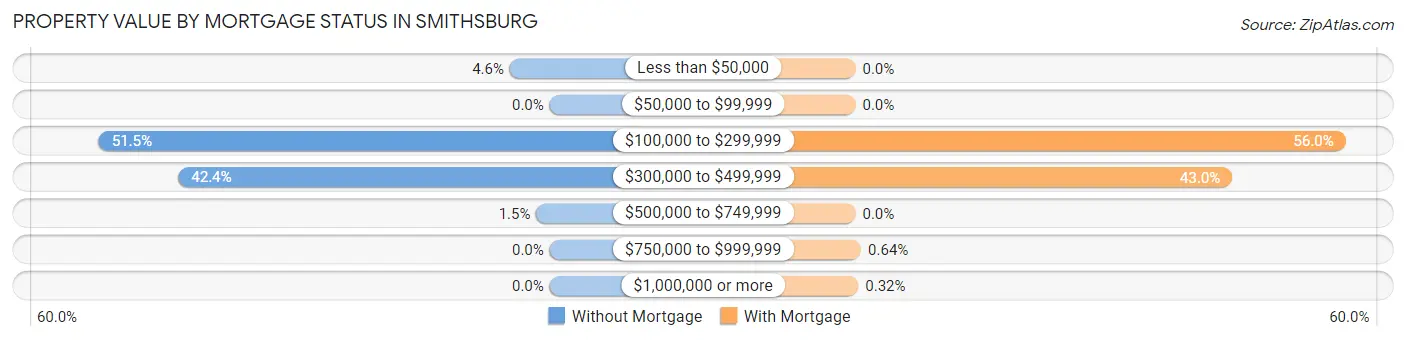
| Property Value | Without Mortgage | With Mortgage |
| Less than $50,000 | 6 (4.5%) | 0 (0.0%) |
| $50,000 to $99,999 | 0 (0.0%) | 0 (0.0%) |
| $100,000 to $299,999 | 68 (51.5%) | 350 (56.0%) |
| $300,000 to $499,999 | 56 (42.4%) | 269 (43.0%) |
| $500,000 to $749,999 | 2 (1.5%) | 0 (0.0%) |
| $750,000 to $999,999 | 0 (0.0%) | 4 (0.6%) |
| $1,000,000 or more | 0 (0.0%) | 2 (0.3%) |
| Total | 132 (100.0%) | 625 (100.0%) |
Household Income by Mortgage Status in Smithsburg
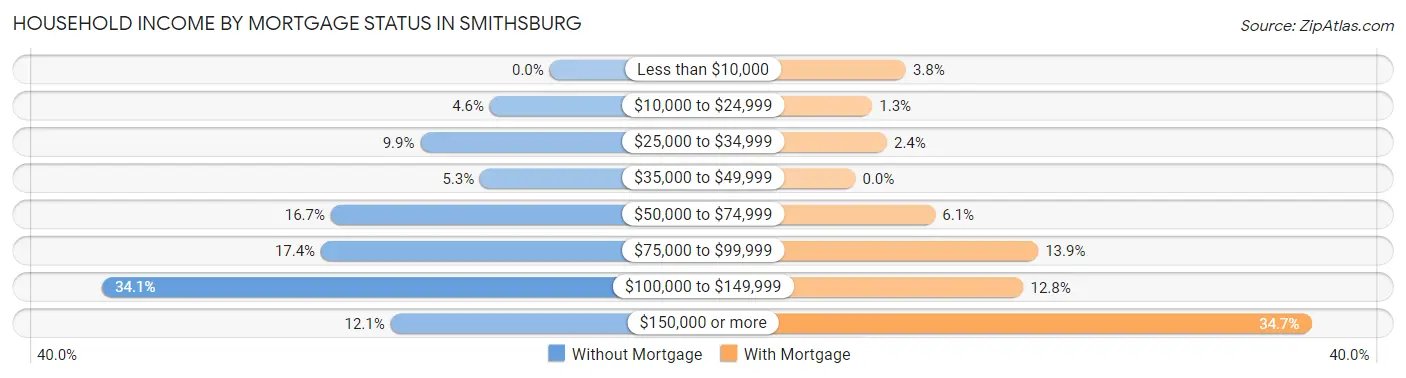
| Household Income | Without Mortgage | With Mortgage |
| Less than $10,000 | 0 (0.0%) | 24 (3.8%) |
| $10,000 to $24,999 | 6 (4.5%) | 8 (1.3%) |
| $25,000 to $34,999 | 13 (9.9%) | 15 (2.4%) |
| $35,000 to $49,999 | 7 (5.3%) | 0 (0.0%) |
| $50,000 to $74,999 | 22 (16.7%) | 38 (6.1%) |
| $75,000 to $99,999 | 23 (17.4%) | 87 (13.9%) |
| $100,000 to $149,999 | 45 (34.1%) | 80 (12.8%) |
| $150,000 or more | 16 (12.1%) | 217 (34.7%) |
| Total | 132 (100.0%) | 625 (100.0%) |
Property Value to Household Income Ratio in Smithsburg
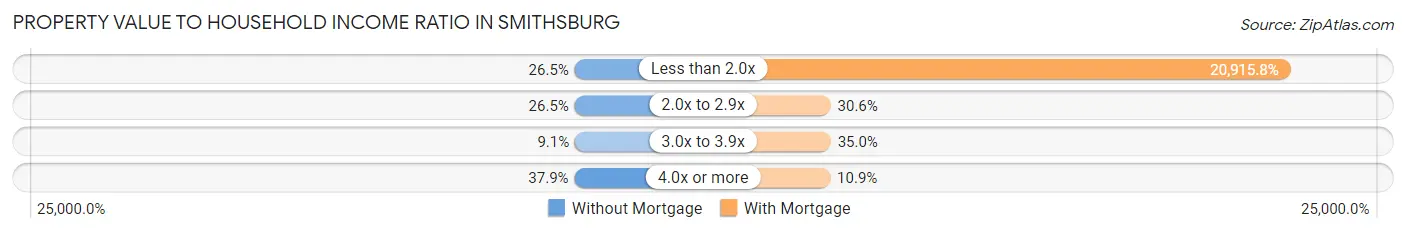
| Value-to-Income Ratio | Without Mortgage | With Mortgage |
| Less than 2.0x | 35 (26.5%) | 130,724 (20,915.8%) |
| 2.0x to 2.9x | 35 (26.5%) | 191 (30.6%) |
| 3.0x to 3.9x | 12 (9.1%) | 219 (35.0%) |
| 4.0x or more | 50 (37.9%) | 68 (10.9%) |
| Total | 132 (100.0%) | 625 (100.0%) |
Real Estate Taxes by Mortgage Status in Smithsburg
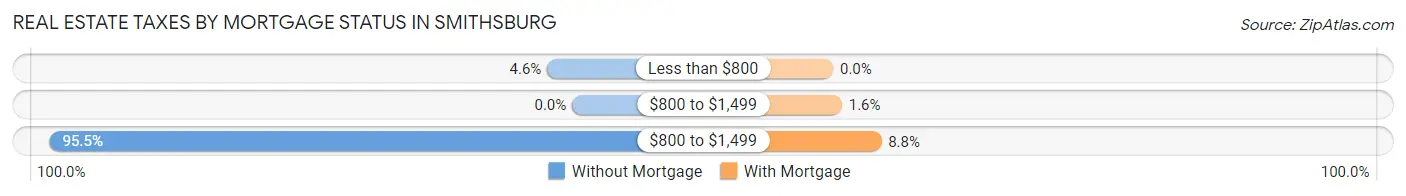
| Property Taxes | Without Mortgage | With Mortgage |
| Less than $800 | 6 (4.5%) | 0 (0.0%) |
| $800 to $1,499 | 0 (0.0%) | 10 (1.6%) |
| $800 to $1,499 | 126 (95.5%) | 55 (8.8%) |
| Total | 132 (100.0%) | 625 (100.0%) |
Health & Disability in Smithsburg
Health Insurance Coverage by Age in Smithsburg
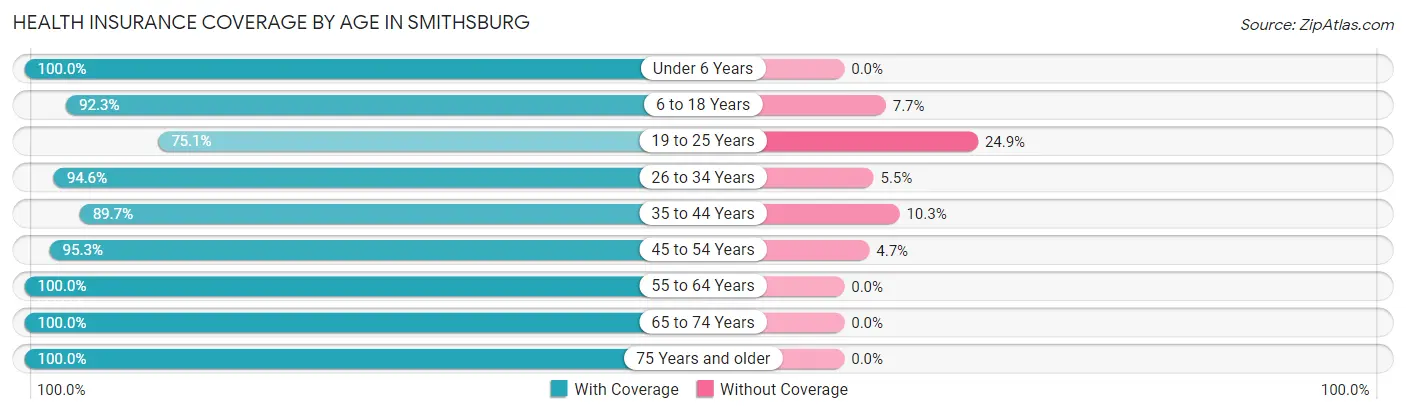
| Age Bracket | With Coverage | Without Coverage |
| Under 6 Years | 209 (100.0%) | 0 (0.0%) |
| 6 to 18 Years | 715 (92.3%) | 60 (7.7%) |
| 19 to 25 Years | 223 (75.1%) | 74 (24.9%) |
| 26 to 34 Years | 260 (94.6%) | 15 (5.4%) |
| 35 to 44 Years | 340 (89.7%) | 39 (10.3%) |
| 45 to 54 Years | 387 (95.3%) | 19 (4.7%) |
| 55 to 64 Years | 345 (100.0%) | 0 (0.0%) |
| 65 to 74 Years | 229 (100.0%) | 0 (0.0%) |
| 75 Years and older | 112 (100.0%) | 0 (0.0%) |
| Total | 2,820 (93.2%) | 207 (6.8%) |
Health Insurance Coverage by Citizenship Status in Smithsburg
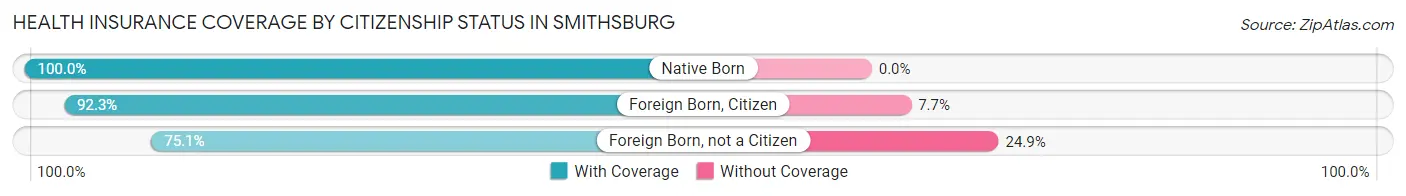
| Citizenship Status | With Coverage | Without Coverage |
| Native Born | 209 (100.0%) | 0 (0.0%) |
| Foreign Born, Citizen | 715 (92.3%) | 60 (7.7%) |
| Foreign Born, not a Citizen | 223 (75.1%) | 74 (24.9%) |
Health Insurance Coverage by Household Income in Smithsburg
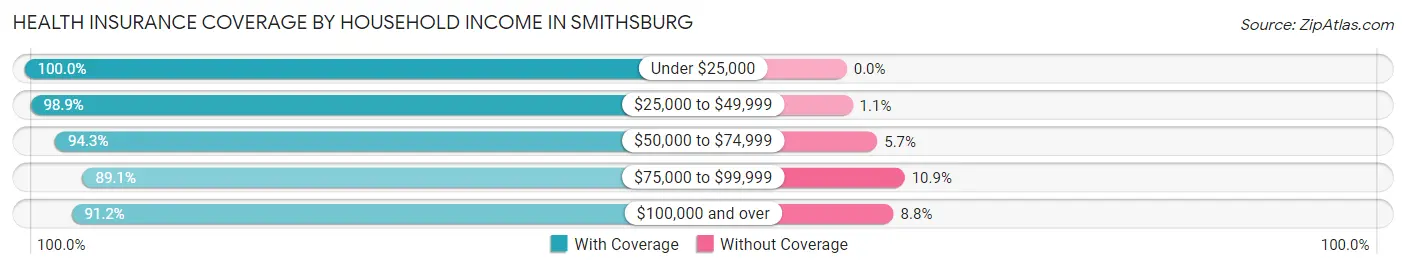
| Household Income | With Coverage | Without Coverage |
| Under $25,000 | 250 (100.0%) | 0 (0.0%) |
| $25,000 to $49,999 | 449 (98.9%) | 5 (1.1%) |
| $50,000 to $74,999 | 231 (94.3%) | 14 (5.7%) |
| $75,000 to $99,999 | 238 (89.1%) | 29 (10.9%) |
| $100,000 and over | 1,652 (91.2%) | 159 (8.8%) |
Public vs Private Health Insurance Coverage by Age in Smithsburg
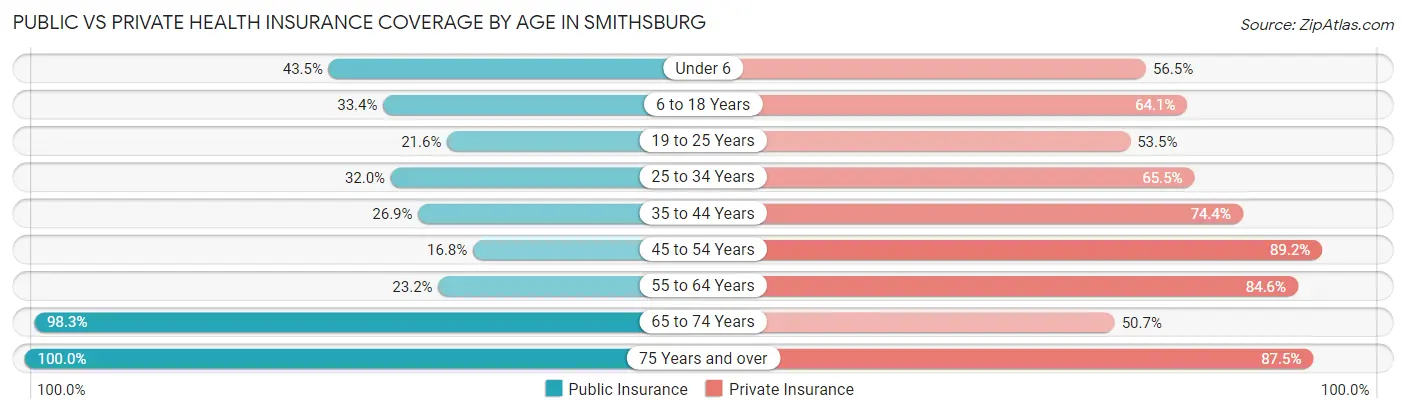
| Age Bracket | Public Insurance | Private Insurance |
| Under 6 | 91 (43.5%) | 118 (56.5%) |
| 6 to 18 Years | 259 (33.4%) | 497 (64.1%) |
| 19 to 25 Years | 64 (21.5%) | 159 (53.5%) |
| 25 to 34 Years | 88 (32.0%) | 180 (65.4%) |
| 35 to 44 Years | 102 (26.9%) | 282 (74.4%) |
| 45 to 54 Years | 68 (16.8%) | 362 (89.2%) |
| 55 to 64 Years | 80 (23.2%) | 292 (84.6%) |
| 65 to 74 Years | 225 (98.3%) | 116 (50.7%) |
| 75 Years and over | 112 (100.0%) | 98 (87.5%) |
| Total | 1,089 (36.0%) | 2,104 (69.5%) |
Disability Status by Sex by Age in Smithsburg
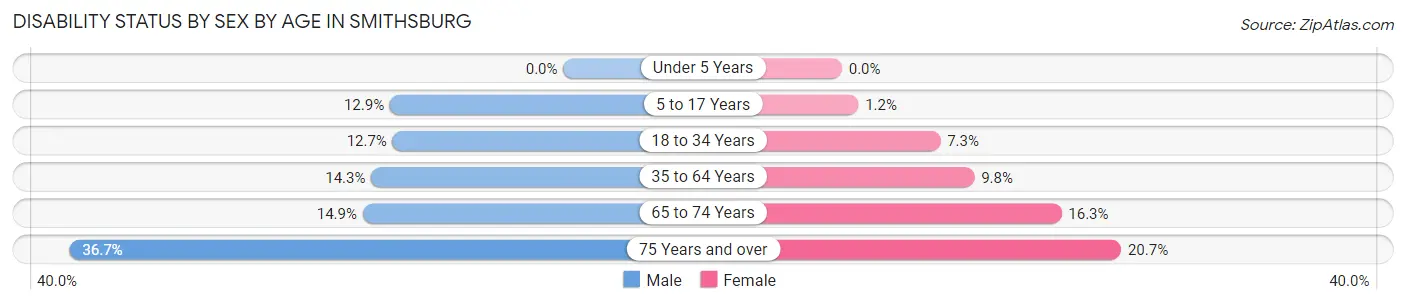
| Age Bracket | Male | Female |
| Under 5 Years | 0 (0.0%) | 0 (0.0%) |
| 5 to 17 Years | 44 (12.9%) | 5 (1.2%) |
| 18 to 34 Years | 38 (12.7%) | 25 (7.3%) |
| 35 to 64 Years | 77 (14.3%) | 58 (9.8%) |
| 65 to 74 Years | 14 (14.9%) | 22 (16.3%) |
| 75 Years and over | 11 (36.7%) | 17 (20.7%) |
Disability Class by Sex by Age in Smithsburg
Disability Class: Hearing Difficulty
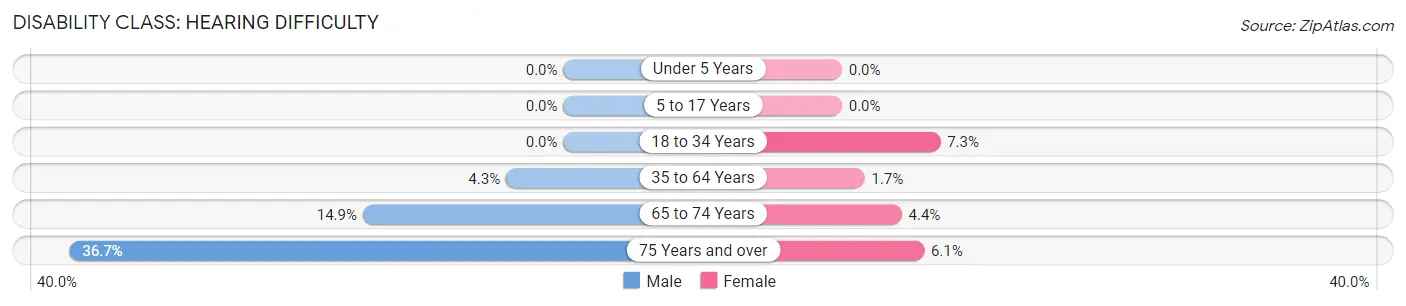
| Age Bracket | Male | Female |
| Under 5 Years | 0 (0.0%) | 0 (0.0%) |
| 5 to 17 Years | 0 (0.0%) | 0 (0.0%) |
| 18 to 34 Years | 0 (0.0%) | 25 (7.3%) |
| 35 to 64 Years | 23 (4.3%) | 10 (1.7%) |
| 65 to 74 Years | 14 (14.9%) | 6 (4.4%) |
| 75 Years and over | 11 (36.7%) | 5 (6.1%) |
Disability Class: Vision Difficulty
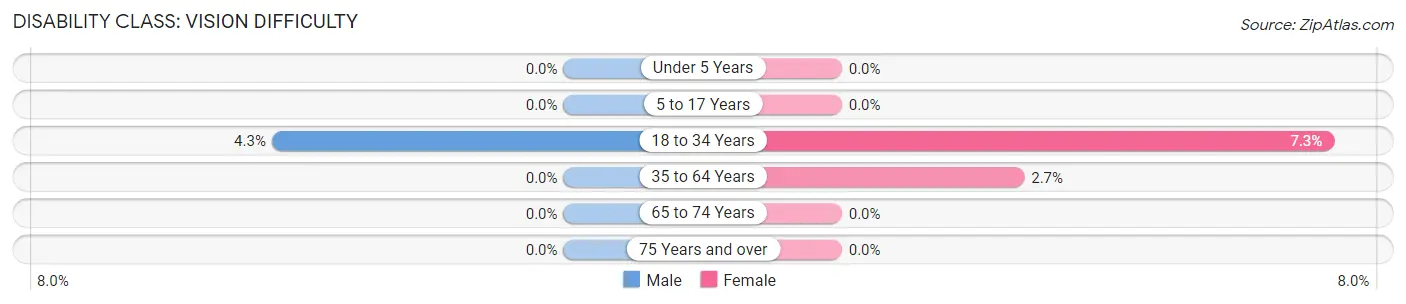
| Age Bracket | Male | Female |
| Under 5 Years | 0 (0.0%) | 0 (0.0%) |
| 5 to 17 Years | 0 (0.0%) | 0 (0.0%) |
| 18 to 34 Years | 13 (4.3%) | 25 (7.3%) |
| 35 to 64 Years | 0 (0.0%) | 16 (2.7%) |
| 65 to 74 Years | 0 (0.0%) | 0 (0.0%) |
| 75 Years and over | 0 (0.0%) | 0 (0.0%) |
Disability Class: Cognitive Difficulty
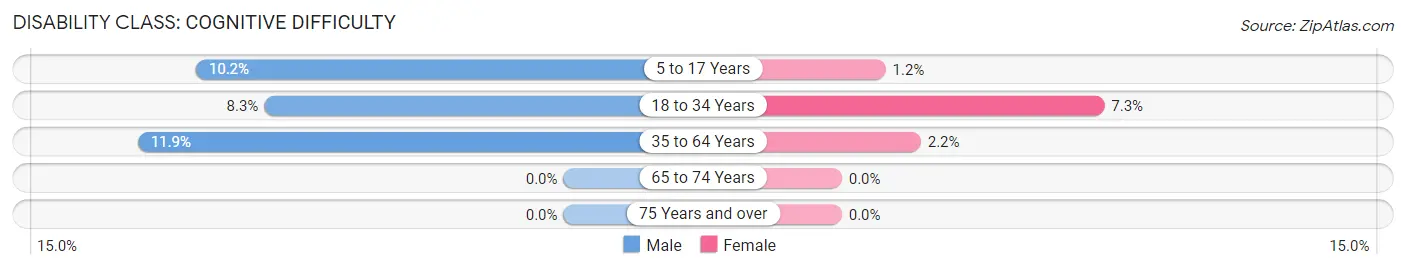
| Age Bracket | Male | Female |
| 5 to 17 Years | 35 (10.2%) | 5 (1.2%) |
| 18 to 34 Years | 25 (8.3%) | 25 (7.3%) |
| 35 to 64 Years | 64 (11.8%) | 13 (2.2%) |
| 65 to 74 Years | 0 (0.0%) | 0 (0.0%) |
| 75 Years and over | 0 (0.0%) | 0 (0.0%) |
Disability Class: Ambulatory Difficulty
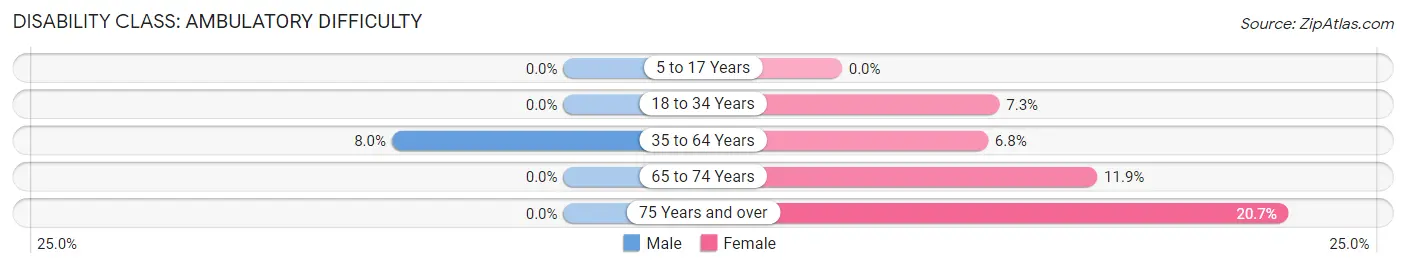
| Age Bracket | Male | Female |
| 5 to 17 Years | 0 (0.0%) | 0 (0.0%) |
| 18 to 34 Years | 0 (0.0%) | 25 (7.3%) |
| 35 to 64 Years | 43 (8.0%) | 40 (6.8%) |
| 65 to 74 Years | 0 (0.0%) | 16 (11.8%) |
| 75 Years and over | 0 (0.0%) | 17 (20.7%) |
Disability Class: Self-Care Difficulty
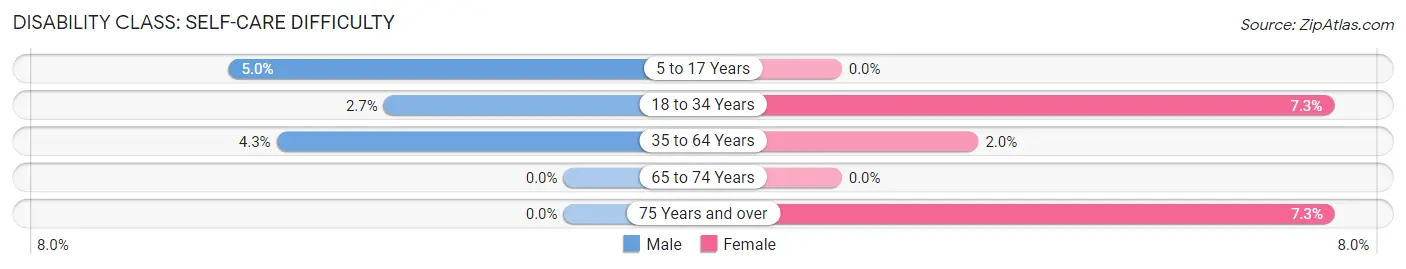
| Age Bracket | Male | Female |
| 5 to 17 Years | 17 (5.0%) | 0 (0.0%) |
| 18 to 34 Years | 8 (2.7%) | 25 (7.3%) |
| 35 to 64 Years | 23 (4.3%) | 12 (2.0%) |
| 65 to 74 Years | 0 (0.0%) | 0 (0.0%) |
| 75 Years and over | 0 (0.0%) | 6 (7.3%) |
Technology Access in Smithsburg
Computing Device Access in Smithsburg
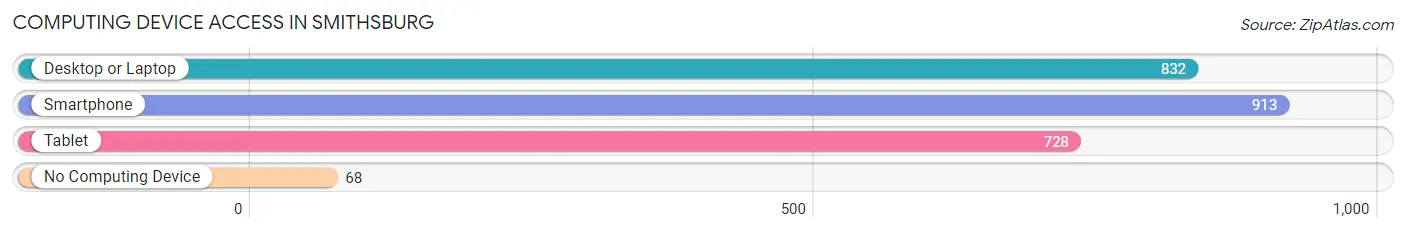
| Device Type | # Households | % Households |
| Desktop or Laptop | 832 | 80.0% |
| Smartphone | 913 | 87.8% |
| Tablet | 728 | 70.0% |
| No Computing Device | 68 | 6.5% |
| Total | 1,040 | 100.0% |
Internet Access in Smithsburg
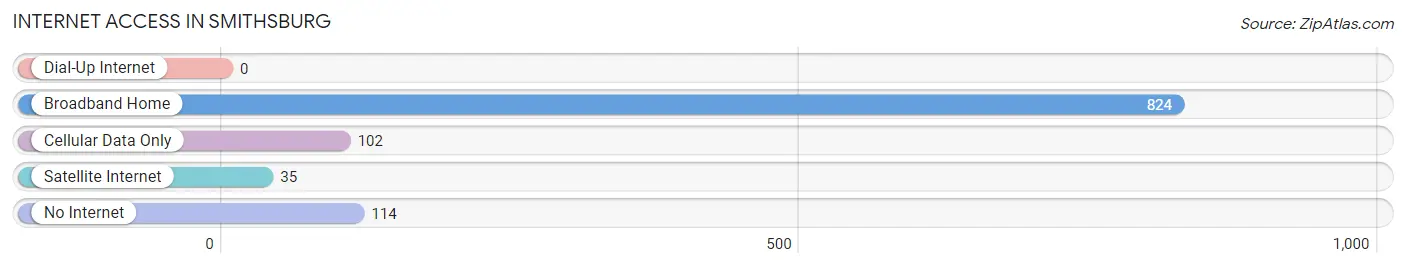
| Internet Type | # Households | % Households |
| Dial-Up Internet | 0 | 0.0% |
| Broadband Home | 824 | 79.2% |
| Cellular Data Only | 102 | 9.8% |
| Satellite Internet | 35 | 3.4% |
| No Internet | 114 | 11.0% |
| Total | 1,040 | 100.0% |
Smithsburg Summary
History
The town of Smithsburg, Maryland is located in Washington County, in the western part of the state. It is situated in the Appalachian Mountains, and is part of the Cumberland Valley. The town was founded in 1762 by John Smith, who was a German immigrant. Smithsburg was originally known as Smith's Town, and was the first settlement in the area.
The town was an important stop on the National Road, which was the first federally funded highway in the United States. The road was built in the early 19th century, and connected the Potomac and Ohio Rivers. Smithsburg was a popular stop for travelers, and the town grew rapidly. By the mid-1800s, Smithsburg had become a thriving community, with a variety of businesses, including a hotel, a blacksmith, a tannery, and a gristmill.
The town was also home to a number of churches, including the Smithsburg United Methodist Church, which was founded in 1820. The church is still active today, and is the oldest church in the town.
The town was also home to a number of Civil War battles, including the Battle of South Mountain, which was fought in 1862. The town was also the site of the Battle of Smithsburg, which was fought in 1863.
Geography
Smithsburg is located in Washington County, in the western part of Maryland. It is situated in the Appalachian Mountains, and is part of the Cumberland Valley. The town is located at the intersection of Interstate 70 and US Route 40.
The town is located in a rural area, and is surrounded by rolling hills and farmland. The town is located near the Potomac River, and is about 25 miles from the city of Hagerstown.
The climate in Smithsburg is temperate, with hot summers and cold winters. The average temperature in the summer is around 80 degrees Fahrenheit, and the average temperature in the winter is around 40 degrees Fahrenheit.
Economy
The economy of Smithsburg is largely based on agriculture and tourism. The town is home to a number of farms, which produce a variety of crops, including corn, soybeans, and hay. The town is also home to a number of wineries, which produce a variety of wines.
The town is also home to a number of businesses, including restaurants, shops, and hotels. The town is also home to a number of manufacturing companies, which produce a variety of products, including furniture, clothing, and electronics.
The town is also home to a number of tourist attractions, including the Smithsburg Historical Society Museum, which is located in the town center. The museum features a variety of exhibits, including artifacts from the town's history.
Demographics
As of the 2010 census, the population of Smithsburg was 2,919. The town has a population density of 1,092 people per square mile. The median age of the population is 42.7 years, and the median household income is $50,945.
The town is predominantly white, with 92.3% of the population identifying as white. The town is also home to a small Hispanic population, with 4.2% of the population identifying as Hispanic or Latino.
The town is also home to a small African American population, with 1.7% of the population identifying as African American. The town is also home to a small Asian population, with 0.7% of the population identifying as Asian.
Conclusion
Smithsburg, Maryland is a small town located in Washington County, in the western part of the state. The town was founded in 1762, and has a rich history. The town is home to a variety of businesses, including restaurants, shops, and hotels. The town is also home to a number of tourist attractions, including the Smithsburg Historical Society Museum. The town has a population of 2,919, and is predominantly white. The town is also home to a small Hispanic, African American, and Asian population. The town is largely based on agriculture and tourism, and is a popular destination for visitors.
Common Questions
What is Per Capita Income in Smithsburg?
Per Capita income in Smithsburg is $37,171.
What is the Median Family Income in Smithsburg?
Median Family Income in Smithsburg is $111,000.
What is the Median Household income in Smithsburg?
Median Household Income in Smithsburg is $89,167.
What is Income or Wage Gap in Smithsburg?
Income or Wage Gap in Smithsburg is 31.8%.
Women in Smithsburg earn 68.2 cents for every dollar earned by a man.
What is Inequality or Gini Index in Smithsburg?
Inequality or Gini Index in Smithsburg is 0.39.
What is the Total Population of Smithsburg?
Total Population of Smithsburg is 3,028.
What is the Total Male Population of Smithsburg?
Total Male Population of Smithsburg is 1,377.
What is the Total Female Population of Smithsburg?
Total Female Population of Smithsburg is 1,651.
What is the Ratio of Males per 100 Females in Smithsburg?
There are 83.40 Males per 100 Females in Smithsburg.
What is the Ratio of Females per 100 Males in Smithsburg?
There are 119.90 Females per 100 Males in Smithsburg.
What is the Median Population Age in Smithsburg?
Median Population Age in Smithsburg is 34.4 Years.
What is the Average Family Size in Smithsburg
Average Family Size in Smithsburg is 3.4 People.
What is the Average Household Size in Smithsburg
Average Household Size in Smithsburg is 2.9 People.
How Large is the Labor Force in Smithsburg?
There are 1,549 People in the Labor Forcein in Smithsburg.
What is the Percentage of People in the Labor Force in Smithsburg?
70.2% of People are in the Labor Force in Smithsburg.
What is the Unemployment Rate in Smithsburg?
Unemployment Rate in Smithsburg is 3.4%.