Prince Frederick, MD Map & Demographics
Prince Frederick Map
Prince Frederick Overview
$36,429
PER CAPITA INCOME
$122,500
AVG FAMILY INCOME
$61,293
AVG HOUSEHOLD INCOME
47.2%
WAGE / INCOME GAP [ % ]
52.8¢/ $1
WAGE / INCOME GAP [ $ ]
0.46
INEQUALITY / GINI INDEX
2,491
TOTAL POPULATION
990
MALE POPULATION
1,501
FEMALE POPULATION
65.96
MALES / 100 FEMALES
151.62
FEMALES / 100 MALES
38.9
MEDIAN AGE
3.1
AVG FAMILY SIZE
2.2
AVG HOUSEHOLD SIZE
1,170
LABOR FORCE [ PEOPLE ]
56.7%
PERCENT IN LABOR FORCE
10.1%
UNEMPLOYMENT RATE
Prince Frederick Zip Codes
Income in Prince Frederick
Income Overview in Prince Frederick
Per Capita Income in Prince Frederick is $36,429, while median incomes of families and households are $122,500 and $61,293 respectively.
| Characteristic | Number | Measure |
| Per Capita Income | 2,491 | $36,429 |
| Median Family Income | 556 | $122,500 |
| Mean Family Income | 556 | $120,992 |
| Median Household Income | 1,066 | $61,293 |
| Mean Household Income | 1,066 | $79,331 |
| Income Deficit | 556 | $0 |
| Wage / Income Gap (%) | 2,491 | 47.15% |
| Wage / Income Gap ($) | 2,491 | 52.85¢ per $1 |
| Gini / Inequality Index | 2,491 | 0.46 |
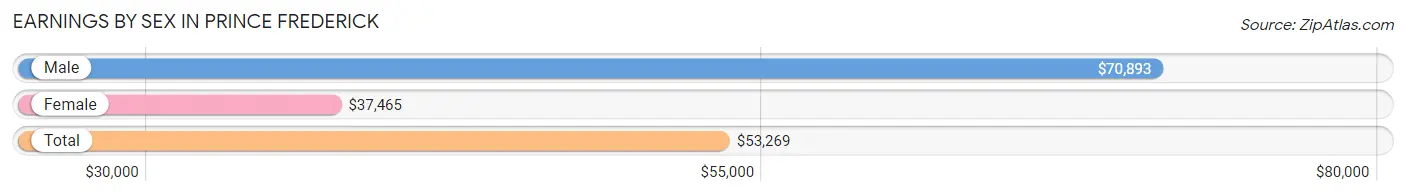
Earnings by Sex in Prince Frederick
Average Earnings in Prince Frederick are $53,269, $70,893 for men and $37,465 for women, a difference of 47.1%.
| Sex | Number | Average Earnings |
| Male | 433 (36.9%) | $70,893 |
| Female | 741 (63.1%) | $37,465 |
| Total | 1,174 (100.0%) | $53,269 |
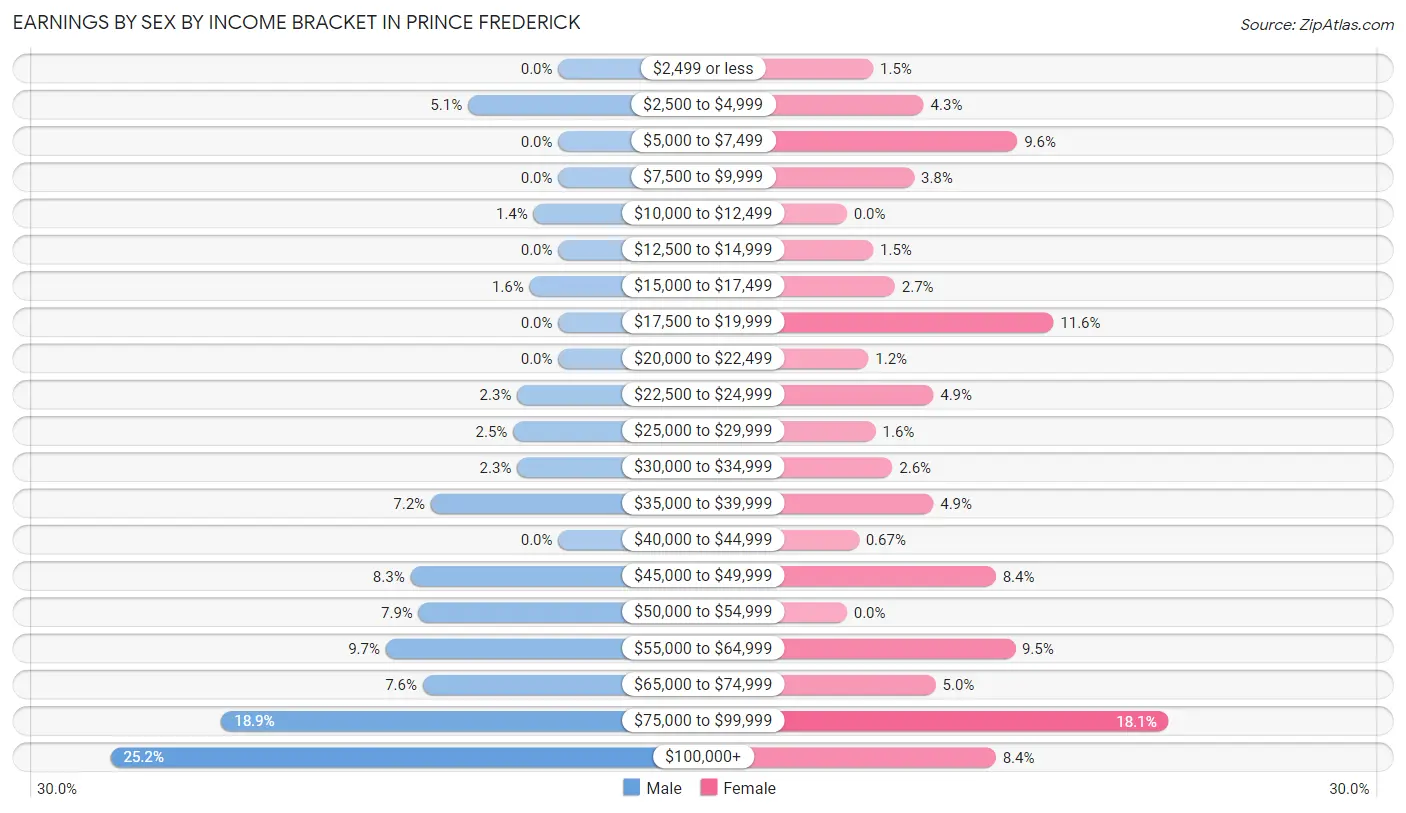
Earnings by Sex by Income Bracket in Prince Frederick
The most common earnings brackets in Prince Frederick are $100,000+ for men (109 | 25.2%) and $75,000 to $99,999 for women (134 | 18.1%).
| Income | Male | Female |
| $2,499 or less | 0 (0.0%) | 11 (1.5%) |
| $2,500 to $4,999 | 22 (5.1%) | 32 (4.3%) |
| $5,000 to $7,499 | 0 (0.0%) | 71 (9.6%) |
| $7,500 to $9,999 | 0 (0.0%) | 28 (3.8%) |
| $10,000 to $12,499 | 6 (1.4%) | 0 (0.0%) |
| $12,500 to $14,999 | 0 (0.0%) | 11 (1.5%) |
| $15,000 to $17,499 | 7 (1.6%) | 20 (2.7%) |
| $17,500 to $19,999 | 0 (0.0%) | 86 (11.6%) |
| $20,000 to $22,499 | 0 (0.0%) | 9 (1.2%) |
| $22,500 to $24,999 | 10 (2.3%) | 36 (4.9%) |
| $25,000 to $29,999 | 11 (2.5%) | 12 (1.6%) |
| $30,000 to $34,999 | 10 (2.3%) | 19 (2.6%) |
| $35,000 to $39,999 | 31 (7.2%) | 36 (4.9%) |
| $40,000 to $44,999 | 0 (0.0%) | 5 (0.7%) |
| $45,000 to $49,999 | 36 (8.3%) | 62 (8.4%) |
| $50,000 to $54,999 | 34 (7.9%) | 0 (0.0%) |
| $55,000 to $64,999 | 42 (9.7%) | 70 (9.5%) |
| $65,000 to $74,999 | 33 (7.6%) | 37 (5.0%) |
| $75,000 to $99,999 | 82 (18.9%) | 134 (18.1%) |
| $100,000+ | 109 (25.2%) | 62 (8.4%) |
| Total | 433 (100.0%) | 741 (100.0%) |
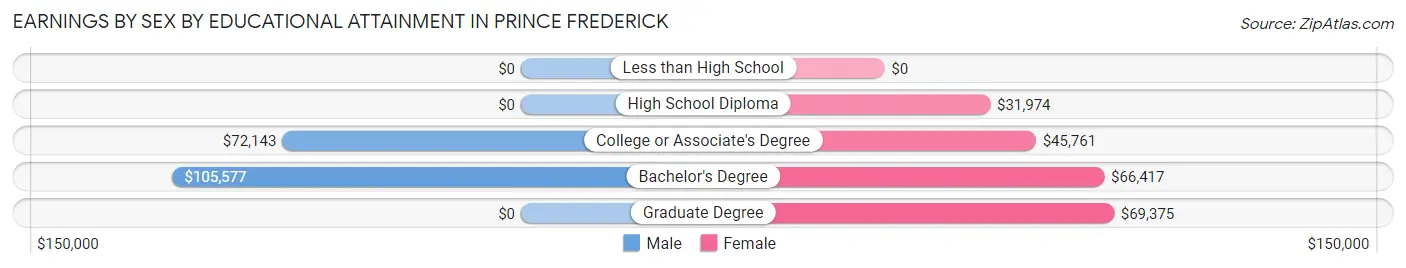
Earnings by Sex by Educational Attainment in Prince Frederick
Average earnings in Prince Frederick are $77,601 for men and $59,178 for women, a difference of 23.7%. Men with an educational attainment of bachelor's degree enjoy the highest average annual earnings of $105,577, while those with college or associate's degree education earn the least with $72,143. Women with an educational attainment of graduate degree earn the most with the average annual earnings of $69,375, while those with high school diploma education have the smallest earnings of $31,974.
| Educational Attainment | Male Income | Female Income |
| Less than High School | - | - |
| High School Diploma | - | - |
| College or Associate's Degree | $72,143 | $45,761 |
| Bachelor's Degree | $105,577 | $66,417 |
| Graduate Degree | - | - |
| Total | $77,601 | $59,178 |
Family Income in Prince Frederick
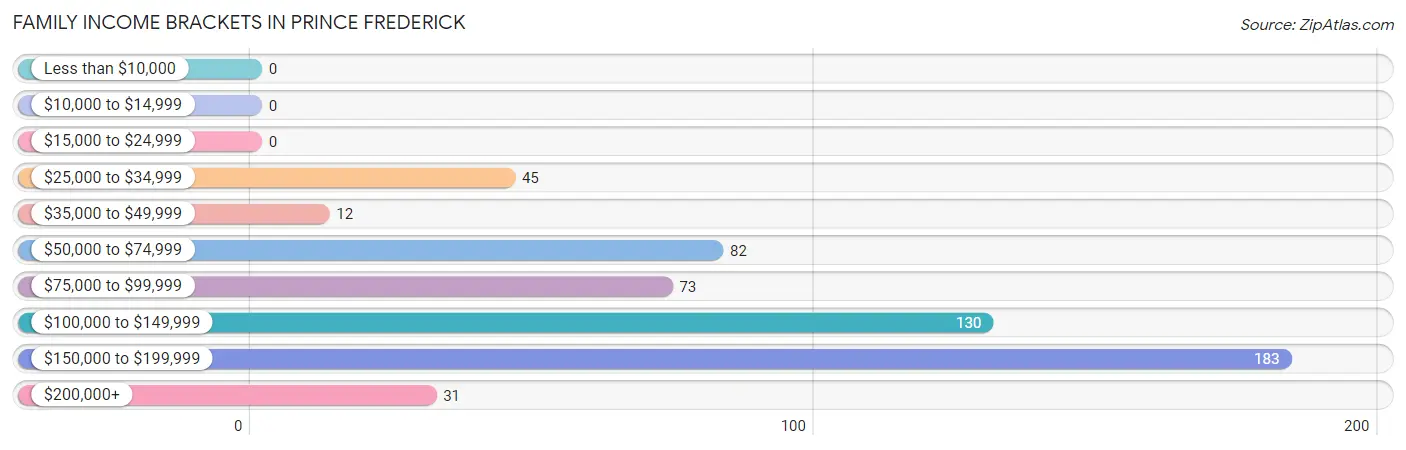
Family Income Brackets in Prince Frederick
According to the Prince Frederick family income data, there are 183 families falling into the $150,000 to $199,999 income range, which is the most common income bracket and makes up 32.9% of all families.
| Income Bracket | # Families | % Families |
| Less than $10,000 | 0 | 0.0% |
| $10,000 to $14,999 | 0 | 0.0% |
| $15,000 to $24,999 | 0 | 0.0% |
| $25,000 to $34,999 | 45 | 8.1% |
| $35,000 to $49,999 | 12 | 2.2% |
| $50,000 to $74,999 | 82 | 14.7% |
| $75,000 to $99,999 | 73 | 13.1% |
| $100,000 to $149,999 | 130 | 23.4% |
| $150,000 to $199,999 | 183 | 32.9% |
| $200,000+ | 31 | 5.6% |
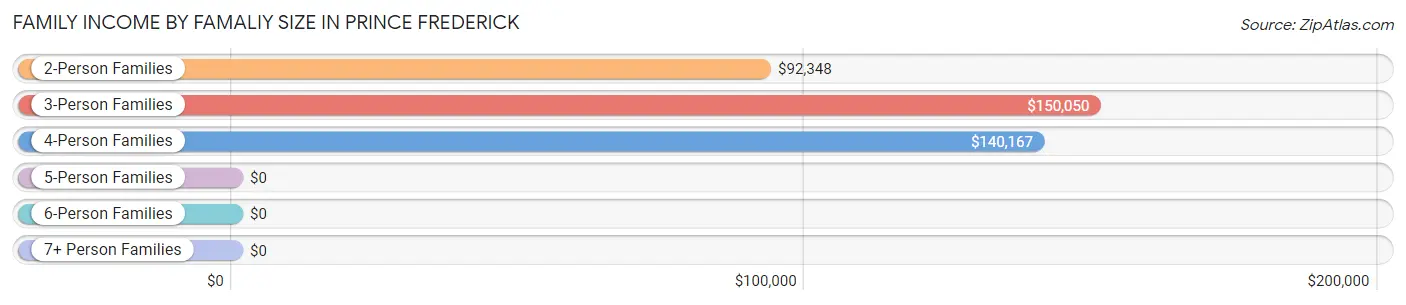
Family Income by Famaliy Size in Prince Frederick
3-person families (205 | 36.9%) account for the highest median family income in Prince Frederick with $150,050 per family, while 3-person families (205 | 36.9%) have the highest median income of $50,017 per family member.
| Income Bracket | # Families | Median Income |
| 2-Person Families | 200 (36.0%) | $92,348 |
| 3-Person Families | 205 (36.9%) | $150,050 |
| 4-Person Families | 94 (16.9%) | $140,167 |
| 5-Person Families | 48 (8.6%) | $0 |
| 6-Person Families | 9 (1.6%) | $0 |
| 7+ Person Families | 0 (0.0%) | $0 |
| Total | 556 (100.0%) | $122,500 |
Family Income by Number of Earners in Prince Frederick
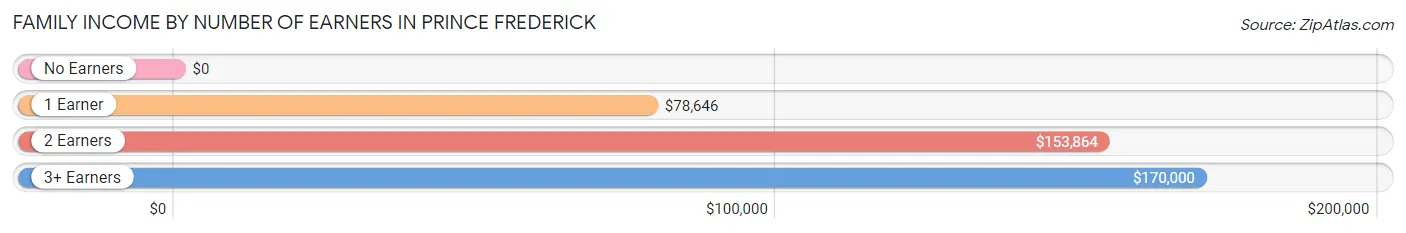
| Number of Earners | # Families | Median Income |
| No Earners | 47 (8.5%) | $0 |
| 1 Earner | 171 (30.8%) | $78,646 |
| 2 Earners | 288 (51.8%) | $153,864 |
| 3+ Earners | 50 (9.0%) | $170,000 |
| Total | 556 (100.0%) | $122,500 |
Household Income in Prince Frederick
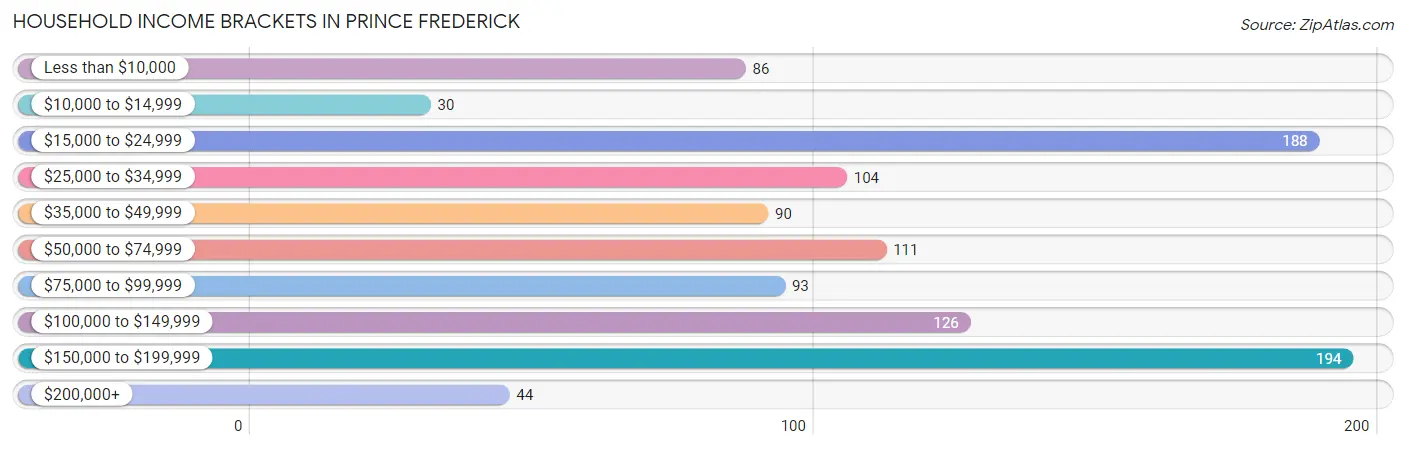
Household Income Brackets in Prince Frederick
With 194 households falling in the category, the $150,000 to $199,999 income range is the most frequent in Prince Frederick, accounting for 18.2% of all households. In contrast, only 30 households (2.8%) fall into the $10,000 to $14,999 income bracket, making it the least populous group.
| Income Bracket | # Households | % Households |
| Less than $10,000 | 86 | 8.1% |
| $10,000 to $14,999 | 30 | 2.8% |
| $15,000 to $24,999 | 188 | 17.6% |
| $25,000 to $34,999 | 104 | 9.8% |
| $35,000 to $49,999 | 90 | 8.4% |
| $50,000 to $74,999 | 111 | 10.4% |
| $75,000 to $99,999 | 93 | 8.7% |
| $100,000 to $149,999 | 126 | 11.8% |
| $150,000 to $199,999 | 194 | 18.2% |
| $200,000+ | 44 | 4.1% |
Household Income by Householder Age in Prince Frederick
The median household income in Prince Frederick is $61,293, with the highest median household income of $91,818 found in the 25 to 44 years age bracket for the primary householder. A total of 386 households (36.2%) fall into this category. Meanwhile, the 15 to 24 years age bracket for the primary householder has the lowest median household income of $0, with 30 households (2.8%) in this group.
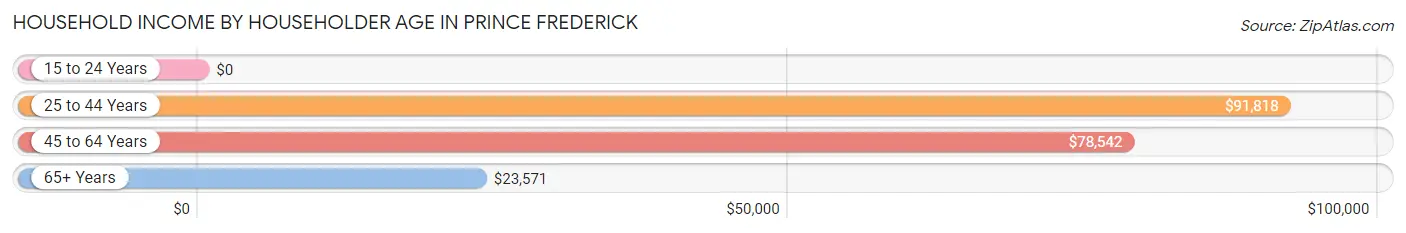
| Income Bracket | # Households | Median Income |
| 15 to 24 Years | 30 (2.8%) | $0 |
| 25 to 44 Years | 386 (36.2%) | $91,818 |
| 45 to 64 Years | 278 (26.1%) | $78,542 |
| 65+ Years | 372 (34.9%) | $23,571 |
| Total | 1,066 (100.0%) | $61,293 |
Poverty in Prince Frederick
Income Below Poverty by Sex and Age in Prince Frederick
With 18.7% poverty level for males and 13.5% for females among the residents of Prince Frederick, 15 year old males and 18 to 24 year old females are the most vulnerable to poverty, with 9 males (90.0%) and 94 females (46.3%) in their respective age groups living below the poverty level.
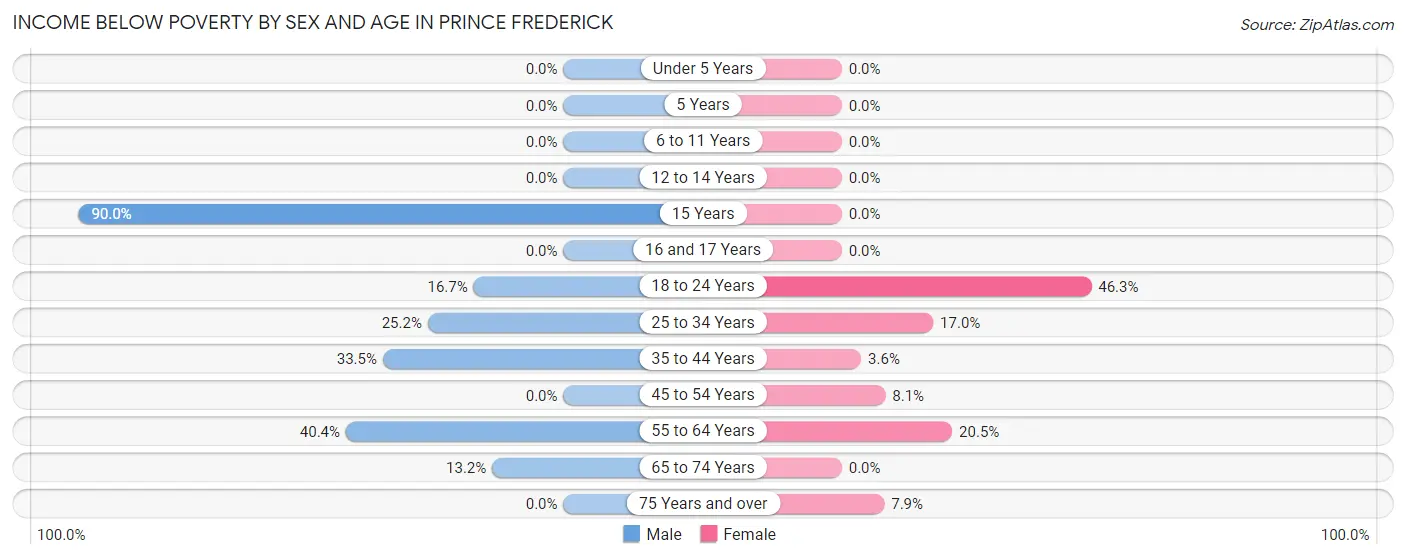
| Age Bracket | Male | Female |
| Under 5 Years | 0 (0.0%) | 0 (0.0%) |
| 5 Years | 0 (0.0%) | 0 (0.0%) |
| 6 to 11 Years | 0 (0.0%) | 0 (0.0%) |
| 12 to 14 Years | 0 (0.0%) | 0 (0.0%) |
| 15 Years | 9 (90.0%) | 0 (0.0%) |
| 16 and 17 Years | 0 (0.0%) | 0 (0.0%) |
| 18 to 24 Years | 9 (16.7%) | 94 (46.3%) |
| 25 to 34 Years | 36 (25.2%) | 29 (17.0%) |
| 35 to 44 Years | 63 (33.5%) | 8 (3.6%) |
| 45 to 54 Years | 0 (0.0%) | 8 (8.1%) |
| 55 to 64 Years | 44 (40.4%) | 34 (20.5%) |
| 65 to 74 Years | 16 (13.2%) | 0 (0.0%) |
| 75 Years and over | 0 (0.0%) | 18 (7.9%) |
| Total | 177 (18.7%) | 191 (13.5%) |
Income Above Poverty by Sex and Age in Prince Frederick
According to the poverty statistics in Prince Frederick, males aged under 5 years and females aged under 5 years are the age groups that are most secure financially, with 100.0% of males and 100.0% of females in these age groups living above the poverty line.
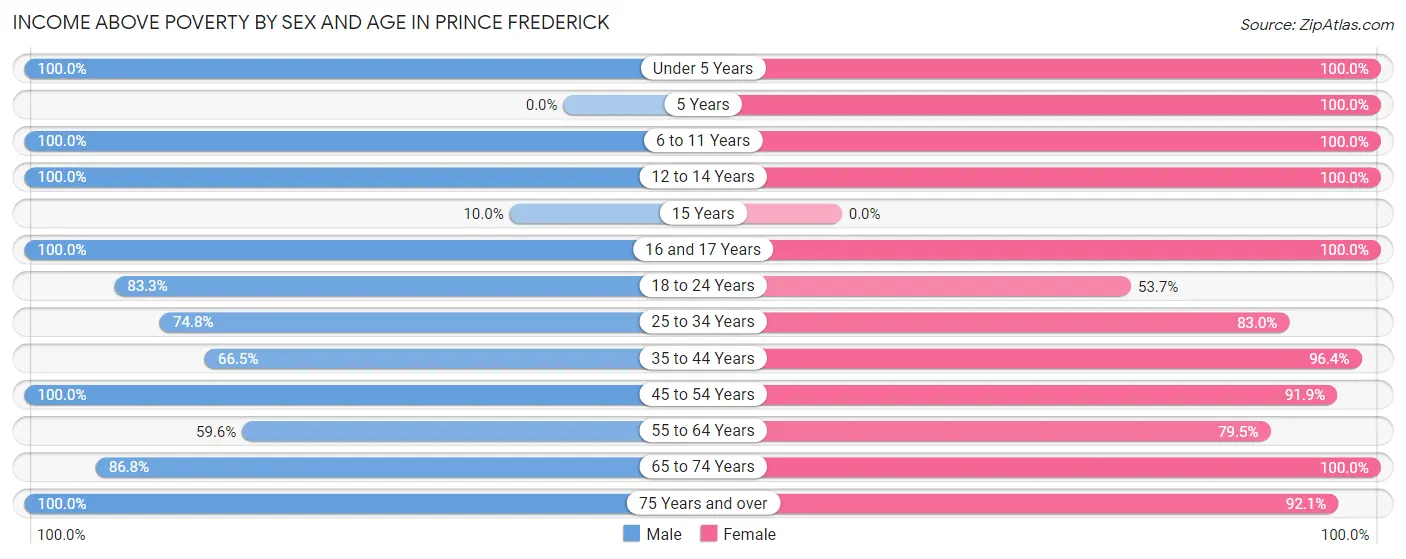
| Age Bracket | Male | Female |
| Under 5 Years | 145 (100.0%) | 35 (100.0%) |
| 5 Years | 0 (0.0%) | 2 (100.0%) |
| 6 to 11 Years | 39 (100.0%) | 110 (100.0%) |
| 12 to 14 Years | 4 (100.0%) | 82 (100.0%) |
| 15 Years | 1 (10.0%) | 0 (0.0%) |
| 16 and 17 Years | 12 (100.0%) | 49 (100.0%) |
| 18 to 24 Years | 45 (83.3%) | 109 (53.7%) |
| 25 to 34 Years | 107 (74.8%) | 142 (83.0%) |
| 35 to 44 Years | 125 (66.5%) | 215 (96.4%) |
| 45 to 54 Years | 74 (100.0%) | 91 (91.9%) |
| 55 to 64 Years | 65 (59.6%) | 132 (79.5%) |
| 65 to 74 Years | 105 (86.8%) | 51 (100.0%) |
| 75 Years and over | 47 (100.0%) | 210 (92.1%) |
| Total | 769 (81.3%) | 1,228 (86.5%) |
Income Below Poverty Among Married-Couple Families in Prince Frederick
The poverty statistics for married-couple families in Prince Frederick show that 7.6% or 28 of the total 370 families live below the poverty line. Families with no children have the highest poverty rate of 17.1%, comprising of 28 families. On the other hand, families with 1 or 2 children have the lowest poverty rate of 0.0%, which includes 0 families.
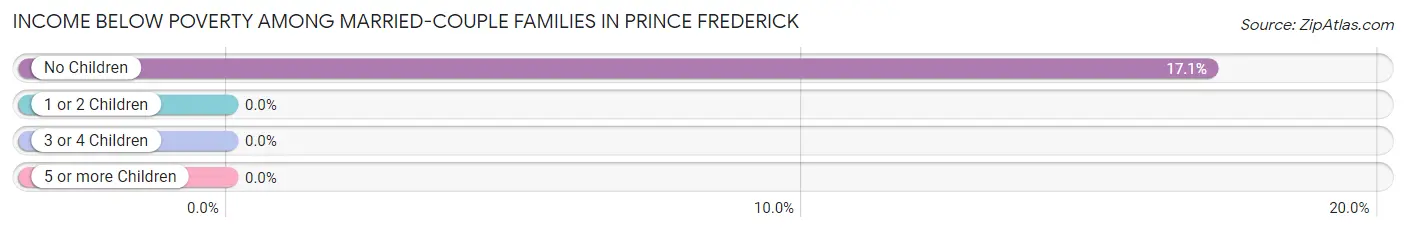
| Children | Above Poverty | Below Poverty |
| No Children | 136 (82.9%) | 28 (17.1%) |
| 1 or 2 Children | 196 (100.0%) | 0 (0.0%) |
| 3 or 4 Children | 10 (100.0%) | 0 (0.0%) |
| 5 or more Children | 0 (0.0%) | 0 (0.0%) |
| Total | 342 (92.4%) | 28 (7.6%) |
Income Below Poverty Among Single-Parent Households in Prince Frederick
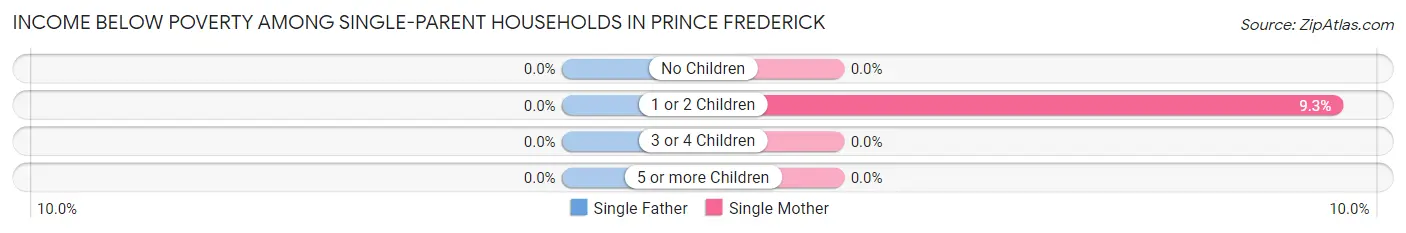
| Children | Single Father | Single Mother |
| No Children | 0 (0.0%) | 0 (0.0%) |
| 1 or 2 Children | 0 (0.0%) | 8 (9.3%) |
| 3 or 4 Children | 0 (0.0%) | 0 (0.0%) |
| 5 or more Children | 0 (0.0%) | 0 (0.0%) |
| Total | 0 (0.0%) | 8 (6.1%) |
Income Below Poverty Among Married-Couple vs Single-Parent Households in Prince Frederick
The poverty data for Prince Frederick shows that 28 of the married-couple family households (7.6%) and 8 of the single-parent households (4.3%) are living below the poverty level. Within the married-couple family households, those with no children have the highest poverty rate, with 28 households (17.1%) falling below the poverty line. Among the single-parent households, those with 1 or 2 children have the highest poverty rate, with 8 household (6.4%) living below poverty.
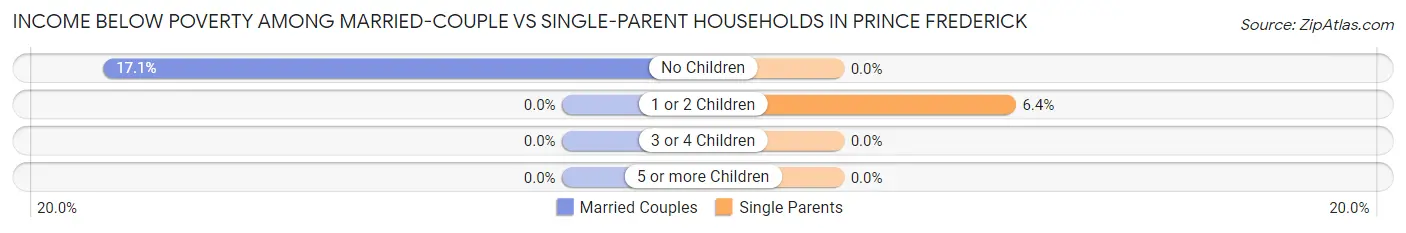
| Children | Married-Couple Families | Single-Parent Households |
| No Children | 28 (17.1%) | 0 (0.0%) |
| 1 or 2 Children | 0 (0.0%) | 8 (6.4%) |
| 3 or 4 Children | 0 (0.0%) | 0 (0.0%) |
| 5 or more Children | 0 (0.0%) | 0 (0.0%) |
| Total | 28 (7.6%) | 8 (4.3%) |
Race in Prince Frederick
The most populous races in Prince Frederick are White / Caucasian (1,436 | 57.7%), Black / African American (703 | 28.2%), and Hispanic or Latino (334 | 13.4%).
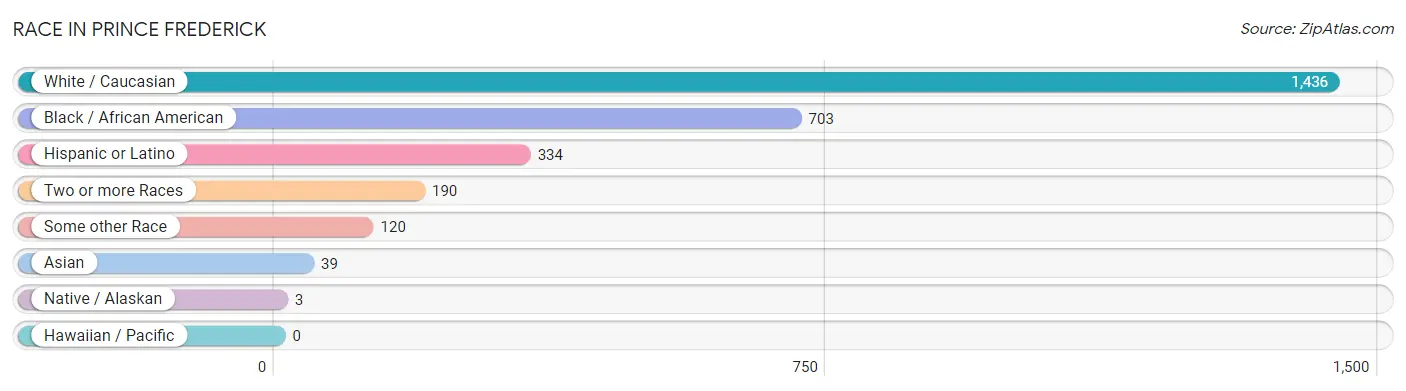
| Race | # Population | % Population |
| Asian | 39 | 1.6% |
| Black / African American | 703 | 28.2% |
| Hawaiian / Pacific | 0 | 0.0% |
| Hispanic or Latino | 334 | 13.4% |
| Native / Alaskan | 3 | 0.1% |
| White / Caucasian | 1,436 | 57.7% |
| Two or more Races | 190 | 7.6% |
| Some other Race | 120 | 4.8% |
| Total | 2,491 | 100.0% |
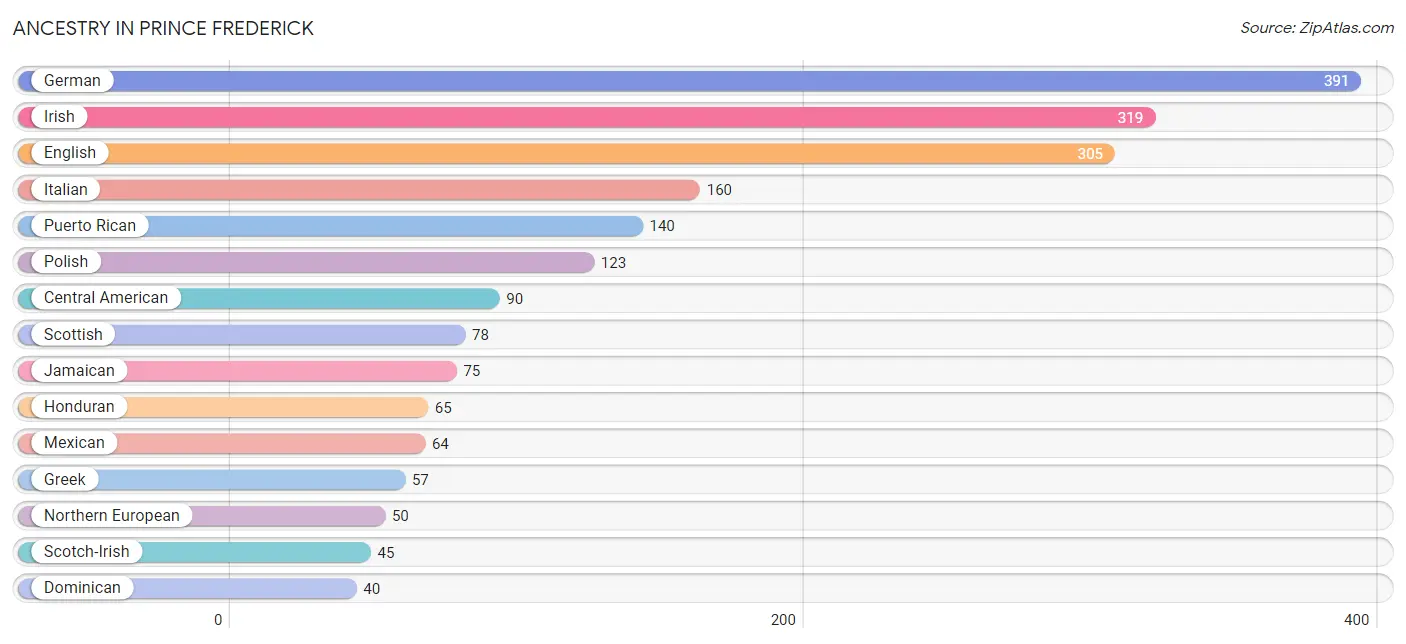
Ancestry in Prince Frederick
The most populous ancestries reported in Prince Frederick are German (391 | 15.7%), Irish (319 | 12.8%), English (305 | 12.2%), Italian (160 | 6.4%), and Puerto Rican (140 | 5.6%), together accounting for 52.8% of all Prince Frederick residents.
| Ancestry | # Population | % Population |
| American | 36 | 1.5% |
| Bulgarian | 7 | 0.3% |
| Burmese | 1 | 0.0% |
| Canadian | 13 | 0.5% |
| Central American | 90 | 3.6% |
| Cherokee | 22 | 0.9% |
| Czechoslovakian | 32 | 1.3% |
| Danish | 6 | 0.2% |
| Dominican | 40 | 1.6% |
| Dutch | 27 | 1.1% |
| English | 305 | 12.2% |
| European | 28 | 1.1% |
| Finnish | 16 | 0.6% |
| French | 19 | 0.8% |
| German | 391 | 15.7% |
| German Russian | 12 | 0.5% |
| Greek | 57 | 2.3% |
| Guatemalan | 4 | 0.2% |
| Honduran | 65 | 2.6% |
| Hungarian | 8 | 0.3% |
| Irish | 319 | 12.8% |
| Italian | 160 | 6.4% |
| Jamaican | 75 | 3.0% |
| Korean | 18 | 0.7% |
| Mexican | 64 | 2.6% |
| Northern European | 50 | 2.0% |
| Norwegian | 4 | 0.2% |
| Pakistani | 14 | 0.6% |
| Polish | 123 | 4.9% |
| Puerto Rican | 140 | 5.6% |
| Romanian | 7 | 0.3% |
| Russian | 19 | 0.8% |
| Salvadoran | 21 | 0.8% |
| Scotch-Irish | 45 | 1.8% |
| Scottish | 78 | 3.1% |
| Slavic | 15 | 0.6% |
| Slovak | 4 | 0.2% |
| Sri Lankan | 24 | 1.0% | View All 38 Rows |
Immigrants in Prince Frederick
The most numerous immigrant groups reported in Prince Frederick came from Latin America (98 | 3.9%), Central America (55 | 2.2%), Caribbean (43 | 1.7%), Asia (39 | 1.6%), and South Eastern Asia (38 | 1.5%), together accounting for 11.0% of all Prince Frederick residents.
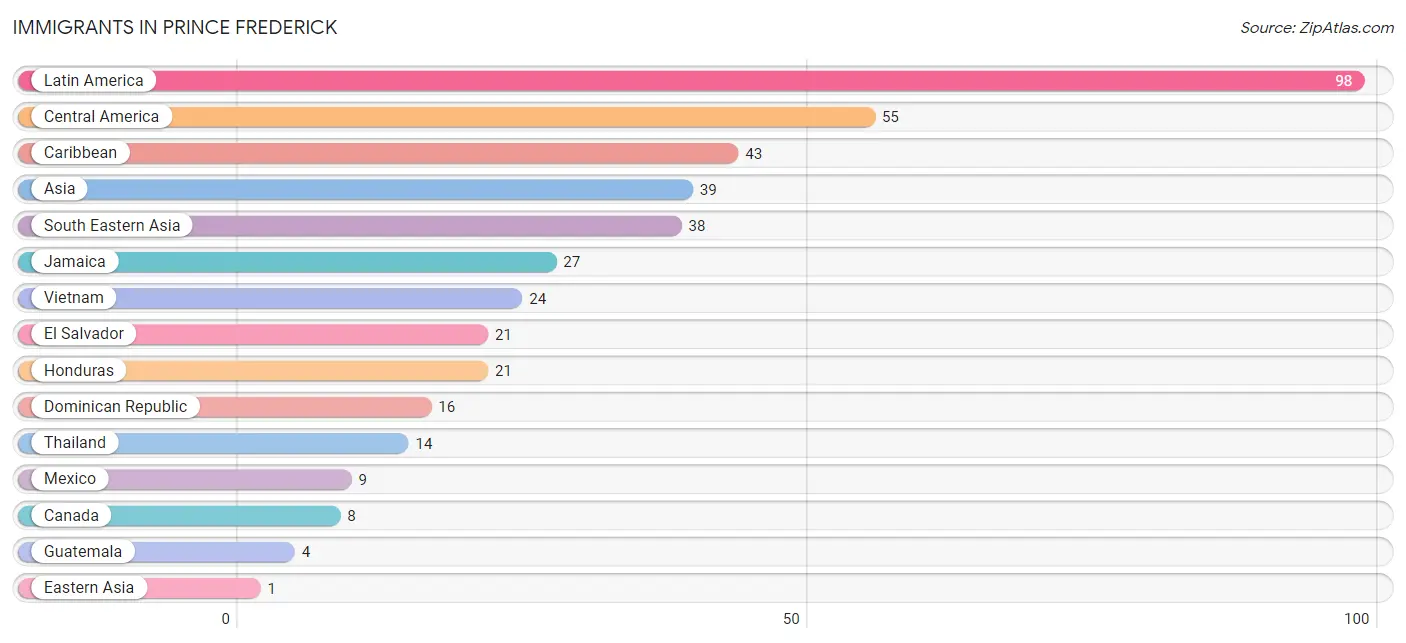
| Immigration Origin | # Population | % Population |
| Asia | 39 | 1.6% |
| Canada | 8 | 0.3% |
| Caribbean | 43 | 1.7% |
| Central America | 55 | 2.2% |
| Dominican Republic | 16 | 0.6% |
| Eastern Asia | 1 | 0.0% |
| El Salvador | 21 | 0.8% |
| Guatemala | 4 | 0.2% |
| Honduras | 21 | 0.8% |
| Jamaica | 27 | 1.1% |
| Korea | 1 | 0.0% |
| Latin America | 98 | 3.9% |
| Mexico | 9 | 0.4% |
| South Eastern Asia | 38 | 1.5% |
| Thailand | 14 | 0.6% |
| Vietnam | 24 | 1.0% | View All 16 Rows |
Sex and Age in Prince Frederick
Sex and Age in Prince Frederick
The most populous age groups in Prince Frederick are Under 5 Years (145 | 14.6%) for men and 75 to 79 Years (169 | 11.3%) for women.
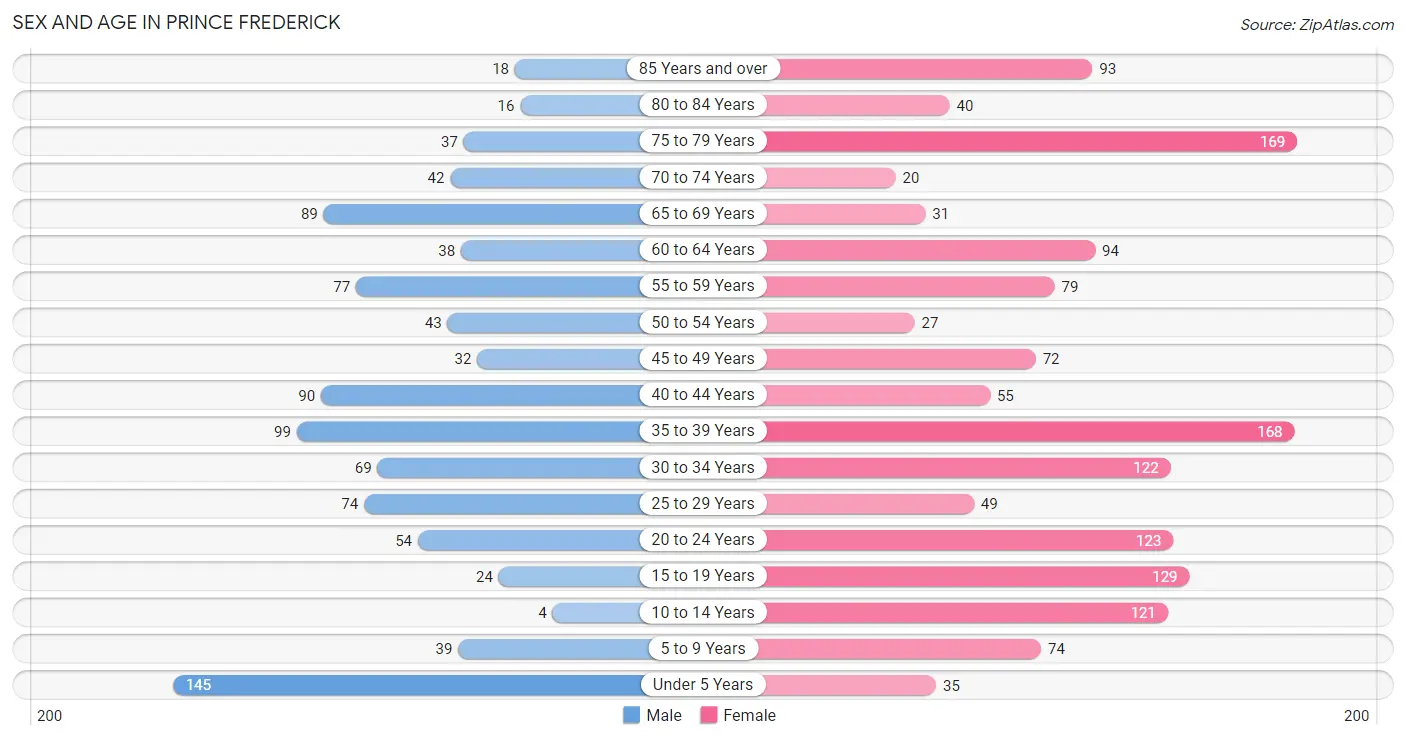
| Age Bracket | Male | Female |
| Under 5 Years | 145 (14.6%) | 35 (2.3%) |
| 5 to 9 Years | 39 (3.9%) | 74 (4.9%) |
| 10 to 14 Years | 4 (0.4%) | 121 (8.1%) |
| 15 to 19 Years | 24 (2.4%) | 129 (8.6%) |
| 20 to 24 Years | 54 (5.4%) | 123 (8.2%) |
| 25 to 29 Years | 74 (7.5%) | 49 (3.3%) |
| 30 to 34 Years | 69 (7.0%) | 122 (8.1%) |
| 35 to 39 Years | 99 (10.0%) | 168 (11.2%) |
| 40 to 44 Years | 90 (9.1%) | 55 (3.7%) |
| 45 to 49 Years | 32 (3.2%) | 72 (4.8%) |
| 50 to 54 Years | 43 (4.3%) | 27 (1.8%) |
| 55 to 59 Years | 77 (7.8%) | 79 (5.3%) |
| 60 to 64 Years | 38 (3.8%) | 94 (6.3%) |
| 65 to 69 Years | 89 (9.0%) | 31 (2.1%) |
| 70 to 74 Years | 42 (4.2%) | 20 (1.3%) |
| 75 to 79 Years | 37 (3.7%) | 169 (11.3%) |
| 80 to 84 Years | 16 (1.6%) | 40 (2.7%) |
| 85 Years and over | 18 (1.8%) | 93 (6.2%) |
| Total | 990 (100.0%) | 1,501 (100.0%) |
Families and Households in Prince Frederick
Median Family Size in Prince Frederick
The median family size in Prince Frederick is 3.13 persons per family, with single female/mother families (130 | 23.4%) accounting for the largest median family size of 3.17 persons per family. On the other hand, single male/father families (56 | 10.1%) represent the smallest median family size with 3.07 persons per family.
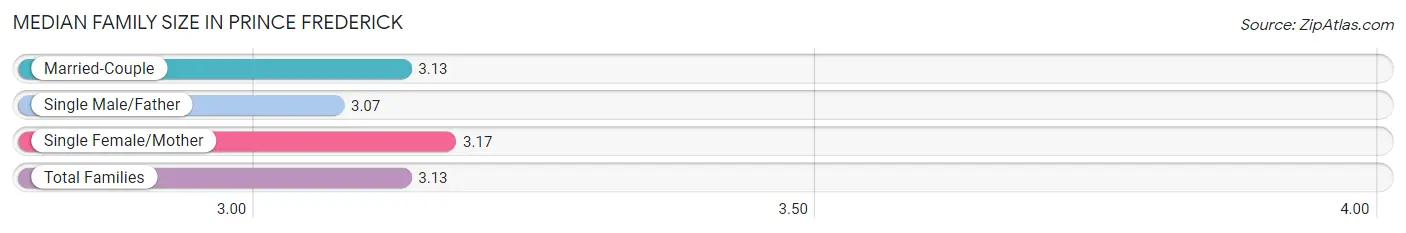
| Family Type | # Families | Family Size |
| Married-Couple | 370 (66.5%) | 3.13 |
| Single Male/Father | 56 (10.1%) | 3.07 |
| Single Female/Mother | 130 (23.4%) | 3.17 |
| Total Families | 556 (100.0%) | 3.13 |
Median Household Size in Prince Frederick
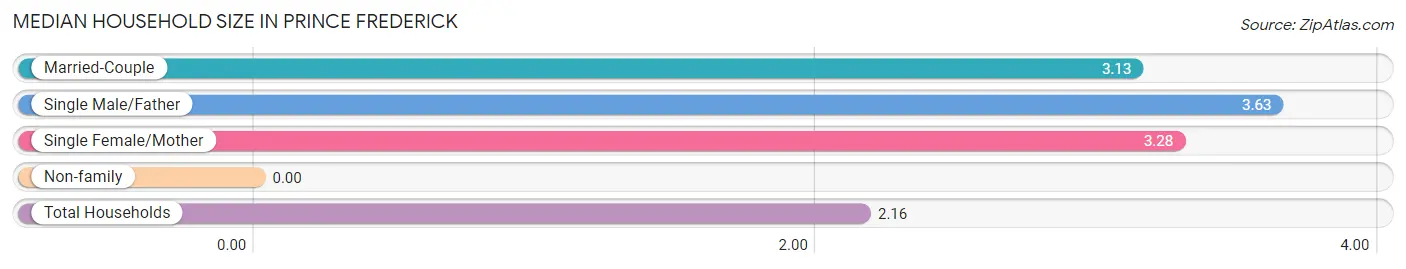
| Household Type | # Households | Household Size |
| Married-Couple | 370 (34.7%) | 3.13 |
| Single Male/Father | 56 (5.2%) | 3.63 |
| Single Female/Mother | 130 (12.2%) | 3.28 |
| Non-family | 510 (47.8%) | - |
| Total Households | 1,066 (100.0%) | 2.16 |
Household Size by Marriage Status in Prince Frederick
Out of a total of 1,066 households in Prince Frederick, 556 (52.2%) are family households, while 510 (47.8%) are nonfamily households. The most numerous type of family households are 2-person households, comprising 189, and the most common type of nonfamily households are 1-person households, comprising 510.
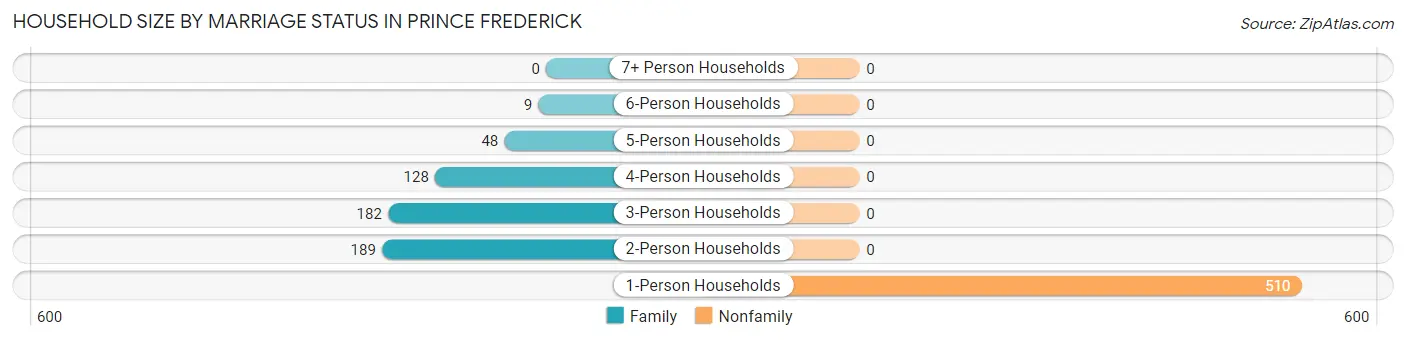
| Household Size | Family Households | Nonfamily Households |
| 1-Person Households | - | 510 (47.8%) |
| 2-Person Households | 189 (17.7%) | 0 (0.0%) |
| 3-Person Households | 182 (17.1%) | 0 (0.0%) |
| 4-Person Households | 128 (12.0%) | 0 (0.0%) |
| 5-Person Households | 48 (4.5%) | 0 (0.0%) |
| 6-Person Households | 9 (0.8%) | 0 (0.0%) |
| 7+ Person Households | 0 (0.0%) | 0 (0.0%) |
| Total | 556 (52.2%) | 510 (47.8%) |
Female Fertility in Prince Frederick
Fertility by Age in Prince Frederick
Average fertility rate in Prince Frederick is 83.0 births per 1,000 women. Women in the age bracket of 35 to 50 years have the highest fertility rate with 135.0 births per 1,000 women. Women in the age bracket of 35 to 50 years acount for 68.3% of all women with births.
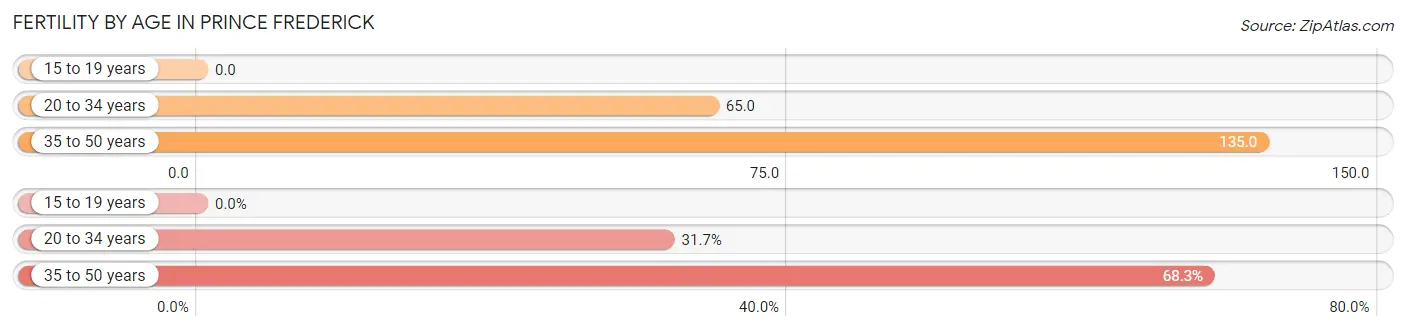
| Age Bracket | Women with Births | Births / 1,000 Women |
| 15 to 19 years | 0 (0.0%) | 0.0 |
| 20 to 34 years | 19 (31.7%) | 65.0 |
| 35 to 50 years | 41 (68.3%) | 135.0 |
| Total | 60 (100.0%) | 83.0 |
Fertility by Age by Marriage Status in Prince Frederick
86.7% of women with births (60) in Prince Frederick are married. The highest percentage of unmarried women with births falls into 20 to 34 years age bracket with 42.1% of them unmarried at the time of birth, while the lowest percentage of unmarried women with births belong to 35 to 50 years age bracket with 0.0% of them unmarried.
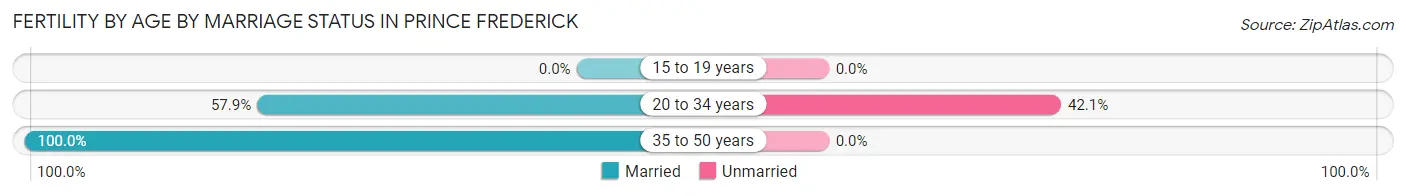
| Age Bracket | Married | Unmarried |
| 15 to 19 years | 0 (0.0%) | 0 (0.0%) |
| 20 to 34 years | 11 (57.9%) | 8 (42.1%) |
| 35 to 50 years | 41 (100.0%) | 0 (0.0%) |
| Total | 52 (86.7%) | 8 (13.3%) |
Fertility by Education in Prince Frederick
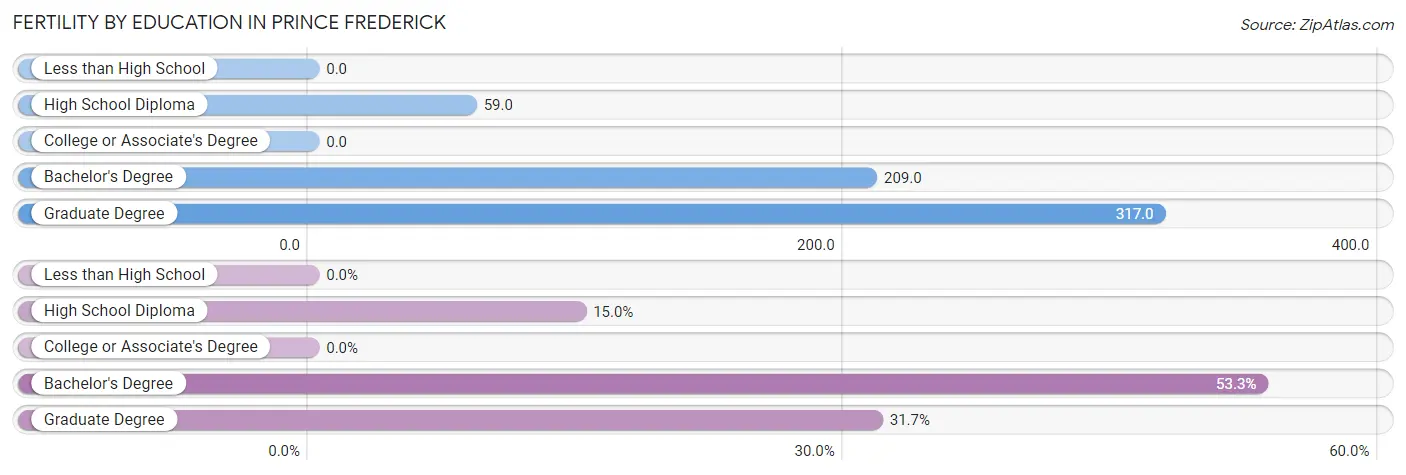
| Educational Attainment | Women with Births | Births / 1,000 Women |
| Less than High School | 0 (0.0%) | 0.0 |
| High School Diploma | 9 (15.0%) | 59.0 |
| College or Associate's Degree | 0 (0.0%) | 0.0 |
| Bachelor's Degree | 32 (53.3%) | 209.0 |
| Graduate Degree | 19 (31.7%) | 317.0 |
| Total | 60 (100.0%) | 83.0 |
Fertility by Education by Marriage Status in Prince Frederick
13.3% of women with births in Prince Frederick are unmarried. Women with the educational attainment of bachelor's degree are most likely to be married with 100.0% of them married at childbirth, while women with the educational attainment of high school diploma are least likely to be married with 88.9% of them unmarried at childbirth.
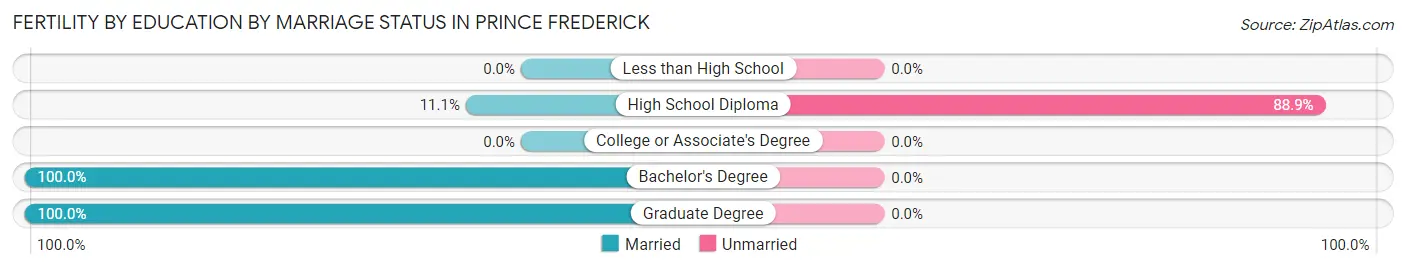
| Educational Attainment | Married | Unmarried |
| Less than High School | 0 (0.0%) | 0 (0.0%) |
| High School Diploma | 1 (11.1%) | 8 (88.9%) |
| College or Associate's Degree | 0 (0.0%) | 0 (0.0%) |
| Bachelor's Degree | 32 (100.0%) | 0 (0.0%) |
| Graduate Degree | 19 (100.0%) | 0 (0.0%) |
| Total | 52 (86.7%) | 8 (13.3%) |
Employment Characteristics in Prince Frederick
Employment by Class of Employer in Prince Frederick
Among the 980 employed individuals in Prince Frederick, private company employees (599 | 61.1%), federal government employees (113 | 11.5%), and local government employees (109 | 11.1%) make up the most common classes of employment.
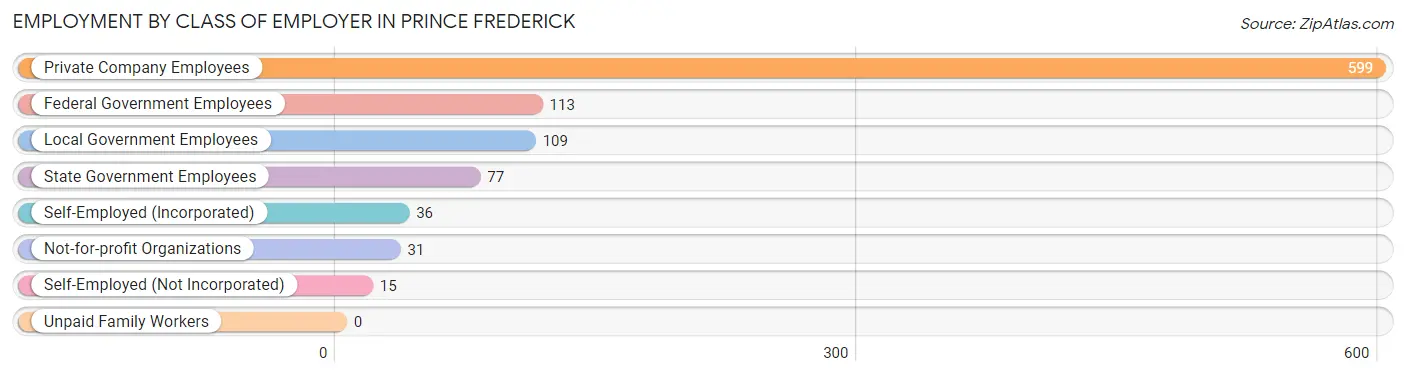
| Employer Class | # Employees | % Employees |
| Private Company Employees | 599 | 61.1% |
| Self-Employed (Incorporated) | 36 | 3.7% |
| Self-Employed (Not Incorporated) | 15 | 1.5% |
| Not-for-profit Organizations | 31 | 3.2% |
| Local Government Employees | 109 | 11.1% |
| State Government Employees | 77 | 7.9% |
| Federal Government Employees | 113 | 11.5% |
| Unpaid Family Workers | 0 | 0.0% |
| Total | 980 | 100.0% |
Employment Status by Age in Prince Frederick
According to the labor force statistics for Prince Frederick, out of the total population over 16 years of age (2,063), 56.7% or 1,170 individuals are in the labor force, with 10.1% or 118 of them unemployed. The age group with the highest labor force participation rate is 20 to 24 years, with 89.3% or 158 individuals in the labor force. Within the labor force, the 16 to 19 years age range has the highest percentage of unemployed individuals, with 65.2% or 58 of them being unemployed.
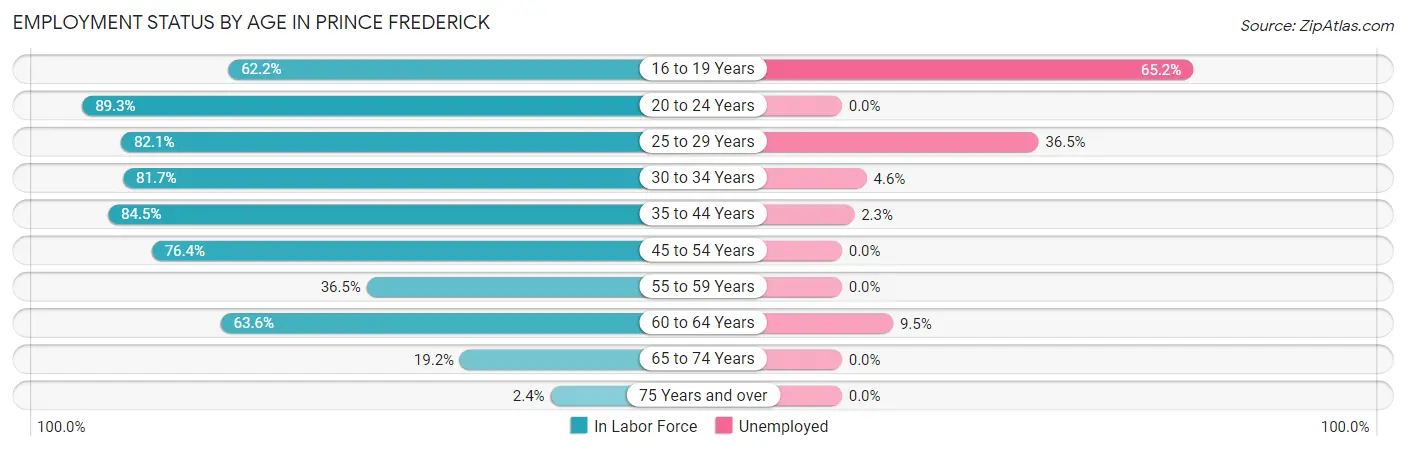
| Age Bracket | In Labor Force | Unemployed |
| 16 to 19 Years | 89 (62.2%) | 58 (65.2%) |
| 20 to 24 Years | 158 (89.3%) | 0 (0.0%) |
| 25 to 29 Years | 101 (82.1%) | 37 (36.5%) |
| 30 to 34 Years | 156 (81.7%) | 7 (4.6%) |
| 35 to 44 Years | 348 (84.5%) | 8 (2.3%) |
| 45 to 54 Years | 133 (76.4%) | 0 (0.0%) |
| 55 to 59 Years | 57 (36.5%) | 0 (0.0%) |
| 60 to 64 Years | 84 (63.6%) | 8 (9.5%) |
| 65 to 74 Years | 35 (19.2%) | 0 (0.0%) |
| 75 Years and over | 9 (2.4%) | 0 (0.0%) |
| Total | 1,170 (56.7%) | 118 (10.1%) |
Employment Status by Educational Attainment in Prince Frederick
According to labor force statistics for Prince Frederick, 74.0% of individuals (879) out of the total population between 25 and 64 years of age (1,188) are in the labor force, with 6.7% or 59 of them being unemployed. The group with the highest labor force participation rate are those with the educational attainment of bachelor's degree or higher, with 85.9% or 267 individuals in the labor force. Within the labor force, individuals with high school diploma education have the highest percentage of unemployment, with 26.5% or 49 of them being unemployed.
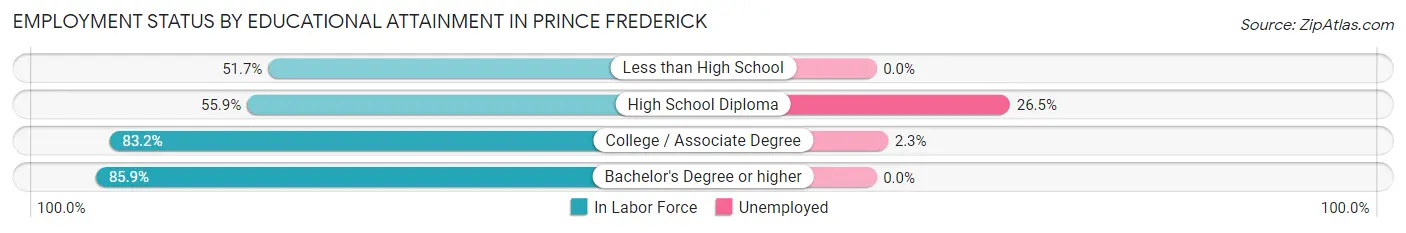
| Educational Attainment | In Labor Force | Unemployed |
| Less than High School | 45 (51.7%) | 0 (0.0%) |
| High School Diploma | 185 (55.9%) | 88 (26.5%) |
| College / Associate Degree | 382 (83.2%) | 11 (2.3%) |
| Bachelor's Degree or higher | 267 (85.9%) | 0 (0.0%) |
| Total | 879 (74.0%) | 80 (6.7%) |
Employment Occupations by Sex in Prince Frederick
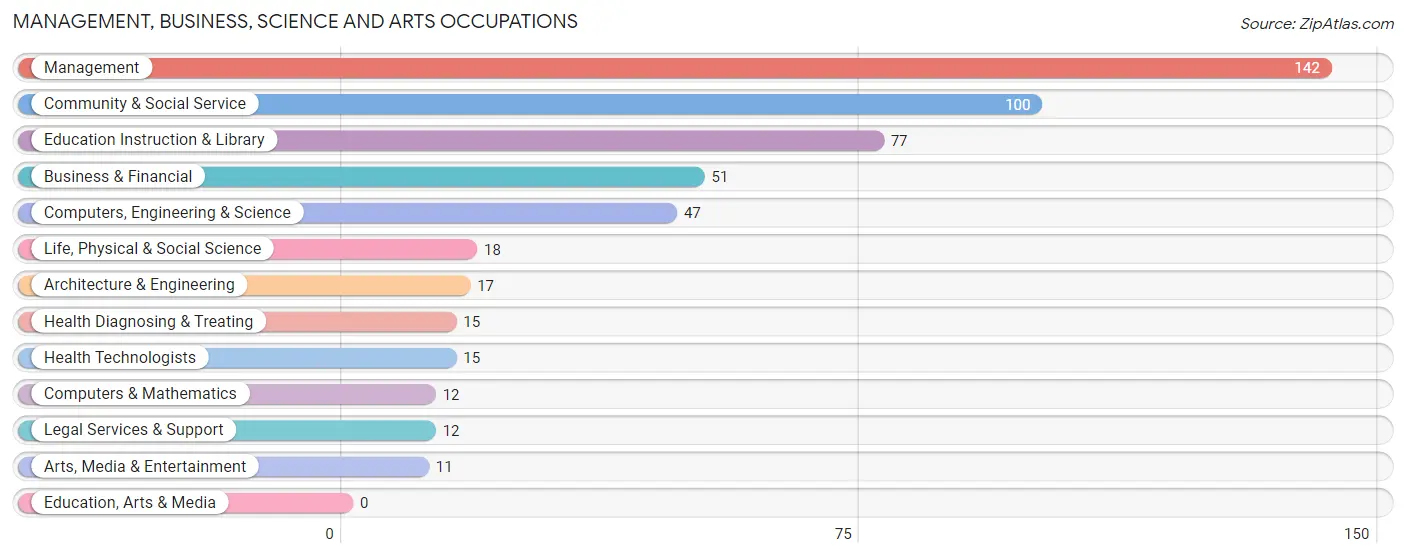
Management, Business, Science and Arts Occupations
The most common Management, Business, Science and Arts occupations in Prince Frederick are Management (142 | 13.9%), Community & Social Service (100 | 9.8%), Education Instruction & Library (77 | 7.5%), Business & Financial (51 | 5.0%), and Computers, Engineering & Science (47 | 4.6%).
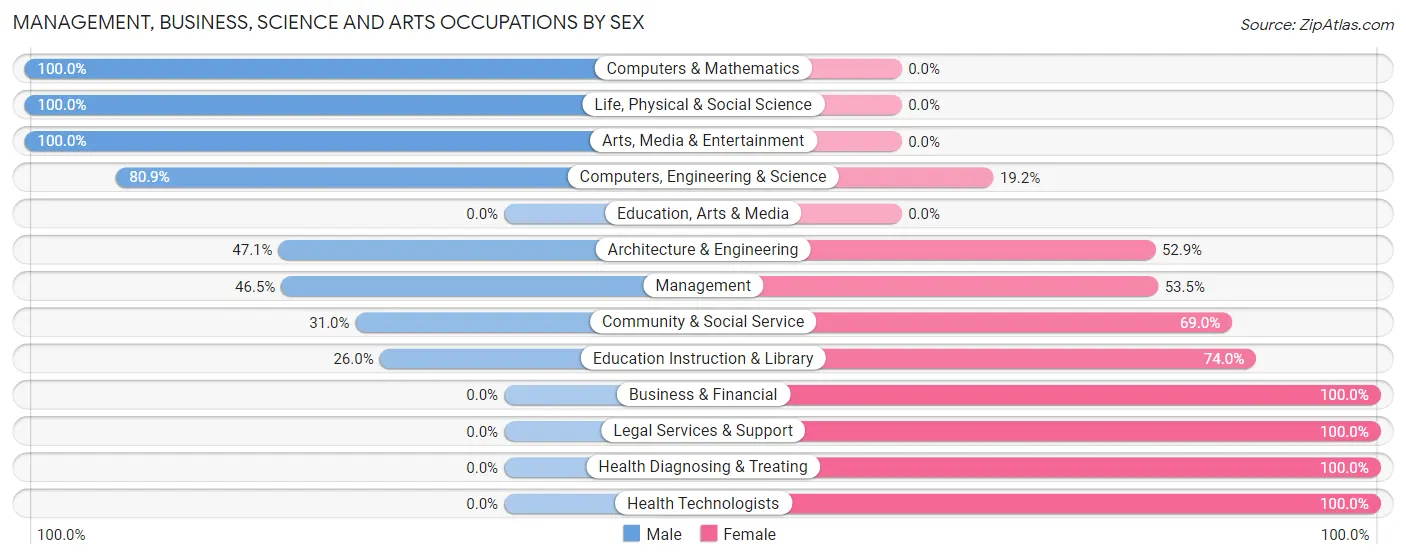
Management, Business, Science and Arts Occupations by Sex
Within the Management, Business, Science and Arts occupations in Prince Frederick, the most male-oriented occupations are Computers & Mathematics (100.0%), Life, Physical & Social Science (100.0%), and Arts, Media & Entertainment (100.0%), while the most female-oriented occupations are Business & Financial (100.0%), Legal Services & Support (100.0%), and Health Diagnosing & Treating (100.0%).
| Occupation | Male | Female |
| Management | 66 (46.5%) | 76 (53.5%) |
| Business & Financial | 0 (0.0%) | 51 (100.0%) |
| Computers, Engineering & Science | 38 (80.8%) | 9 (19.2%) |
| Computers & Mathematics | 12 (100.0%) | 0 (0.0%) |
| Architecture & Engineering | 8 (47.1%) | 9 (52.9%) |
| Life, Physical & Social Science | 18 (100.0%) | 0 (0.0%) |
| Community & Social Service | 31 (31.0%) | 69 (69.0%) |
| Education, Arts & Media | 0 (0.0%) | 0 (0.0%) |
| Legal Services & Support | 0 (0.0%) | 12 (100.0%) |
| Education Instruction & Library | 20 (26.0%) | 57 (74.0%) |
| Arts, Media & Entertainment | 11 (100.0%) | 0 (0.0%) |
| Health Diagnosing & Treating | 0 (0.0%) | 15 (100.0%) |
| Health Technologists | 0 (0.0%) | 15 (100.0%) |
| Total (Category) | 135 (38.0%) | 220 (62.0%) |
| Total (Overall) | 390 (38.1%) | 635 (62.0%) |
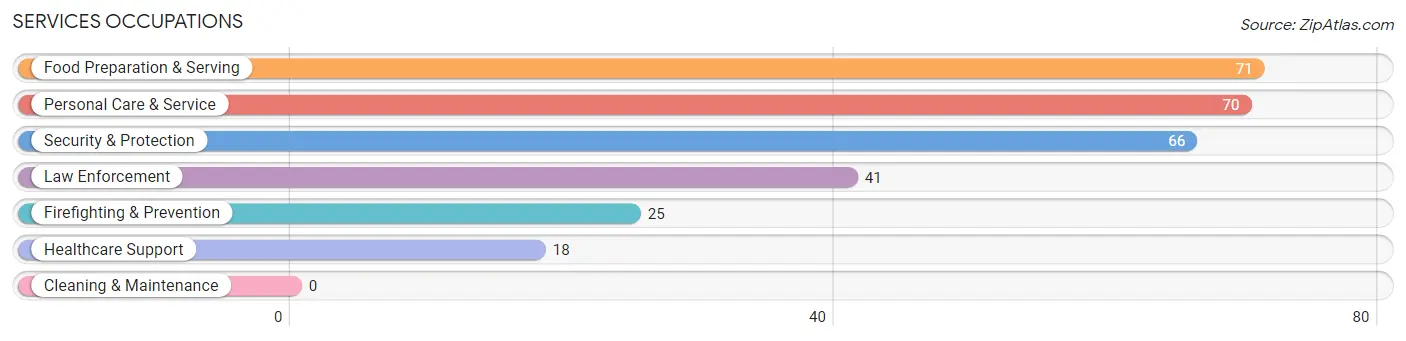
Services Occupations
The most common Services occupations in Prince Frederick are Food Preparation & Serving (71 | 6.9%), Personal Care & Service (70 | 6.8%), Security & Protection (66 | 6.4%), Law Enforcement (41 | 4.0%), and Firefighting & Prevention (25 | 2.4%).
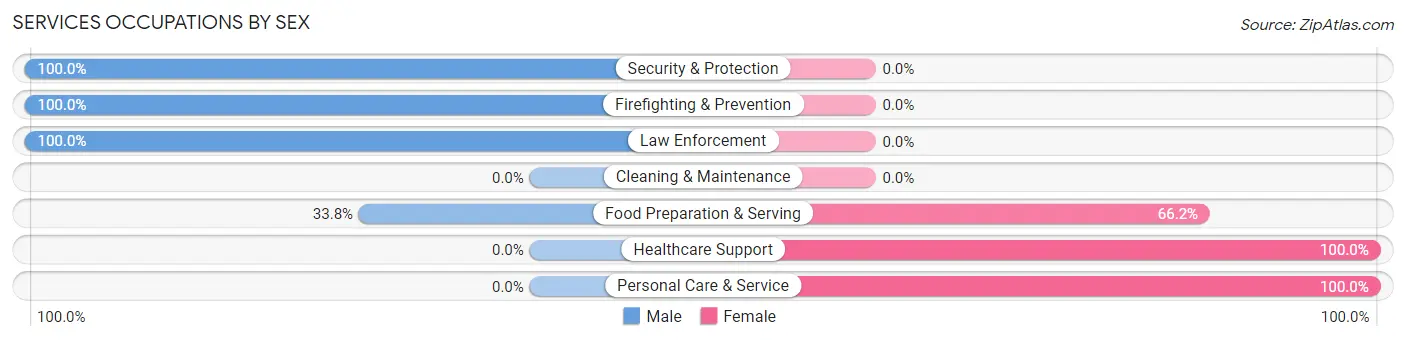
Services Occupations by Sex
Within the Services occupations in Prince Frederick, the most male-oriented occupations are Security & Protection (100.0%), Firefighting & Prevention (100.0%), and Law Enforcement (100.0%), while the most female-oriented occupations are Healthcare Support (100.0%), Personal Care & Service (100.0%), and Food Preparation & Serving (66.2%).
| Occupation | Male | Female |
| Healthcare Support | 0 (0.0%) | 18 (100.0%) |
| Security & Protection | 66 (100.0%) | 0 (0.0%) |
| Firefighting & Prevention | 25 (100.0%) | 0 (0.0%) |
| Law Enforcement | 41 (100.0%) | 0 (0.0%) |
| Food Preparation & Serving | 24 (33.8%) | 47 (66.2%) |
| Cleaning & Maintenance | 0 (0.0%) | 0 (0.0%) |
| Personal Care & Service | 0 (0.0%) | 70 (100.0%) |
| Total (Category) | 90 (40.0%) | 135 (60.0%) |
| Total (Overall) | 390 (38.1%) | 635 (62.0%) |
Sales and Office Occupations
The most common Sales and Office occupations in Prince Frederick are Office & Administration (148 | 14.4%), and Sales & Related (137 | 13.4%).
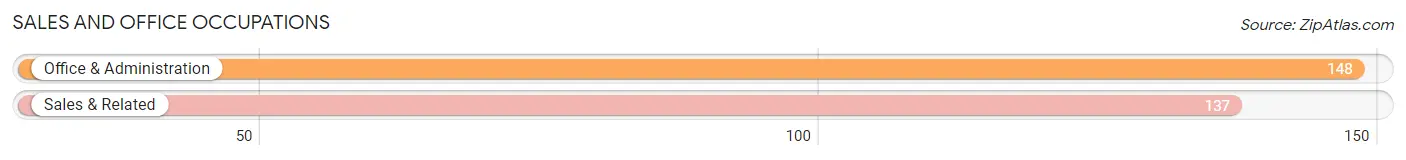
Sales and Office Occupations by Sex
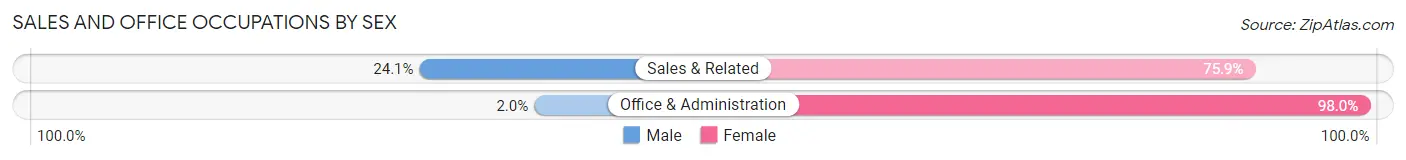
| Occupation | Male | Female |
| Sales & Related | 33 (24.1%) | 104 (75.9%) |
| Office & Administration | 3 (2.0%) | 145 (98.0%) |
| Total (Category) | 36 (12.6%) | 249 (87.4%) |
| Total (Overall) | 390 (38.1%) | 635 (62.0%) |
Natural Resources, Construction and Maintenance Occupations
The most common Natural Resources, Construction and Maintenance occupations in Prince Frederick are Construction & Extraction (71 | 6.9%), Installation, Maintenance & Repair (49 | 4.8%), and Farming, Fishing & Forestry (12 | 1.2%).
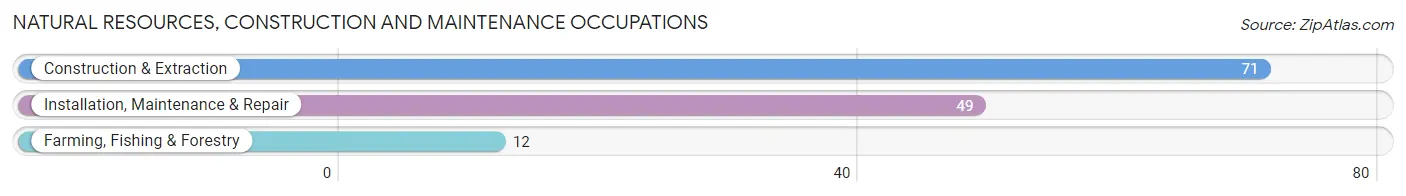
Natural Resources, Construction and Maintenance Occupations by Sex
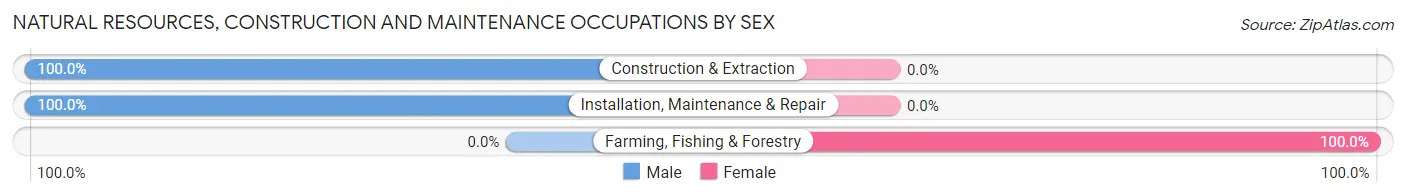
| Occupation | Male | Female |
| Farming, Fishing & Forestry | 0 (0.0%) | 12 (100.0%) |
| Construction & Extraction | 71 (100.0%) | 0 (0.0%) |
| Installation, Maintenance & Repair | 49 (100.0%) | 0 (0.0%) |
| Total (Category) | 120 (90.9%) | 12 (9.1%) |
| Total (Overall) | 390 (38.1%) | 635 (62.0%) |
Production, Transportation and Moving Occupations
The most common Production, Transportation and Moving occupations in Prince Frederick are Material Moving (19 | 1.8%), and Production (9 | 0.9%).
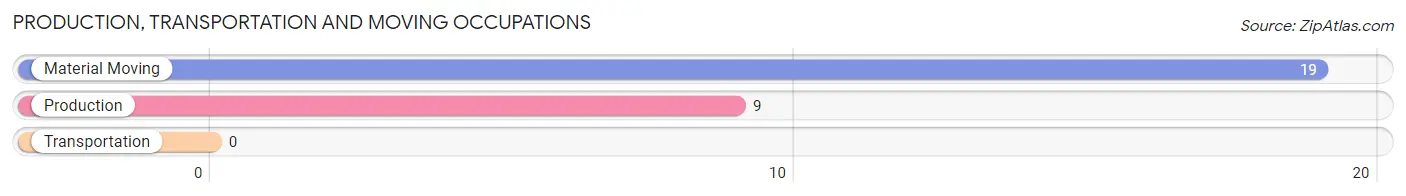
Production, Transportation and Moving Occupations by Sex
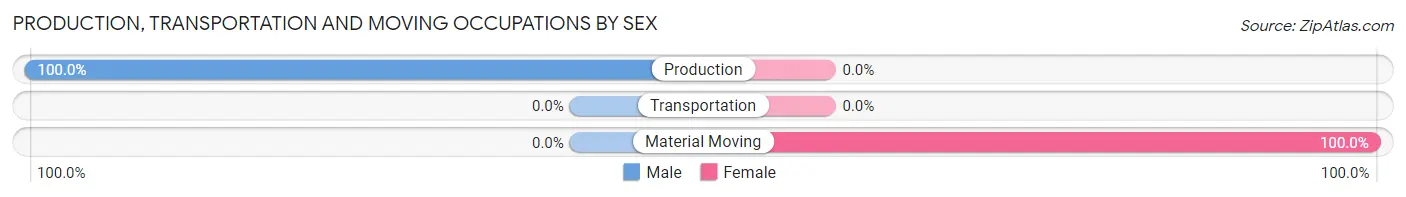
| Occupation | Male | Female |
| Production | 9 (100.0%) | 0 (0.0%) |
| Transportation | 0 (0.0%) | 0 (0.0%) |
| Material Moving | 0 (0.0%) | 19 (100.0%) |
| Total (Category) | 9 (32.1%) | 19 (67.9%) |
| Total (Overall) | 390 (38.1%) | 635 (62.0%) |
Employment Industries by Sex in Prince Frederick
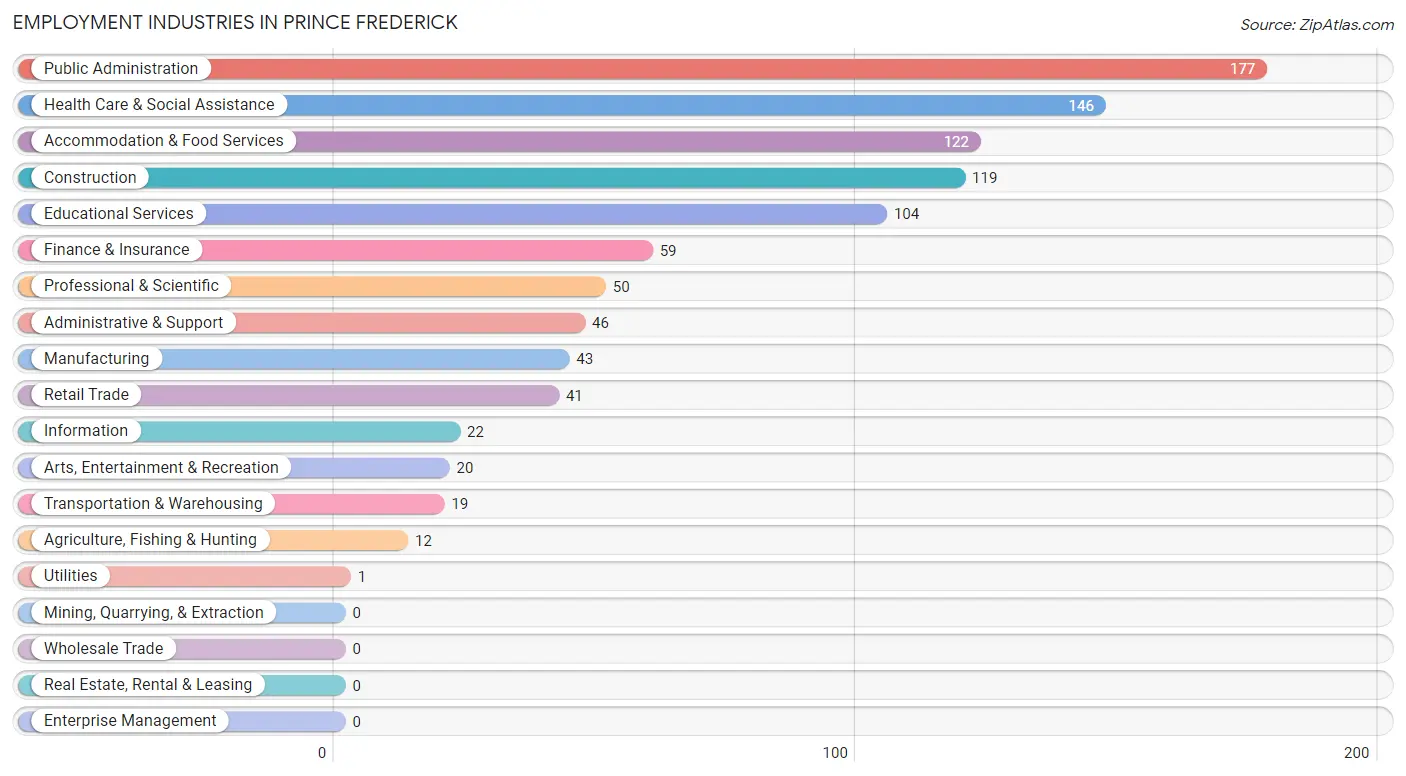
Employment Industries in Prince Frederick
The major employment industries in Prince Frederick include Public Administration (177 | 17.3%), Health Care & Social Assistance (146 | 14.2%), Accommodation & Food Services (122 | 11.9%), Construction (119 | 11.6%), and Educational Services (104 | 10.2%).
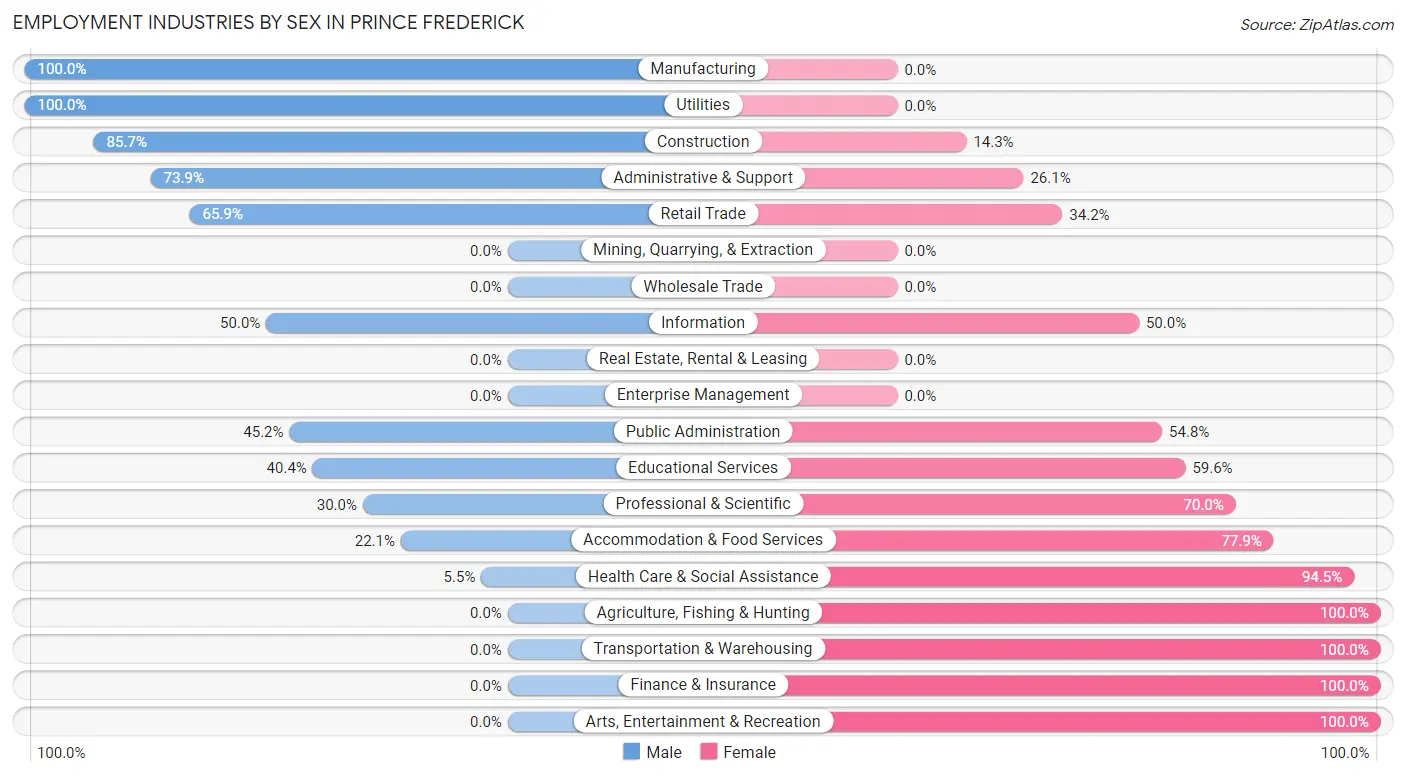
Employment Industries by Sex in Prince Frederick
The Prince Frederick industries that see more men than women are Manufacturing (100.0%), Utilities (100.0%), and Construction (85.7%), whereas the industries that tend to have a higher number of women are Agriculture, Fishing & Hunting (100.0%), Transportation & Warehousing (100.0%), and Finance & Insurance (100.0%).
| Industry | Male | Female |
| Agriculture, Fishing & Hunting | 0 (0.0%) | 12 (100.0%) |
| Mining, Quarrying, & Extraction | 0 (0.0%) | 0 (0.0%) |
| Construction | 102 (85.7%) | 17 (14.3%) |
| Manufacturing | 43 (100.0%) | 0 (0.0%) |
| Wholesale Trade | 0 (0.0%) | 0 (0.0%) |
| Retail Trade | 27 (65.8%) | 14 (34.2%) |
| Transportation & Warehousing | 0 (0.0%) | 19 (100.0%) |
| Utilities | 1 (100.0%) | 0 (0.0%) |
| Information | 11 (50.0%) | 11 (50.0%) |
| Finance & Insurance | 0 (0.0%) | 59 (100.0%) |
| Real Estate, Rental & Leasing | 0 (0.0%) | 0 (0.0%) |
| Professional & Scientific | 15 (30.0%) | 35 (70.0%) |
| Enterprise Management | 0 (0.0%) | 0 (0.0%) |
| Administrative & Support | 34 (73.9%) | 12 (26.1%) |
| Educational Services | 42 (40.4%) | 62 (59.6%) |
| Health Care & Social Assistance | 8 (5.5%) | 138 (94.5%) |
| Arts, Entertainment & Recreation | 0 (0.0%) | 20 (100.0%) |
| Accommodation & Food Services | 27 (22.1%) | 95 (77.9%) |
| Public Administration | 80 (45.2%) | 97 (54.8%) |
| Total | 390 (38.1%) | 635 (62.0%) |
Education in Prince Frederick
School Enrollment in Prince Frederick
The most common levels of schooling among the 497 students in Prince Frederick are high school (130 | 26.2%), college / undergraduate (75 | 15.1%), and middle school (73 | 14.7%).
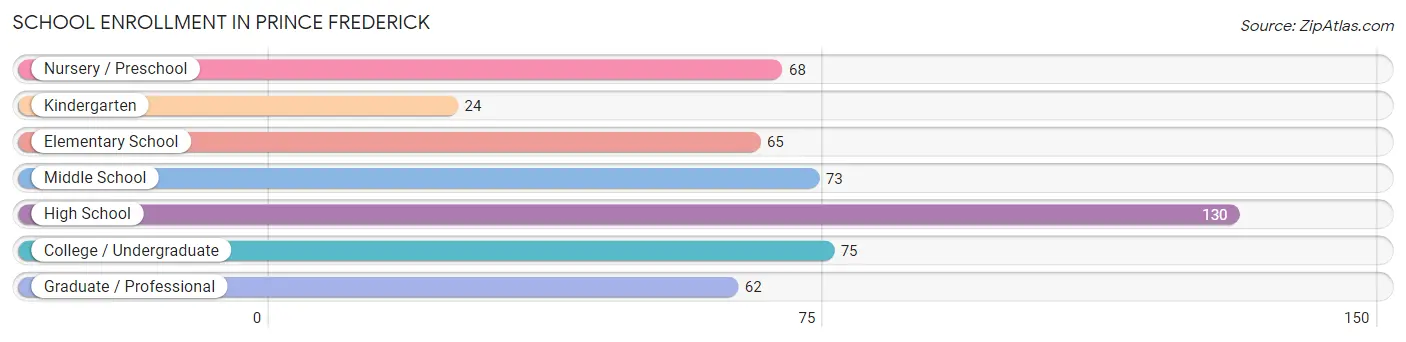
| School Level | # Students | % Students |
| Nursery / Preschool | 68 | 13.7% |
| Kindergarten | 24 | 4.8% |
| Elementary School | 65 | 13.1% |
| Middle School | 73 | 14.7% |
| High School | 130 | 26.2% |
| College / Undergraduate | 75 | 15.1% |
| Graduate / Professional | 62 | 12.5% |
| Total | 497 | 100.0% |
School Enrollment by Age by Funding Source in Prince Frederick
Out of a total of 497 students who are enrolled in schools in Prince Frederick, 118 (23.7%) attend a private institution, while the remaining 379 (76.3%) are enrolled in public schools. The age group of 3 to 4 year olds has the highest likelihood of being enrolled in private schools, with 48 (88.9% in the age bracket) enrolled. Conversely, the age group of 10 to 14 year olds has the lowest likelihood of being enrolled in a private school, with 125 (100.0% in the age bracket) attending a public institution.
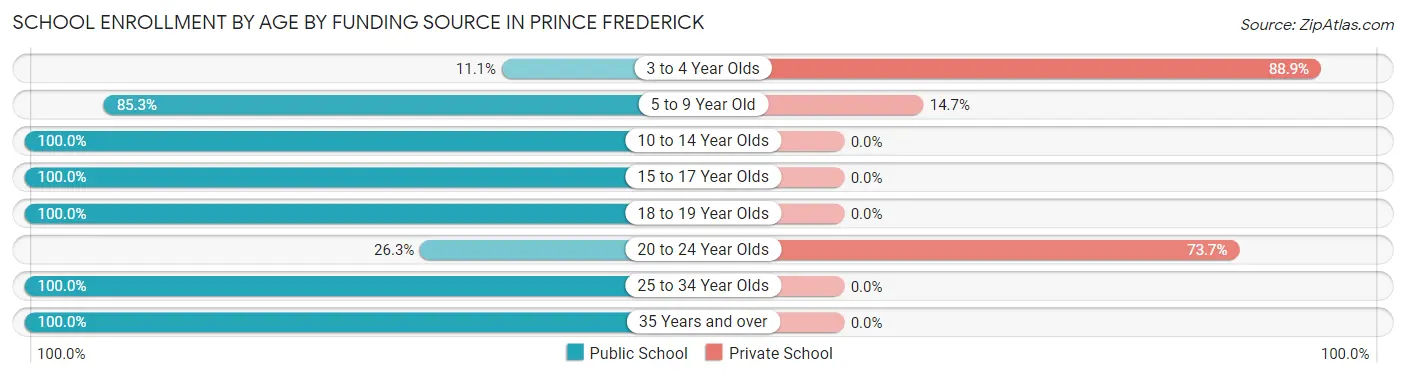
| Age Bracket | Public School | Private School |
| 3 to 4 Year Olds | 6 (11.1%) | 48 (88.9%) |
| 5 to 9 Year Old | 81 (85.3%) | 14 (14.7%) |
| 10 to 14 Year Olds | 125 (100.0%) | 0 (0.0%) |
| 15 to 17 Year Olds | 71 (100.0%) | 0 (0.0%) |
| 18 to 19 Year Olds | 15 (100.0%) | 0 (0.0%) |
| 20 to 24 Year Olds | 20 (26.3%) | 56 (73.7%) |
| 25 to 34 Year Olds | 30 (100.0%) | 0 (0.0%) |
| 35 Years and over | 31 (100.0%) | 0 (0.0%) |
| Total | 379 (76.3%) | 118 (23.7%) |
Educational Attainment by Field of Study in Prince Frederick
Arts & humanities (80 | 22.2%), education (75 | 20.8%), business (55 | 15.2%), science & technology (36 | 10.0%), and engineering (29 | 8.0%) are the most common fields of study among 361 individuals in Prince Frederick who have obtained a bachelor's degree or higher.
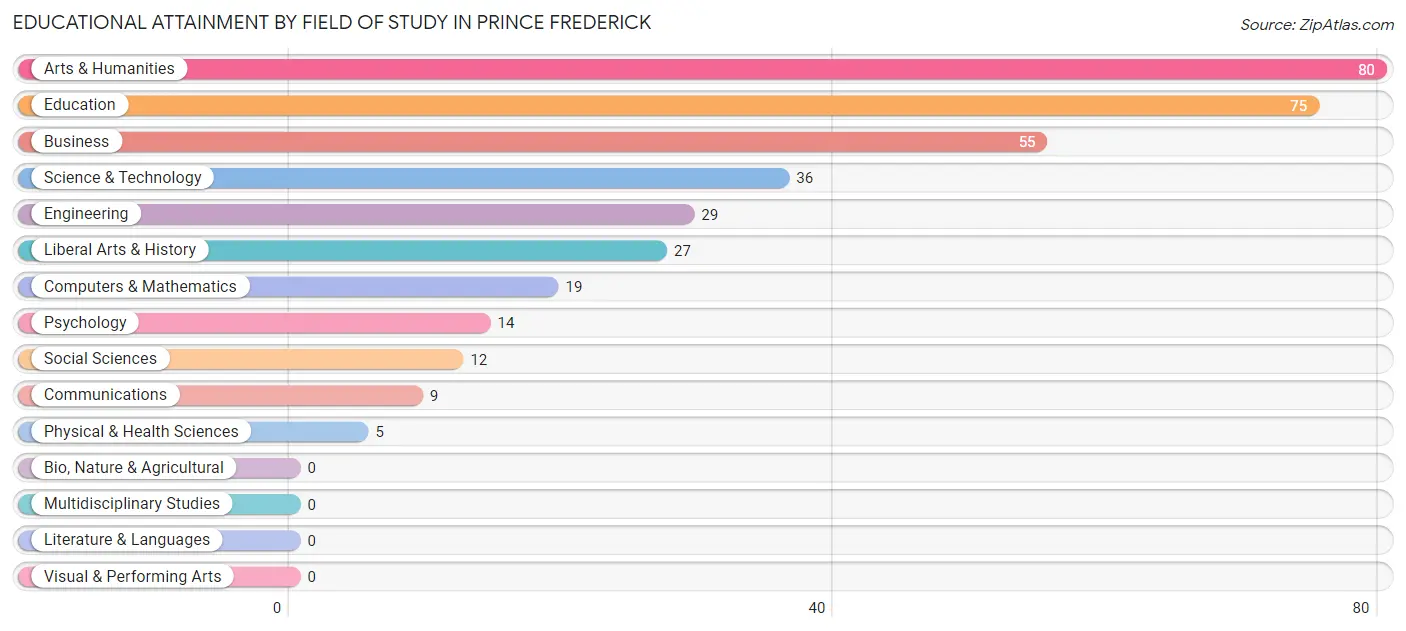
| Field of Study | # Graduates | % Graduates |
| Computers & Mathematics | 19 | 5.3% |
| Bio, Nature & Agricultural | 0 | 0.0% |
| Physical & Health Sciences | 5 | 1.4% |
| Psychology | 14 | 3.9% |
| Social Sciences | 12 | 3.3% |
| Engineering | 29 | 8.0% |
| Multidisciplinary Studies | 0 | 0.0% |
| Science & Technology | 36 | 10.0% |
| Business | 55 | 15.2% |
| Education | 75 | 20.8% |
| Literature & Languages | 0 | 0.0% |
| Liberal Arts & History | 27 | 7.5% |
| Visual & Performing Arts | 0 | 0.0% |
| Communications | 9 | 2.5% |
| Arts & Humanities | 80 | 22.2% |
| Total | 361 | 100.0% |
Transportation & Commute in Prince Frederick
Vehicle Availability by Sex in Prince Frederick
The most prevalent vehicle ownership categories in Prince Frederick are males with 2 vehicles (228, accounting for 58.9%) and females with 2 vehicles (241, making up 39.6%).
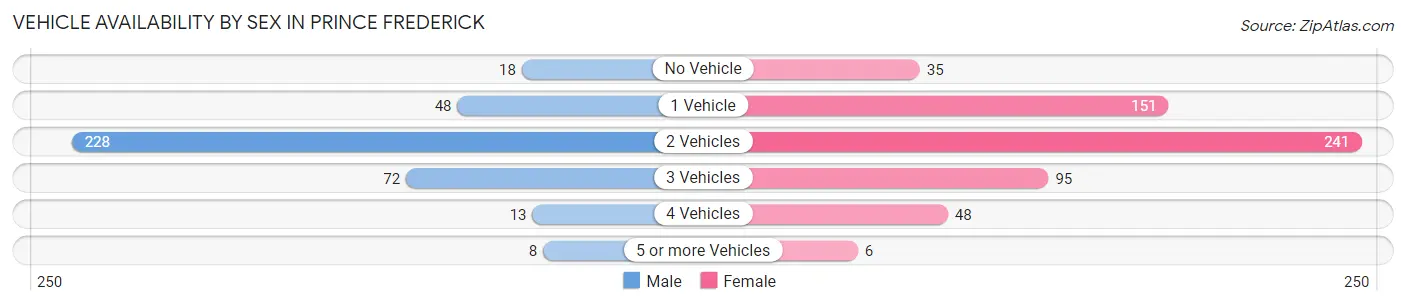
| Vehicles Available | Male | Female |
| No Vehicle | 18 (4.6%) | 35 (6.1%) |
| 1 Vehicle | 48 (12.4%) | 151 (26.2%) |
| 2 Vehicles | 228 (58.9%) | 241 (41.8%) |
| 3 Vehicles | 72 (18.6%) | 95 (16.5%) |
| 4 Vehicles | 13 (3.4%) | 48 (8.3%) |
| 5 or more Vehicles | 8 (2.1%) | 6 (1.0%) |
| Total | 387 (100.0%) | 576 (100.0%) |
Commute Time in Prince Frederick
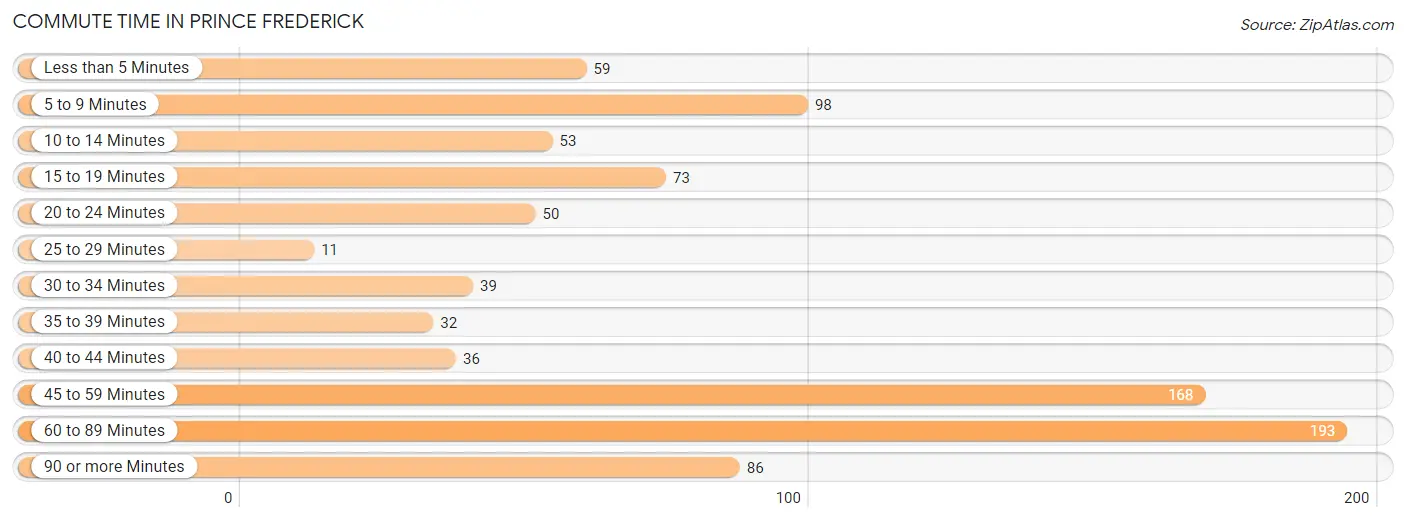
The most frequently occuring commute durations in Prince Frederick are 60 to 89 minutes (193 commuters, 21.5%), 45 to 59 minutes (168 commuters, 18.7%), and 5 to 9 minutes (98 commuters, 10.9%).
| Commute Time | # Commuters | % Commuters |
| Less than 5 Minutes | 59 | 6.6% |
| 5 to 9 Minutes | 98 | 10.9% |
| 10 to 14 Minutes | 53 | 5.9% |
| 15 to 19 Minutes | 73 | 8.1% |
| 20 to 24 Minutes | 50 | 5.6% |
| 25 to 29 Minutes | 11 | 1.2% |
| 30 to 34 Minutes | 39 | 4.3% |
| 35 to 39 Minutes | 32 | 3.6% |
| 40 to 44 Minutes | 36 | 4.0% |
| 45 to 59 Minutes | 168 | 18.7% |
| 60 to 89 Minutes | 193 | 21.5% |
| 90 or more Minutes | 86 | 9.6% |
Commute Time by Sex in Prince Frederick
The most common commute times in Prince Frederick are 45 to 59 minutes (109 commuters, 28.5%) for males and 60 to 89 minutes (126 commuters, 24.5%) for females.
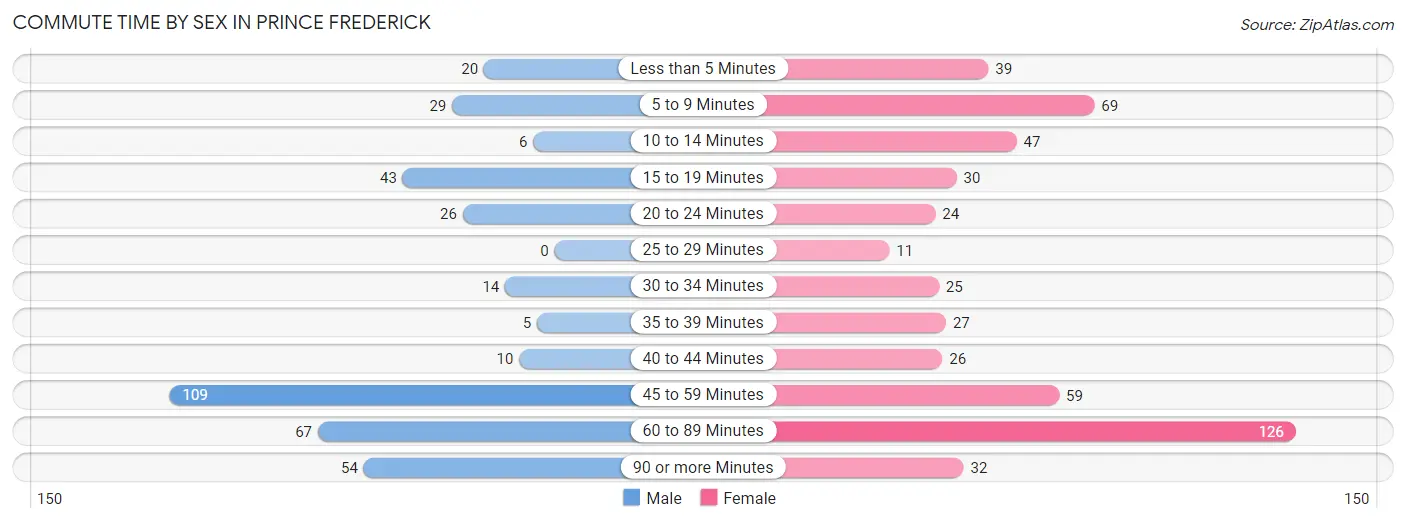
| Commute Time | Male | Female |
| Less than 5 Minutes | 20 (5.2%) | 39 (7.6%) |
| 5 to 9 Minutes | 29 (7.6%) | 69 (13.4%) |
| 10 to 14 Minutes | 6 (1.6%) | 47 (9.1%) |
| 15 to 19 Minutes | 43 (11.2%) | 30 (5.8%) |
| 20 to 24 Minutes | 26 (6.8%) | 24 (4.7%) |
| 25 to 29 Minutes | 0 (0.0%) | 11 (2.1%) |
| 30 to 34 Minutes | 14 (3.7%) | 25 (4.9%) |
| 35 to 39 Minutes | 5 (1.3%) | 27 (5.2%) |
| 40 to 44 Minutes | 10 (2.6%) | 26 (5.1%) |
| 45 to 59 Minutes | 109 (28.5%) | 59 (11.5%) |
| 60 to 89 Minutes | 67 (17.5%) | 126 (24.5%) |
| 90 or more Minutes | 54 (14.1%) | 32 (6.2%) |
Time of Departure to Work by Sex in Prince Frederick
The most frequent times of departure to work in Prince Frederick are 12:00 AM to 4:59 AM (84, 21.9%) for males and 7:00 AM to 7:29 AM (118, 22.9%) for females.
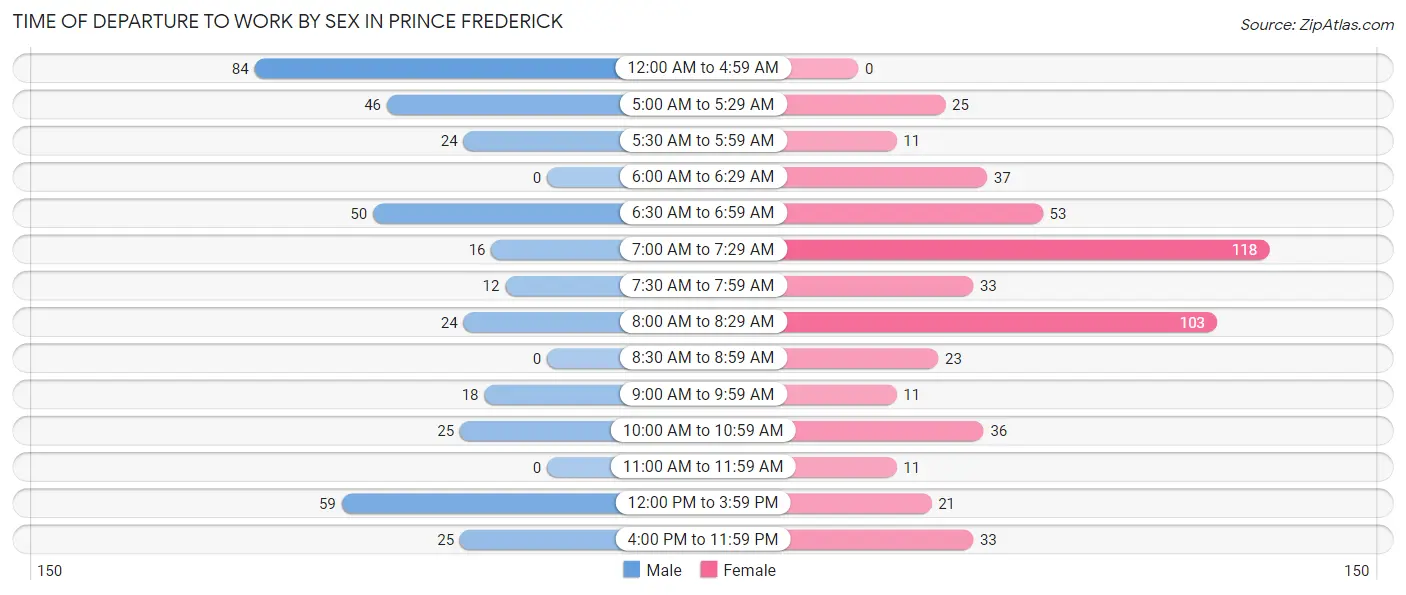
| Time of Departure | Male | Female |
| 12:00 AM to 4:59 AM | 84 (21.9%) | 0 (0.0%) |
| 5:00 AM to 5:29 AM | 46 (12.0%) | 25 (4.9%) |
| 5:30 AM to 5:59 AM | 24 (6.3%) | 11 (2.1%) |
| 6:00 AM to 6:29 AM | 0 (0.0%) | 37 (7.2%) |
| 6:30 AM to 6:59 AM | 50 (13.1%) | 53 (10.3%) |
| 7:00 AM to 7:29 AM | 16 (4.2%) | 118 (22.9%) |
| 7:30 AM to 7:59 AM | 12 (3.1%) | 33 (6.4%) |
| 8:00 AM to 8:29 AM | 24 (6.3%) | 103 (20.0%) |
| 8:30 AM to 8:59 AM | 0 (0.0%) | 23 (4.5%) |
| 9:00 AM to 9:59 AM | 18 (4.7%) | 11 (2.1%) |
| 10:00 AM to 10:59 AM | 25 (6.5%) | 36 (7.0%) |
| 11:00 AM to 11:59 AM | 0 (0.0%) | 11 (2.1%) |
| 12:00 PM to 3:59 PM | 59 (15.4%) | 21 (4.1%) |
| 4:00 PM to 11:59 PM | 25 (6.5%) | 33 (6.4%) |
| Total | 383 (100.0%) | 515 (100.0%) |
Housing Occupancy in Prince Frederick
Occupancy by Ownership in Prince Frederick
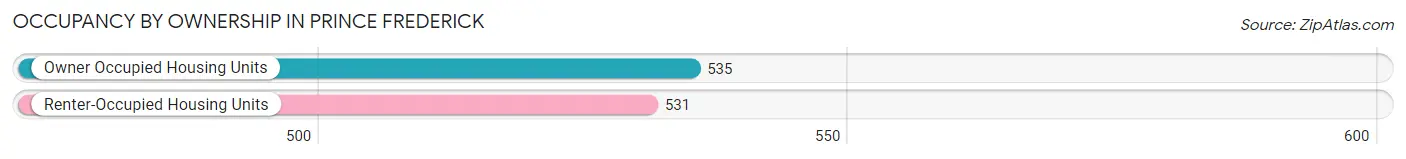
Of the total 1,066 dwellings in Prince Frederick, owner-occupied units account for 535 (50.2%), while renter-occupied units make up 531 (49.8%).
| Occupancy | # Housing Units | % Housing Units |
| Owner Occupied Housing Units | 535 | 50.2% |
| Renter-Occupied Housing Units | 531 | 49.8% |
| Total Occupied Housing Units | 1,066 | 100.0% |
Occupancy by Household Size in Prince Frederick
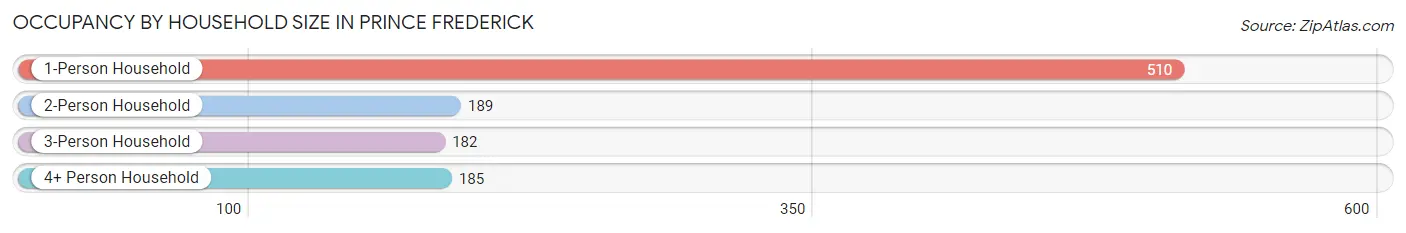
| Household Size | # Housing Units | % Housing Units |
| 1-Person Household | 510 | 47.8% |
| 2-Person Household | 189 | 17.7% |
| 3-Person Household | 182 | 17.1% |
| 4+ Person Household | 185 | 17.3% |
| Total Housing Units | 1,066 | 100.0% |
Occupancy by Ownership by Household Size in Prince Frederick
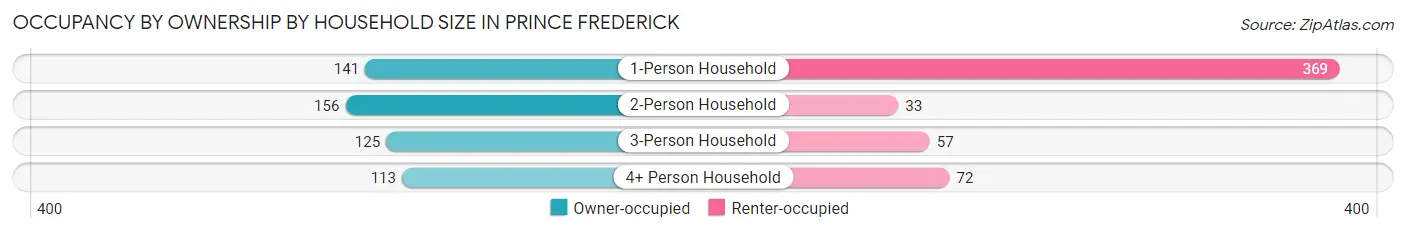
| Household Size | Owner-occupied | Renter-occupied |
| 1-Person Household | 141 (27.7%) | 369 (72.4%) |
| 2-Person Household | 156 (82.5%) | 33 (17.5%) |
| 3-Person Household | 125 (68.7%) | 57 (31.3%) |
| 4+ Person Household | 113 (61.1%) | 72 (38.9%) |
| Total Housing Units | 535 (50.2%) | 531 (49.8%) |
Occupancy by Educational Attainment in Prince Frederick
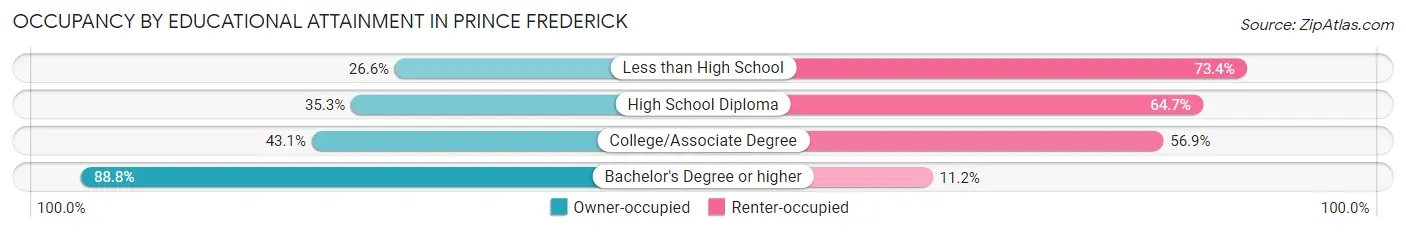
| Household Size | Owner-occupied | Renter-occupied |
| Less than High School | 21 (26.6%) | 58 (73.4%) |
| High School Diploma | 115 (35.3%) | 211 (64.7%) |
| College/Associate Degree | 177 (43.1%) | 234 (56.9%) |
| Bachelor's Degree or higher | 222 (88.8%) | 28 (11.2%) |
Occupancy by Age of Householder in Prince Frederick
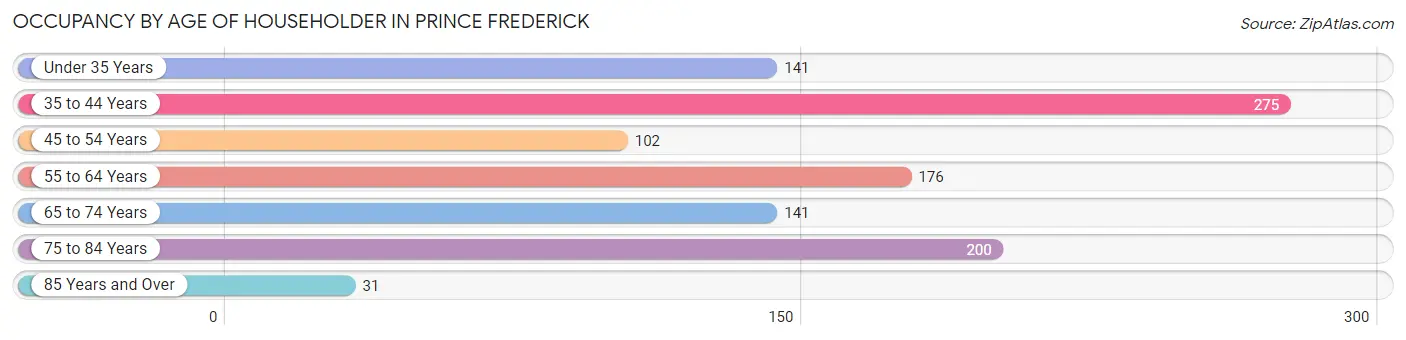
| Age Bracket | # Households | % Households |
| Under 35 Years | 141 | 13.2% |
| 35 to 44 Years | 275 | 25.8% |
| 45 to 54 Years | 102 | 9.6% |
| 55 to 64 Years | 176 | 16.5% |
| 65 to 74 Years | 141 | 13.2% |
| 75 to 84 Years | 200 | 18.8% |
| 85 Years and Over | 31 | 2.9% |
| Total | 1,066 | 100.0% |
Housing Finances in Prince Frederick
Median Income by Occupancy in Prince Frederick
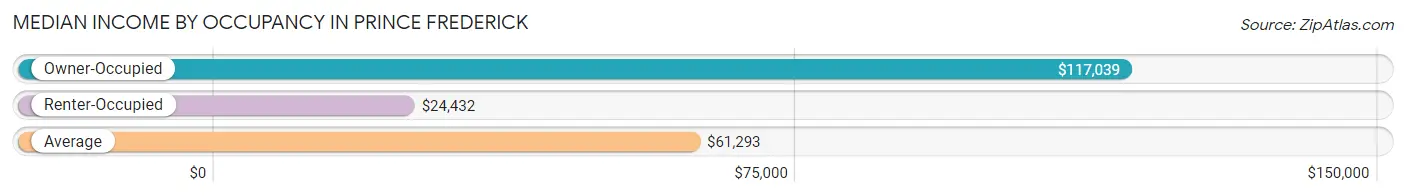
| Occupancy Type | # Households | Median Income |
| Owner-Occupied | 535 (50.2%) | $117,039 |
| Renter-Occupied | 531 (49.8%) | $24,432 |
| Average | 1,066 (100.0%) | $61,293 |
Occupancy by Householder Income Bracket in Prince Frederick
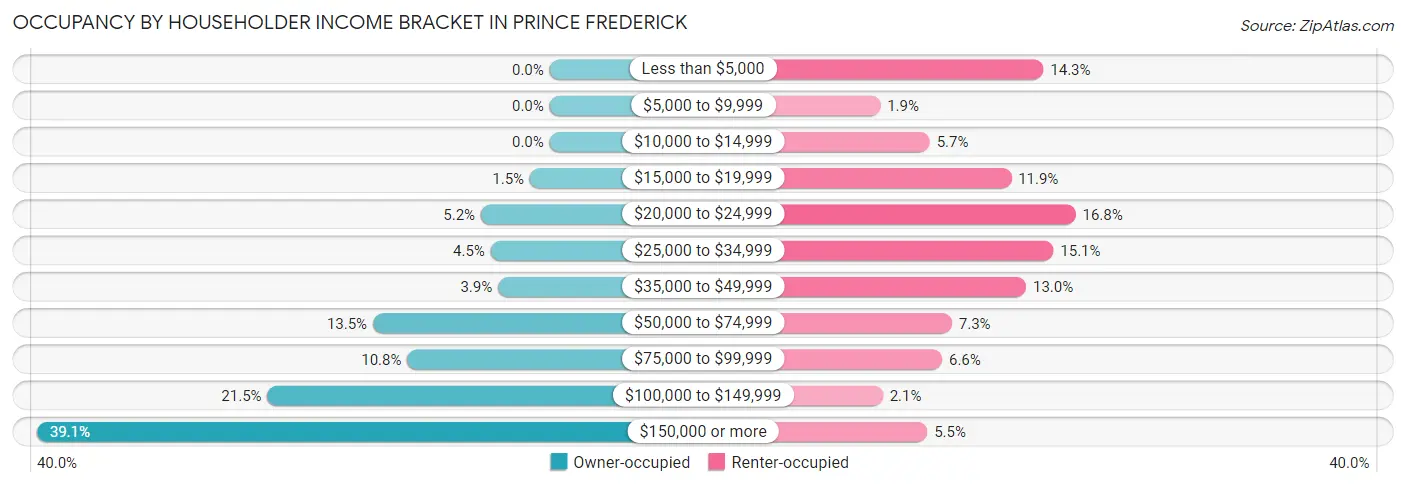
| Income Bracket | Owner-occupied | Renter-occupied |
| Less than $5,000 | 0 (0.0%) | 76 (14.3%) |
| $5,000 to $9,999 | 0 (0.0%) | 10 (1.9%) |
| $10,000 to $14,999 | 0 (0.0%) | 30 (5.7%) |
| $15,000 to $19,999 | 8 (1.5%) | 63 (11.9%) |
| $20,000 to $24,999 | 28 (5.2%) | 89 (16.8%) |
| $25,000 to $34,999 | 24 (4.5%) | 80 (15.1%) |
| $35,000 to $49,999 | 21 (3.9%) | 69 (13.0%) |
| $50,000 to $74,999 | 72 (13.5%) | 39 (7.3%) |
| $75,000 to $99,999 | 58 (10.8%) | 35 (6.6%) |
| $100,000 to $149,999 | 115 (21.5%) | 11 (2.1%) |
| $150,000 or more | 209 (39.1%) | 29 (5.5%) |
| Total | 535 (100.0%) | 531 (100.0%) |
Monthly Housing Cost Tiers in Prince Frederick
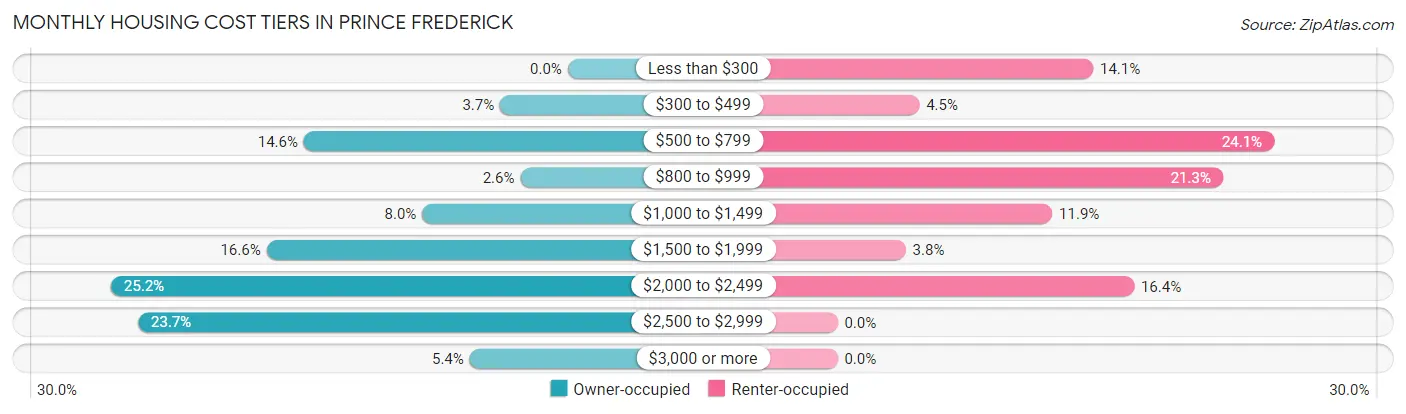
| Monthly Cost | Owner-occupied | Renter-occupied |
| Less than $300 | 0 (0.0%) | 75 (14.1%) |
| $300 to $499 | 20 (3.7%) | 24 (4.5%) |
| $500 to $799 | 78 (14.6%) | 128 (24.1%) |
| $800 to $999 | 14 (2.6%) | 113 (21.3%) |
| $1,000 to $1,499 | 43 (8.0%) | 63 (11.9%) |
| $1,500 to $1,999 | 89 (16.6%) | 20 (3.8%) |
| $2,000 to $2,499 | 135 (25.2%) | 87 (16.4%) |
| $2,500 to $2,999 | 127 (23.7%) | 0 (0.0%) |
| $3,000 or more | 29 (5.4%) | 0 (0.0%) |
| Total | 535 (100.0%) | 531 (100.0%) |
Physical Housing Characteristics in Prince Frederick
Housing Structures in Prince Frederick
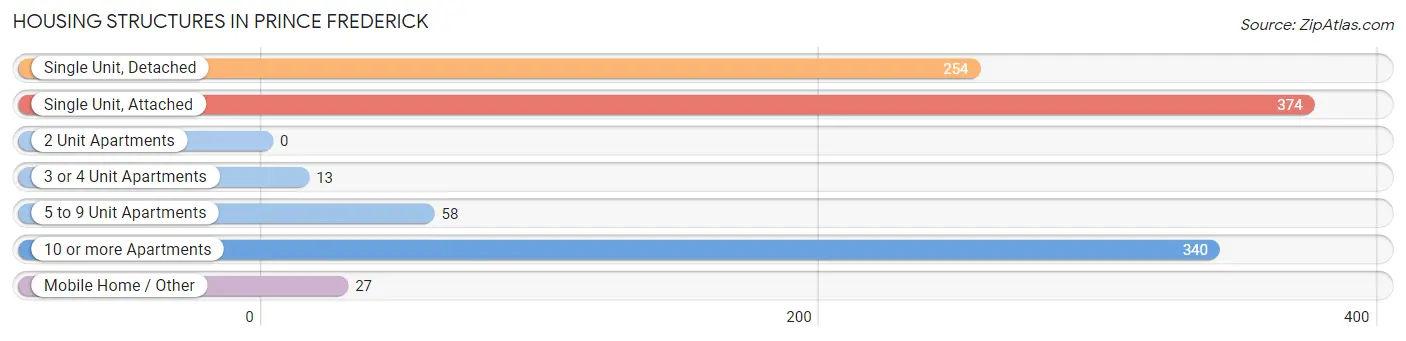
| Structure Type | # Housing Units | % Housing Units |
| Single Unit, Detached | 254 | 23.8% |
| Single Unit, Attached | 374 | 35.1% |
| 2 Unit Apartments | 0 | 0.0% |
| 3 or 4 Unit Apartments | 13 | 1.2% |
| 5 to 9 Unit Apartments | 58 | 5.4% |
| 10 or more Apartments | 340 | 31.9% |
| Mobile Home / Other | 27 | 2.5% |
| Total | 1,066 | 100.0% |
Housing Structures by Occupancy in Prince Frederick
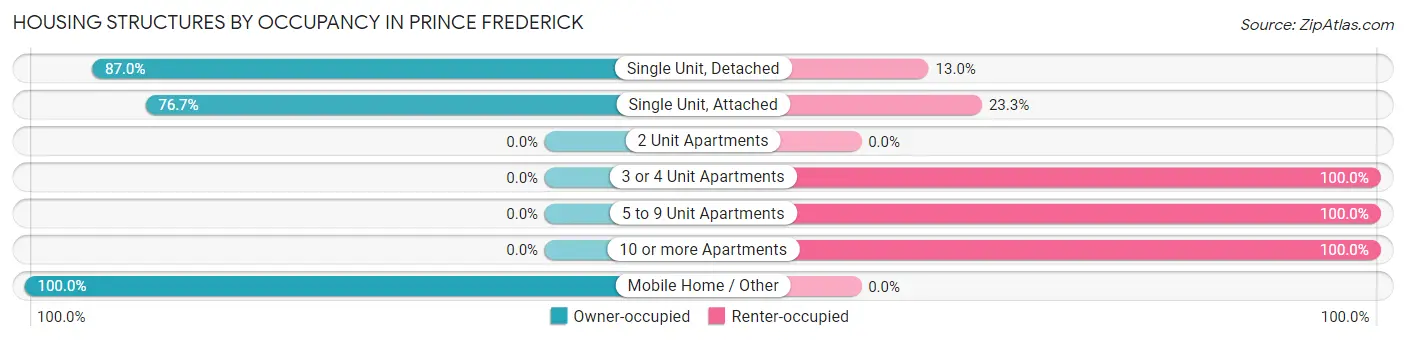
| Structure Type | Owner-occupied | Renter-occupied |
| Single Unit, Detached | 221 (87.0%) | 33 (13.0%) |
| Single Unit, Attached | 287 (76.7%) | 87 (23.3%) |
| 2 Unit Apartments | 0 (0.0%) | 0 (0.0%) |
| 3 or 4 Unit Apartments | 0 (0.0%) | 13 (100.0%) |
| 5 to 9 Unit Apartments | 0 (0.0%) | 58 (100.0%) |
| 10 or more Apartments | 0 (0.0%) | 340 (100.0%) |
| Mobile Home / Other | 27 (100.0%) | 0 (0.0%) |
| Total | 535 (50.2%) | 531 (49.8%) |
Housing Structures by Number of Rooms in Prince Frederick
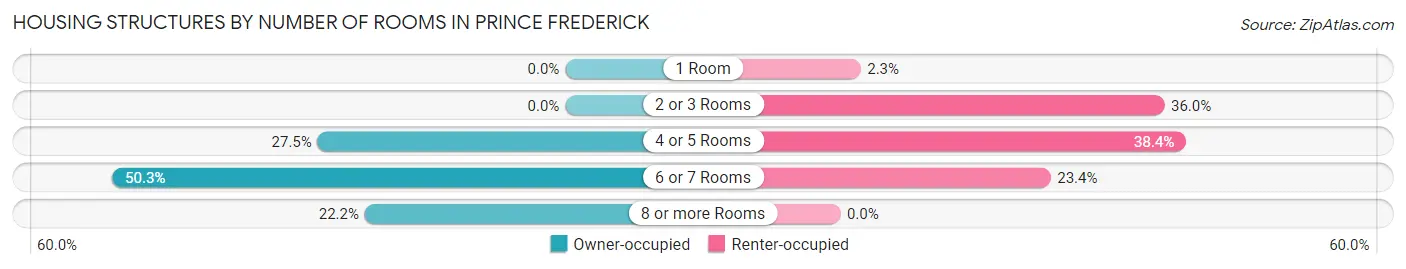
| Number of Rooms | Owner-occupied | Renter-occupied |
| 1 Room | 0 (0.0%) | 12 (2.3%) |
| 2 or 3 Rooms | 0 (0.0%) | 191 (36.0%) |
| 4 or 5 Rooms | 147 (27.5%) | 204 (38.4%) |
| 6 or 7 Rooms | 269 (50.3%) | 124 (23.4%) |
| 8 or more Rooms | 119 (22.2%) | 0 (0.0%) |
| Total | 535 (100.0%) | 531 (100.0%) |
Housing Structure by Heating Type in Prince Frederick
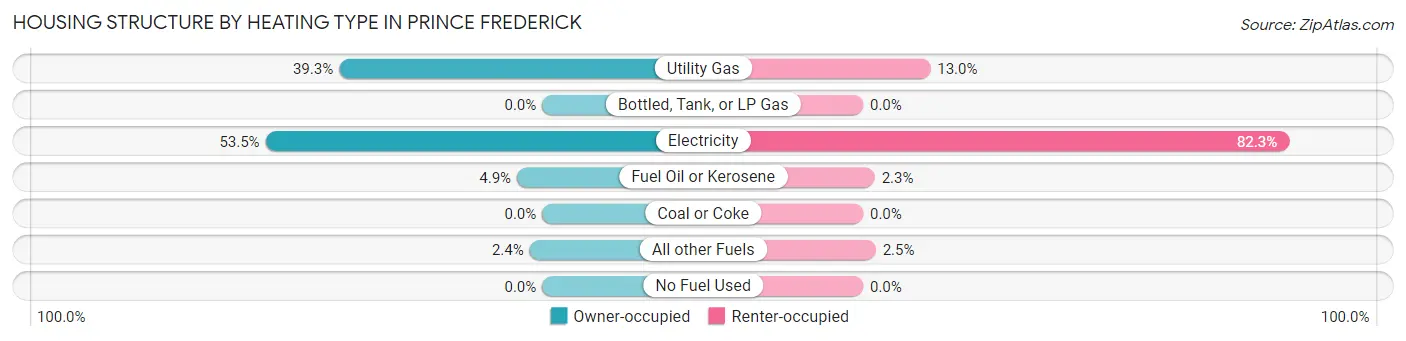
| Heating Type | Owner-occupied | Renter-occupied |
| Utility Gas | 210 (39.3%) | 69 (13.0%) |
| Bottled, Tank, or LP Gas | 0 (0.0%) | 0 (0.0%) |
| Electricity | 286 (53.5%) | 437 (82.3%) |
| Fuel Oil or Kerosene | 26 (4.9%) | 12 (2.3%) |
| Coal or Coke | 0 (0.0%) | 0 (0.0%) |
| All other Fuels | 13 (2.4%) | 13 (2.5%) |
| No Fuel Used | 0 (0.0%) | 0 (0.0%) |
| Total | 535 (100.0%) | 531 (100.0%) |
Household Vehicle Usage in Prince Frederick
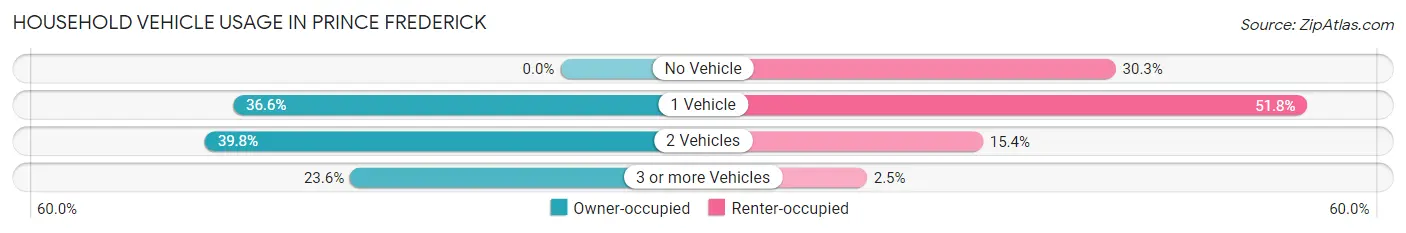
| Vehicles per Household | Owner-occupied | Renter-occupied |
| No Vehicle | 0 (0.0%) | 161 (30.3%) |
| 1 Vehicle | 196 (36.6%) | 275 (51.8%) |
| 2 Vehicles | 213 (39.8%) | 82 (15.4%) |
| 3 or more Vehicles | 126 (23.5%) | 13 (2.5%) |
| Total | 535 (100.0%) | 531 (100.0%) |
Real Estate & Mortgages in Prince Frederick
Real Estate and Mortgage Overview in Prince Frederick
| Characteristic | Without Mortgage | With Mortgage |
| Housing Units | 97 | 438 |
| Median Property Value | $316,300 | $353,800 |
| Median Household Income | $35,875 | $203 |
| Monthly Housing Costs | $553 | $29 |
| Real Estate Taxes | $3,297 | $33 |
Property Value by Mortgage Status in Prince Frederick
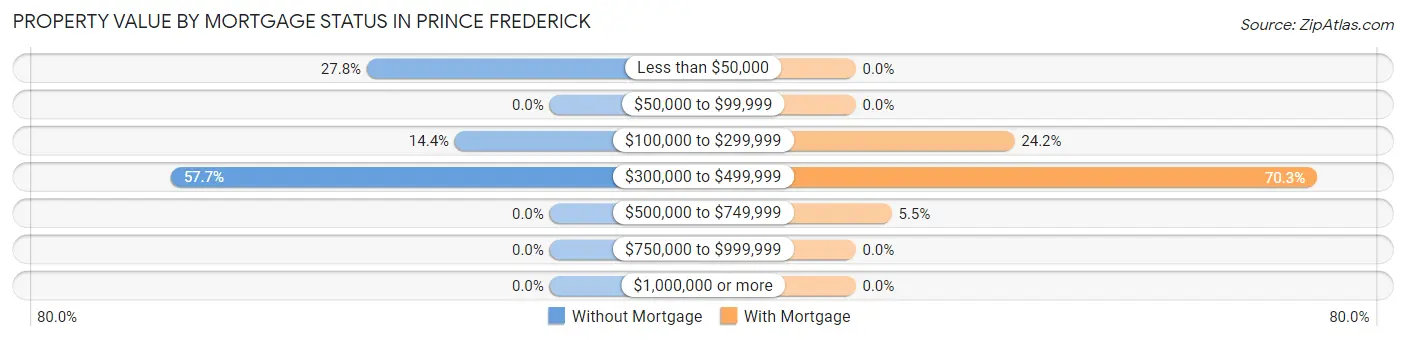
| Property Value | Without Mortgage | With Mortgage |
| Less than $50,000 | 27 (27.8%) | 0 (0.0%) |
| $50,000 to $99,999 | 0 (0.0%) | 0 (0.0%) |
| $100,000 to $299,999 | 14 (14.4%) | 106 (24.2%) |
| $300,000 to $499,999 | 56 (57.7%) | 308 (70.3%) |
| $500,000 to $749,999 | 0 (0.0%) | 24 (5.5%) |
| $750,000 to $999,999 | 0 (0.0%) | 0 (0.0%) |
| $1,000,000 or more | 0 (0.0%) | 0 (0.0%) |
| Total | 97 (100.0%) | 438 (100.0%) |
Household Income by Mortgage Status in Prince Frederick
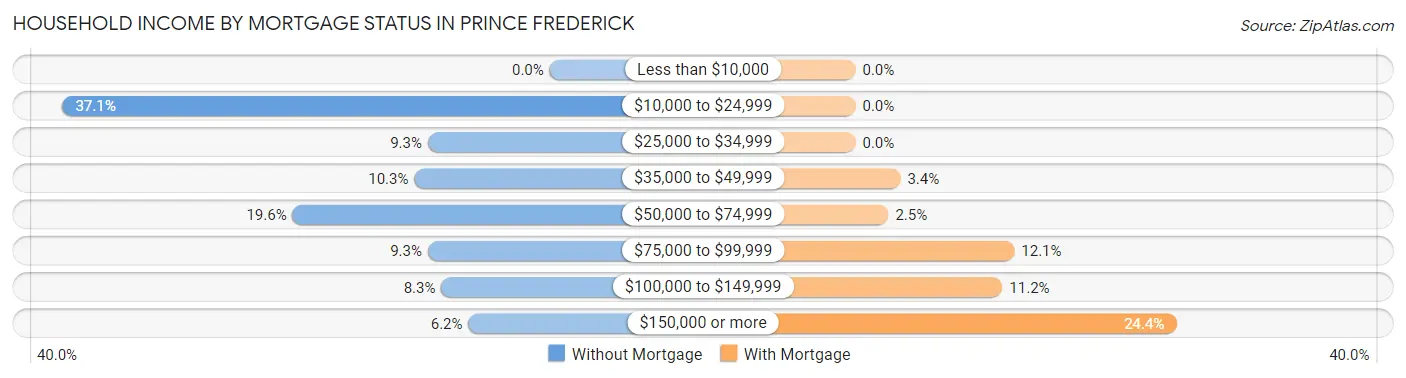
| Household Income | Without Mortgage | With Mortgage |
| Less than $10,000 | 0 (0.0%) | 0 (0.0%) |
| $10,000 to $24,999 | 36 (37.1%) | 0 (0.0%) |
| $25,000 to $34,999 | 9 (9.3%) | 0 (0.0%) |
| $35,000 to $49,999 | 10 (10.3%) | 15 (3.4%) |
| $50,000 to $74,999 | 19 (19.6%) | 11 (2.5%) |
| $75,000 to $99,999 | 9 (9.3%) | 53 (12.1%) |
| $100,000 to $149,999 | 8 (8.3%) | 49 (11.2%) |
| $150,000 or more | 6 (6.2%) | 107 (24.4%) |
| Total | 97 (100.0%) | 438 (100.0%) |
Property Value to Household Income Ratio in Prince Frederick
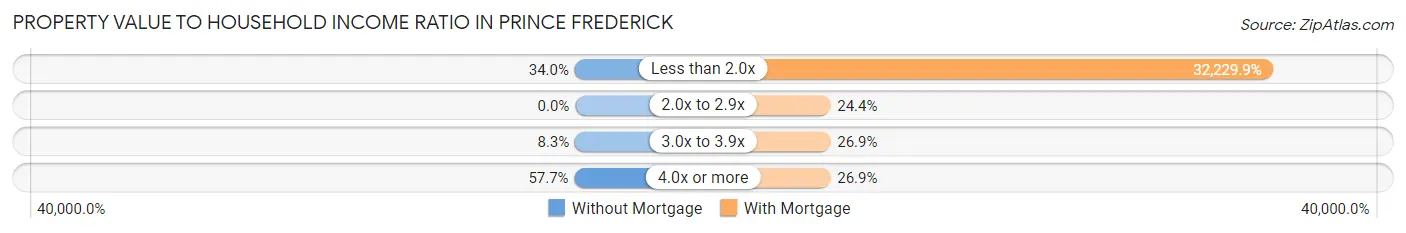
| Value-to-Income Ratio | Without Mortgage | With Mortgage |
| Less than 2.0x | 33 (34.0%) | 141,167 (32,229.9%) |
| 2.0x to 2.9x | 0 (0.0%) | 107 (24.4%) |
| 3.0x to 3.9x | 8 (8.3%) | 118 (26.9%) |
| 4.0x or more | 56 (57.7%) | 118 (26.9%) |
| Total | 97 (100.0%) | 438 (100.0%) |
Real Estate Taxes by Mortgage Status in Prince Frederick
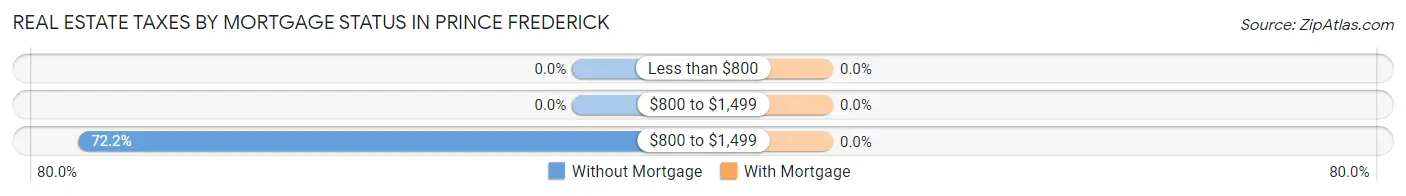
| Property Taxes | Without Mortgage | With Mortgage |
| Less than $800 | 0 (0.0%) | 0 (0.0%) |
| $800 to $1,499 | 0 (0.0%) | 0 (0.0%) |
| $800 to $1,499 | 70 (72.2%) | 0 (0.0%) |
| Total | 97 (100.0%) | 438 (100.0%) |
Health & Disability in Prince Frederick
Health Insurance Coverage by Age in Prince Frederick
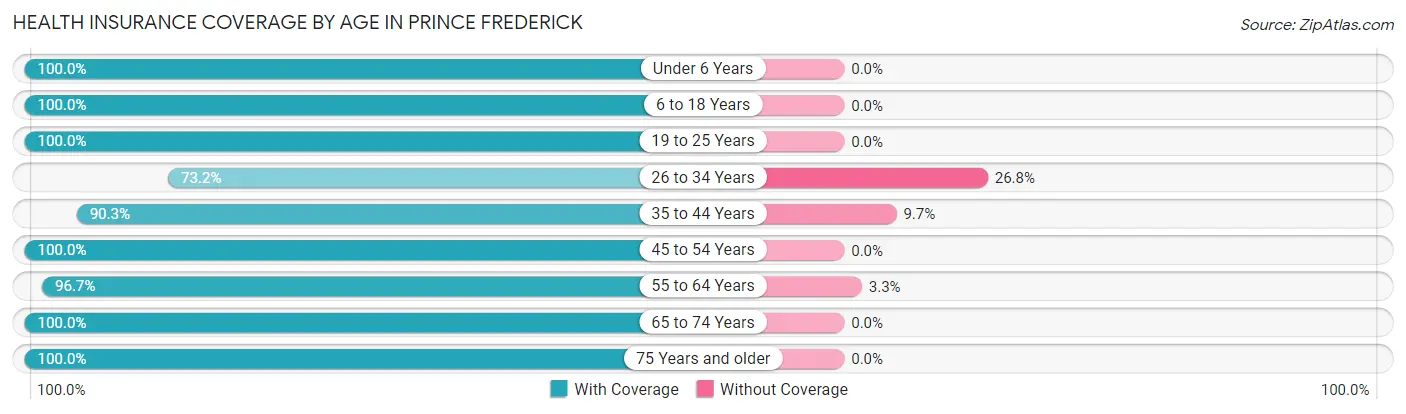
| Age Bracket | With Coverage | Without Coverage |
| Under 6 Years | 182 (100.0%) | 0 (0.0%) |
| 6 to 18 Years | 320 (100.0%) | 0 (0.0%) |
| 19 to 25 Years | 243 (100.0%) | 0 (0.0%) |
| 26 to 34 Years | 208 (73.2%) | 76 (26.8%) |
| 35 to 44 Years | 371 (90.3%) | 40 (9.7%) |
| 45 to 54 Years | 173 (100.0%) | 0 (0.0%) |
| 55 to 64 Years | 266 (96.7%) | 9 (3.3%) |
| 65 to 74 Years | 172 (100.0%) | 0 (0.0%) |
| 75 Years and older | 275 (100.0%) | 0 (0.0%) |
| Total | 2,210 (94.7%) | 125 (5.3%) |
Health Insurance Coverage by Citizenship Status in Prince Frederick
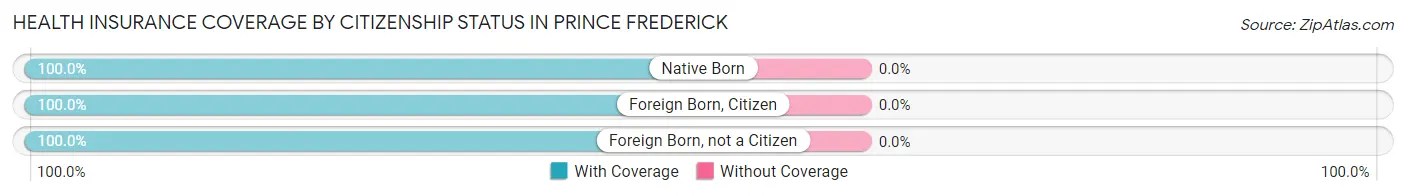
| Citizenship Status | With Coverage | Without Coverage |
| Native Born | 182 (100.0%) | 0 (0.0%) |
| Foreign Born, Citizen | 320 (100.0%) | 0 (0.0%) |
| Foreign Born, not a Citizen | 243 (100.0%) | 0 (0.0%) |
Health Insurance Coverage by Household Income in Prince Frederick
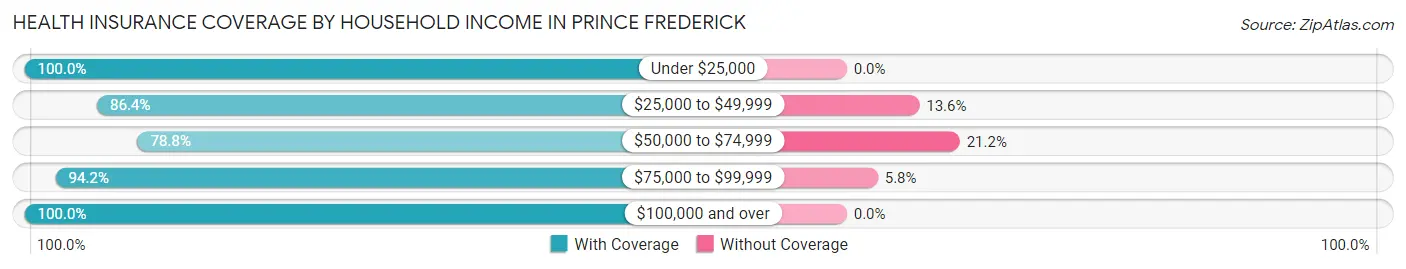
| Household Income | With Coverage | Without Coverage |
| Under $25,000 | 304 (100.0%) | 0 (0.0%) |
| $25,000 to $49,999 | 337 (86.4%) | 53 (13.6%) |
| $50,000 to $74,999 | 190 (78.8%) | 51 (21.2%) |
| $75,000 to $99,999 | 227 (94.2%) | 14 (5.8%) |
| $100,000 and over | 1,092 (100.0%) | 0 (0.0%) |
Public vs Private Health Insurance Coverage by Age in Prince Frederick
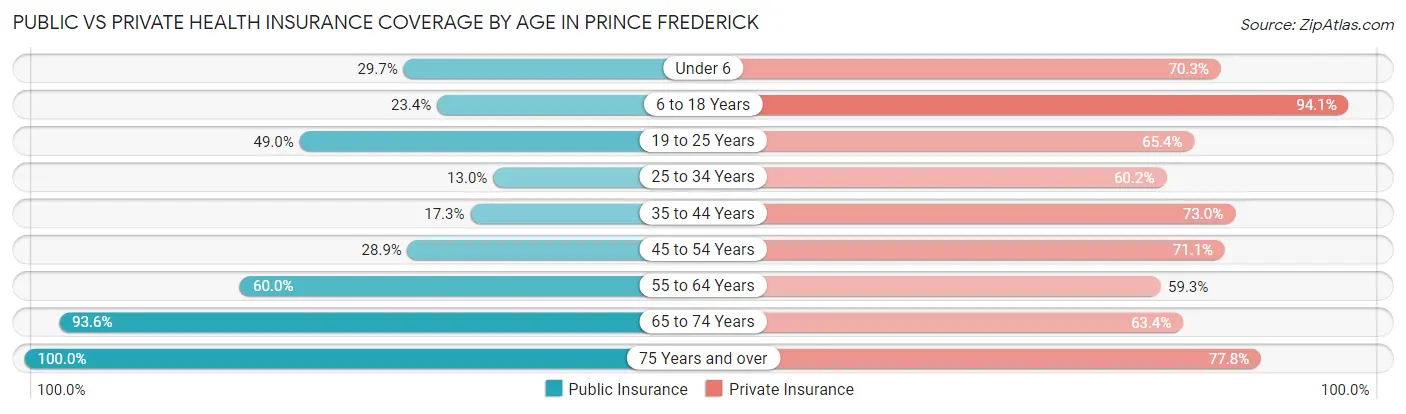
| Age Bracket | Public Insurance | Private Insurance |
| Under 6 | 54 (29.7%) | 128 (70.3%) |
| 6 to 18 Years | 75 (23.4%) | 301 (94.1%) |
| 19 to 25 Years | 119 (49.0%) | 159 (65.4%) |
| 25 to 34 Years | 37 (13.0%) | 171 (60.2%) |
| 35 to 44 Years | 71 (17.3%) | 300 (73.0%) |
| 45 to 54 Years | 50 (28.9%) | 123 (71.1%) |
| 55 to 64 Years | 165 (60.0%) | 163 (59.3%) |
| 65 to 74 Years | 161 (93.6%) | 109 (63.4%) |
| 75 Years and over | 275 (100.0%) | 214 (77.8%) |
| Total | 1,007 (43.1%) | 1,668 (71.4%) |
Disability Status by Sex by Age in Prince Frederick
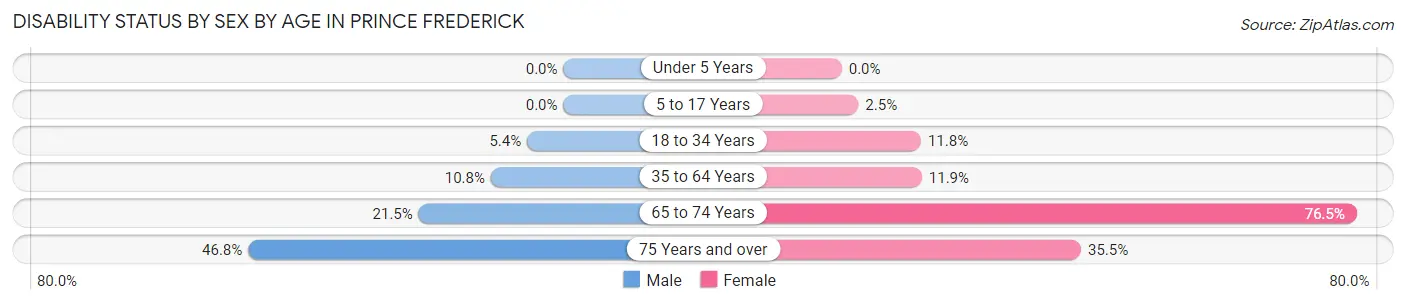
| Age Bracket | Male | Female |
| Under 5 Years | 0 (0.0%) | 0 (0.0%) |
| 5 to 17 Years | 0 (0.0%) | 6 (2.5%) |
| 18 to 34 Years | 9 (5.4%) | 44 (11.8%) |
| 35 to 64 Years | 40 (10.8%) | 58 (11.9%) |
| 65 to 74 Years | 26 (21.5%) | 39 (76.5%) |
| 75 Years and over | 22 (46.8%) | 81 (35.5%) |
Disability Class by Sex by Age in Prince Frederick
Disability Class: Hearing Difficulty
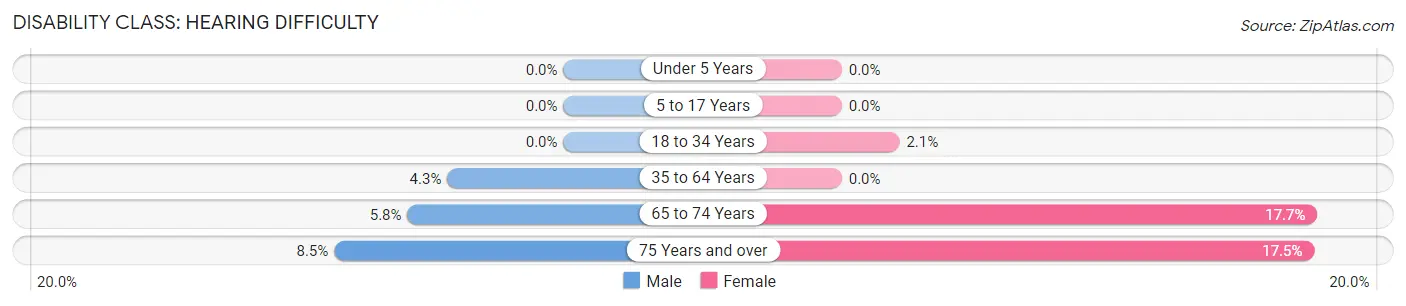
| Age Bracket | Male | Female |
| Under 5 Years | 0 (0.0%) | 0 (0.0%) |
| 5 to 17 Years | 0 (0.0%) | 0 (0.0%) |
| 18 to 34 Years | 0 (0.0%) | 8 (2.1%) |
| 35 to 64 Years | 16 (4.3%) | 0 (0.0%) |
| 65 to 74 Years | 7 (5.8%) | 9 (17.6%) |
| 75 Years and over | 4 (8.5%) | 40 (17.5%) |
Disability Class: Vision Difficulty
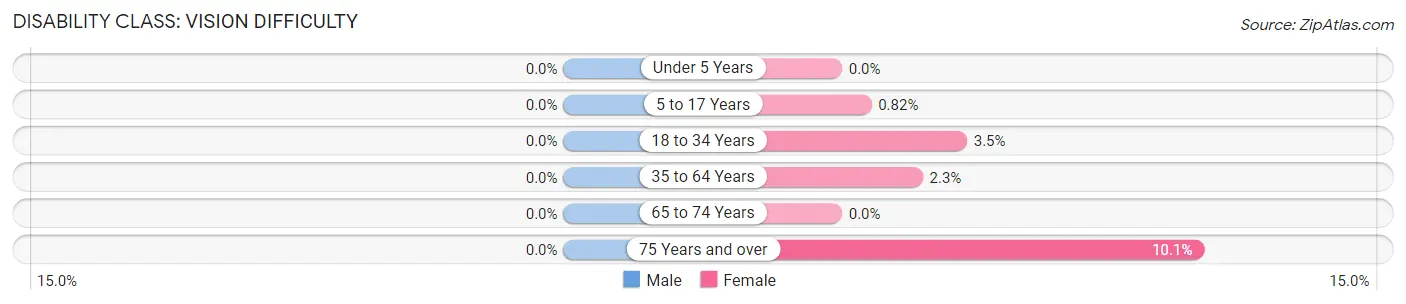
| Age Bracket | Male | Female |
| Under 5 Years | 0 (0.0%) | 0 (0.0%) |
| 5 to 17 Years | 0 (0.0%) | 2 (0.8%) |
| 18 to 34 Years | 0 (0.0%) | 13 (3.5%) |
| 35 to 64 Years | 0 (0.0%) | 11 (2.2%) |
| 65 to 74 Years | 0 (0.0%) | 0 (0.0%) |
| 75 Years and over | 0 (0.0%) | 23 (10.1%) |
Disability Class: Cognitive Difficulty
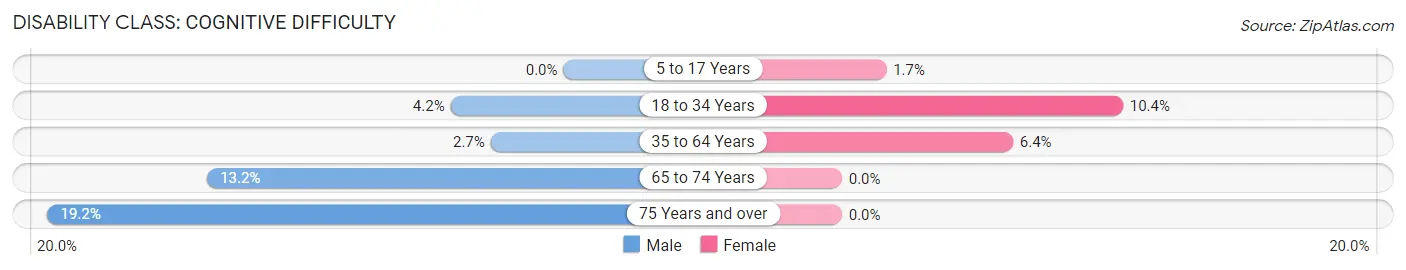
| Age Bracket | Male | Female |
| 5 to 17 Years | 0 (0.0%) | 4 (1.7%) |
| 18 to 34 Years | 7 (4.2%) | 39 (10.4%) |
| 35 to 64 Years | 10 (2.7%) | 31 (6.4%) |
| 65 to 74 Years | 16 (13.2%) | 0 (0.0%) |
| 75 Years and over | 9 (19.2%) | 0 (0.0%) |
Disability Class: Ambulatory Difficulty
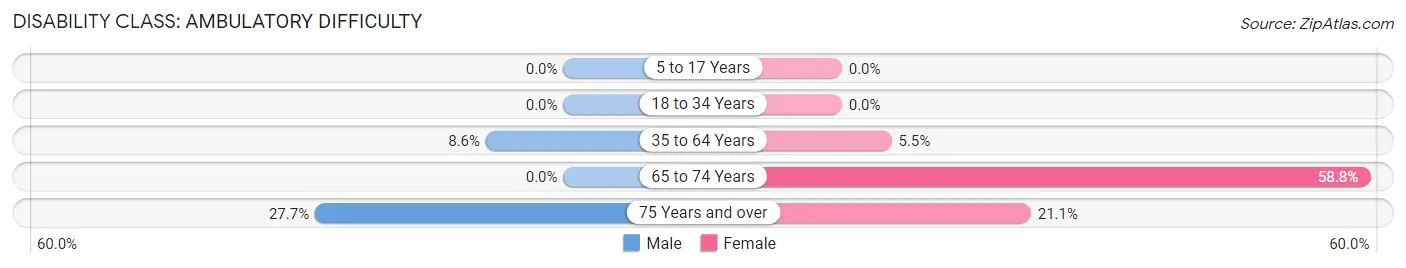
| Age Bracket | Male | Female |
| 5 to 17 Years | 0 (0.0%) | 0 (0.0%) |
| 18 to 34 Years | 0 (0.0%) | 0 (0.0%) |
| 35 to 64 Years | 32 (8.6%) | 27 (5.5%) |
| 65 to 74 Years | 0 (0.0%) | 30 (58.8%) |
| 75 Years and over | 13 (27.7%) | 48 (21.0%) |
Disability Class: Self-Care Difficulty
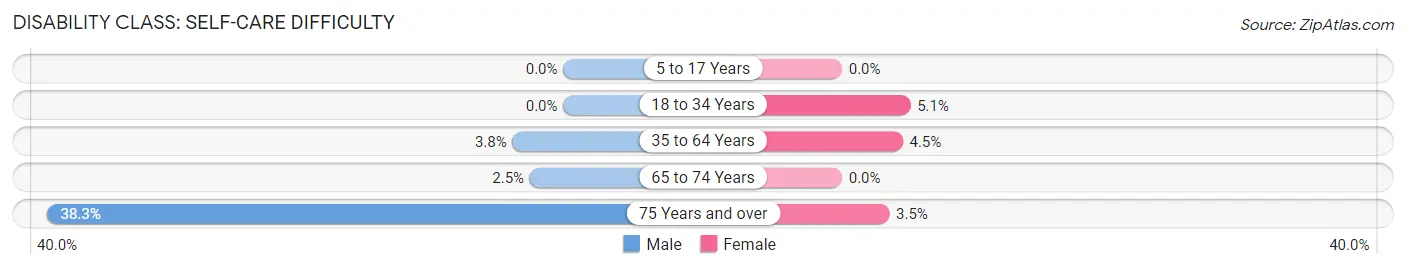
| Age Bracket | Male | Female |
| 5 to 17 Years | 0 (0.0%) | 0 (0.0%) |
| 18 to 34 Years | 0 (0.0%) | 19 (5.1%) |
| 35 to 64 Years | 14 (3.8%) | 22 (4.5%) |
| 65 to 74 Years | 3 (2.5%) | 0 (0.0%) |
| 75 Years and over | 18 (38.3%) | 8 (3.5%) |
Technology Access in Prince Frederick
Computing Device Access in Prince Frederick
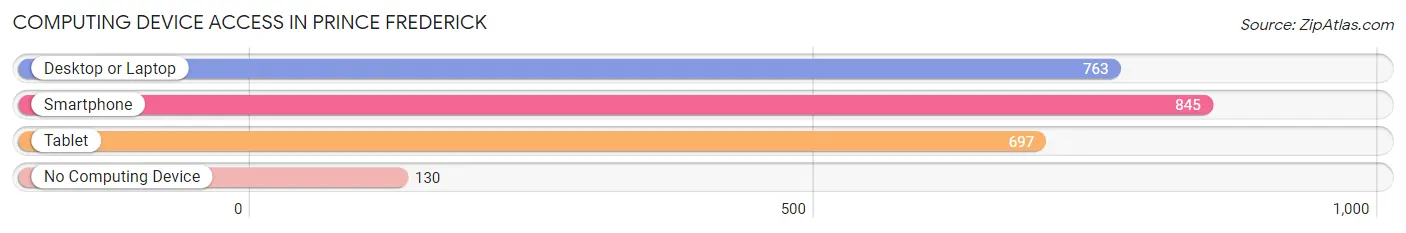
| Device Type | # Households | % Households |
| Desktop or Laptop | 763 | 71.6% |
| Smartphone | 845 | 79.3% |
| Tablet | 697 | 65.4% |
| No Computing Device | 130 | 12.2% |
| Total | 1,066 | 100.0% |
Internet Access in Prince Frederick
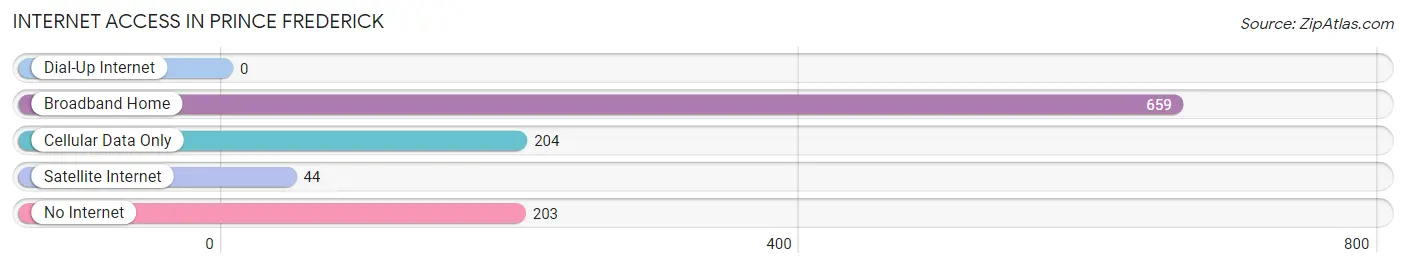
| Internet Type | # Households | % Households |
| Dial-Up Internet | 0 | 0.0% |
| Broadband Home | 659 | 61.8% |
| Cellular Data Only | 204 | 19.1% |
| Satellite Internet | 44 | 4.1% |
| No Internet | 203 | 19.0% |
| Total | 1,066 | 100.0% |
Prince Frederick Summary
Prince Frederick is a town located in Calvert County, Maryland. It is the county seat of Calvert County and is located on the Patuxent River. The town has a population of 4,719 as of the 2010 census.
History
Prince Frederick was founded in 1745 by Thomas Brown, a planter from England. He named the town after his son, Prince Frederick Calvert. The town was originally known as Calvert Town, but the name was changed to Prince Frederick in 1776.
The town was an important port during the colonial period and was a major trading center for tobacco and other goods. During the Revolutionary War, the town was occupied by British troops and was the site of several skirmishes.
In the 19th century, Prince Frederick became a popular summer resort for wealthy families from Washington, D.C. and Baltimore. The town was also home to several large plantations, including the Calvert Mansion, which was built in 1810.
Geography
Prince Frederick is located in southern Maryland, about 40 miles south of Washington, D.C. The town is situated on the Patuxent River, which is a major tributary of the Chesapeake Bay. The town is surrounded by forests and wetlands, and is home to several state parks and wildlife refuges.
The climate in Prince Frederick is humid subtropical, with hot, humid summers and mild winters. The average annual temperature is around 60 degrees Fahrenheit.
Economy
The economy of Prince Frederick is largely based on agriculture and tourism. The town is home to several large farms, which produce a variety of crops, including corn, soybeans, wheat, and hay. The town is also home to several wineries and breweries, which produce a variety of wines and beers.
Tourism is an important part of the local economy, with visitors coming to the town to enjoy its natural beauty and historic sites. The town is home to several state parks, including Calvert Cliffs State Park and Flag Ponds Nature Park.
Demographics
As of the 2010 census, the population of Prince Frederick was 4,719. The racial makeup of the town was 79.3% White, 14.2% African American, 0.7% Native American, 1.2% Asian, 0.1% Pacific Islander, and 4.5% from other races. Hispanic or Latino of any race were 5.3% of the population.
The median household income in Prince Frederick was $63,917, and the median family income was $76,917. The per capita income was $30,917. About 8.3% of families and 10.7% of the population were below the poverty line.
Prince Frederick is served by the Calvert County Public Schools system. The town is home to several schools, including Calvert High School, Calvert Middle School, and Calvert Elementary School.
Common Questions
What is Per Capita Income in Prince Frederick?
Per Capita income in Prince Frederick is $36,429.
What is the Median Family Income in Prince Frederick?
Median Family Income in Prince Frederick is $122,500.
What is the Median Household income in Prince Frederick?
Median Household Income in Prince Frederick is $61,293.
What is Income or Wage Gap in Prince Frederick?
Income or Wage Gap in Prince Frederick is 47.2%.
Women in Prince Frederick earn 52.8 cents for every dollar earned by a man.
What is Inequality or Gini Index in Prince Frederick?
Inequality or Gini Index in Prince Frederick is 0.46.
What is the Total Population of Prince Frederick?
Total Population of Prince Frederick is 2,491.
What is the Total Male Population of Prince Frederick?
Total Male Population of Prince Frederick is 990.
What is the Total Female Population of Prince Frederick?
Total Female Population of Prince Frederick is 1,501.
What is the Ratio of Males per 100 Females in Prince Frederick?
There are 65.96 Males per 100 Females in Prince Frederick.
What is the Ratio of Females per 100 Males in Prince Frederick?
There are 151.62 Females per 100 Males in Prince Frederick.
What is the Median Population Age in Prince Frederick?
Median Population Age in Prince Frederick is 38.9 Years.
What is the Average Family Size in Prince Frederick
Average Family Size in Prince Frederick is 3.1 People.
What is the Average Household Size in Prince Frederick
Average Household Size in Prince Frederick is 2.2 People.
How Large is the Labor Force in Prince Frederick?
There are 1,170 People in the Labor Forcein in Prince Frederick.
What is the Percentage of People in the Labor Force in Prince Frederick?
56.7% of People are in the Labor Force in Prince Frederick.
What is the Unemployment Rate in Prince Frederick?
Unemployment Rate in Prince Frederick is 10.1%.