Dundalk, MD Map & Demographics
Dundalk Map
Dundalk Overview
$30,768
PER CAPITA INCOME
$69,535
AVG FAMILY INCOME
$61,217
AVG HOUSEHOLD INCOME
18.0%
WAGE / INCOME GAP [ % ]
82.0¢/ $1
WAGE / INCOME GAP [ $ ]
$11,168
FAMILY INCOME DEFICIT
0.45
INEQUALITY / GINI INDEX
66,321
TOTAL POPULATION
31,883
MALE POPULATION
34,438
FEMALE POPULATION
92.58
MALES / 100 FEMALES
108.01
FEMALES / 100 MALES
37.3
MEDIAN AGE
3.3
AVG FAMILY SIZE
2.7
AVG HOUSEHOLD SIZE
31,689
LABOR FORCE [ PEOPLE ]
61.4%
PERCENT IN LABOR FORCE
6.9%
UNEMPLOYMENT RATE
Dundalk Zip Codes
Income in Dundalk
Income Overview in Dundalk
Per Capita Income in Dundalk is $30,768, while median incomes of families and households are $69,535 and $61,217 respectively.
| Characteristic | Number | Measure |
| Per Capita Income | 66,321 | $30,768 |
| Median Family Income | 15,979 | $69,535 |
| Mean Family Income | 15,979 | $88,676 |
| Median Household Income | 24,805 | $61,217 |
| Mean Household Income | 24,805 | $78,593 |
| Income Deficit | 15,979 | $11,168 |
| Wage / Income Gap (%) | 66,321 | 17.97% |
| Wage / Income Gap ($) | 66,321 | 82.03¢ per $1 |
| Gini / Inequality Index | 66,321 | 0.45 |
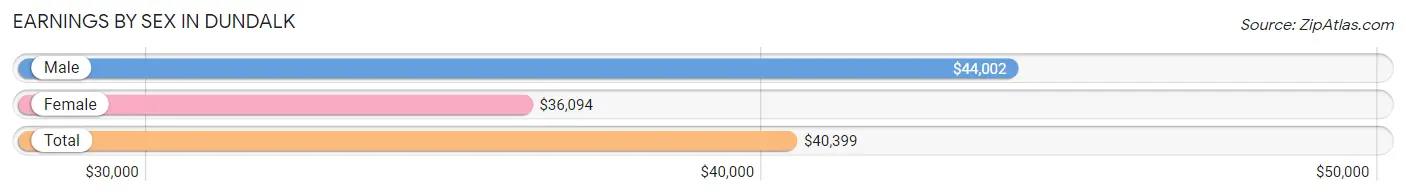
Earnings by Sex in Dundalk
Average Earnings in Dundalk are $40,399, $44,002 for men and $36,094 for women, a difference of 18.0%.
| Sex | Number | Average Earnings |
| Male | 16,953 (53.1%) | $44,002 |
| Female | 14,966 (46.9%) | $36,094 |
| Total | 31,919 (100.0%) | $40,399 |
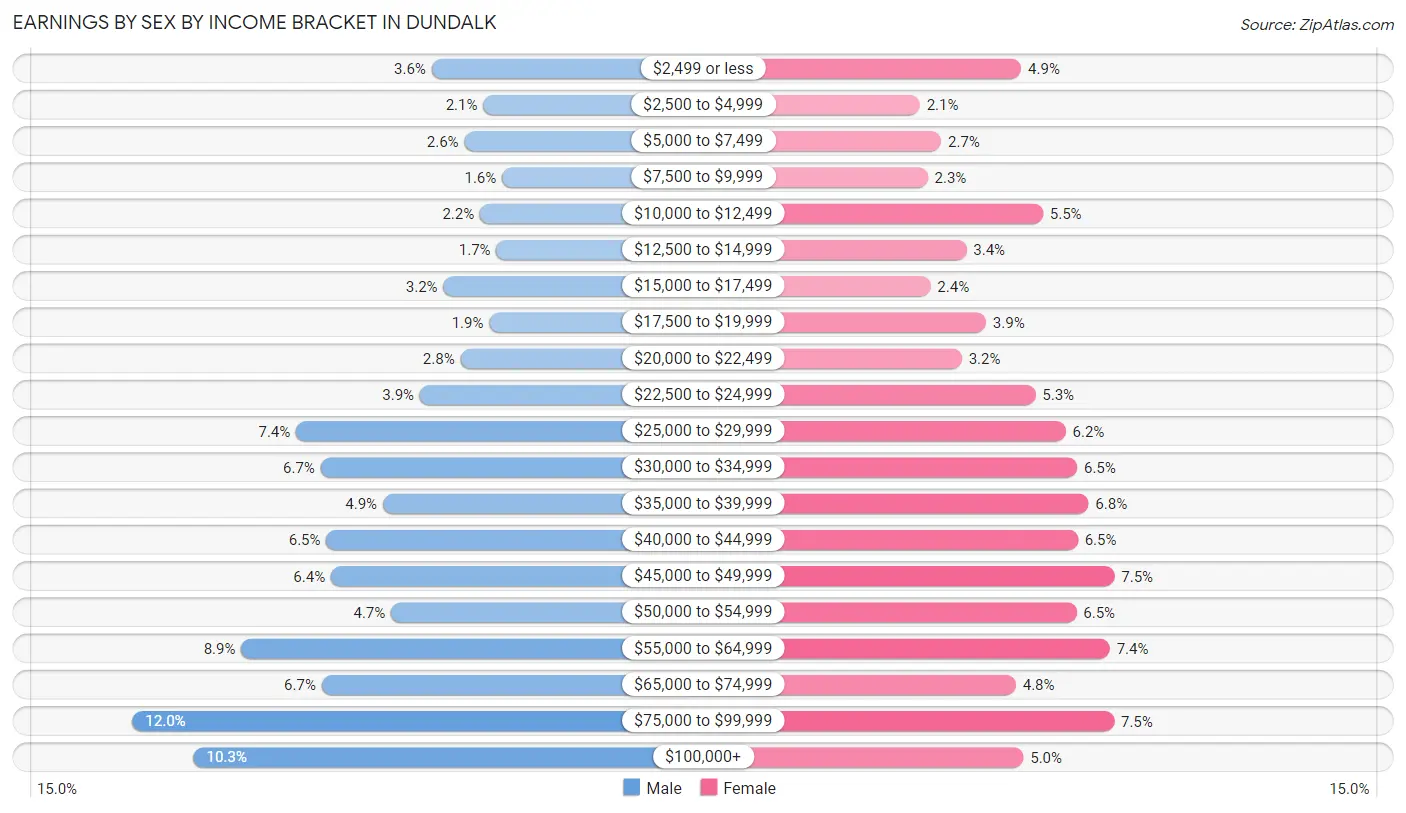
Earnings by Sex by Income Bracket in Dundalk
The most common earnings brackets in Dundalk are $75,000 to $99,999 for men (2,029 | 12.0%) and $45,000 to $49,999 for women (1,125 | 7.5%).
| Income | Male | Female |
| $2,499 or less | 603 (3.6%) | 733 (4.9%) |
| $2,500 to $4,999 | 357 (2.1%) | 307 (2.1%) |
| $5,000 to $7,499 | 447 (2.6%) | 396 (2.6%) |
| $7,500 to $9,999 | 268 (1.6%) | 340 (2.3%) |
| $10,000 to $12,499 | 373 (2.2%) | 825 (5.5%) |
| $12,500 to $14,999 | 295 (1.7%) | 503 (3.4%) |
| $15,000 to $17,499 | 547 (3.2%) | 351 (2.4%) |
| $17,500 to $19,999 | 329 (1.9%) | 585 (3.9%) |
| $20,000 to $22,499 | 467 (2.8%) | 484 (3.2%) |
| $22,500 to $24,999 | 659 (3.9%) | 793 (5.3%) |
| $25,000 to $29,999 | 1,249 (7.4%) | 920 (6.1%) |
| $30,000 to $34,999 | 1,133 (6.7%) | 968 (6.5%) |
| $35,000 to $39,999 | 836 (4.9%) | 1,016 (6.8%) |
| $40,000 to $44,999 | 1,106 (6.5%) | 972 (6.5%) |
| $45,000 to $49,999 | 1,083 (6.4%) | 1,125 (7.5%) |
| $50,000 to $54,999 | 796 (4.7%) | 965 (6.5%) |
| $55,000 to $64,999 | 1,510 (8.9%) | 1,106 (7.4%) |
| $65,000 to $74,999 | 1,128 (6.7%) | 711 (4.8%) |
| $75,000 to $99,999 | 2,029 (12.0%) | 1,124 (7.5%) |
| $100,000+ | 1,738 (10.2%) | 742 (5.0%) |
| Total | 16,953 (100.0%) | 14,966 (100.0%) |
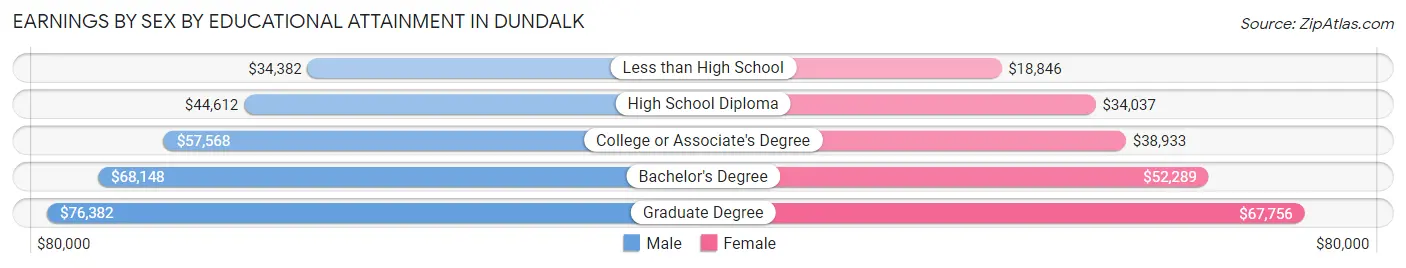
Earnings by Sex by Educational Attainment in Dundalk
Average earnings in Dundalk are $48,432 for men and $39,561 for women, a difference of 18.3%. Men with an educational attainment of graduate degree enjoy the highest average annual earnings of $76,382, while those with less than high school education earn the least with $34,382. Women with an educational attainment of graduate degree earn the most with the average annual earnings of $67,756, while those with less than high school education have the smallest earnings of $18,846.
| Educational Attainment | Male Income | Female Income |
| Less than High School | $34,382 | $18,846 |
| High School Diploma | $44,612 | $34,037 |
| College or Associate's Degree | $57,568 | $38,933 |
| Bachelor's Degree | $68,148 | $52,289 |
| Graduate Degree | $76,382 | $67,756 |
| Total | $48,432 | $39,561 |
Family Income in Dundalk
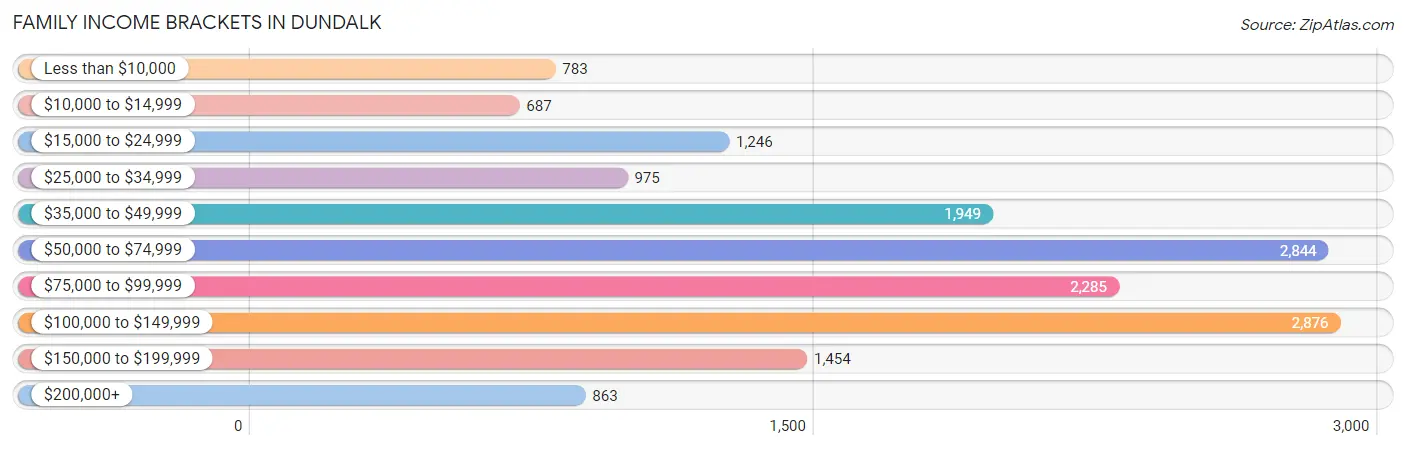
Family Income Brackets in Dundalk
According to the Dundalk family income data, there are 2,876 families falling into the $100,000 to $149,999 income range, which is the most common income bracket and makes up 18.0% of all families. Conversely, the $10,000 to $14,999 income bracket is the least frequent group with only 687 families (4.3%) belonging to this category.
| Income Bracket | # Families | % Families |
| Less than $10,000 | 783 | 4.9% |
| $10,000 to $14,999 | 687 | 4.3% |
| $15,000 to $24,999 | 1,246 | 7.8% |
| $25,000 to $34,999 | 975 | 6.1% |
| $35,000 to $49,999 | 1,949 | 12.2% |
| $50,000 to $74,999 | 2,844 | 17.8% |
| $75,000 to $99,999 | 2,285 | 14.3% |
| $100,000 to $149,999 | 2,876 | 18.0% |
| $150,000 to $199,999 | 1,454 | 9.1% |
| $200,000+ | 863 | 5.4% |
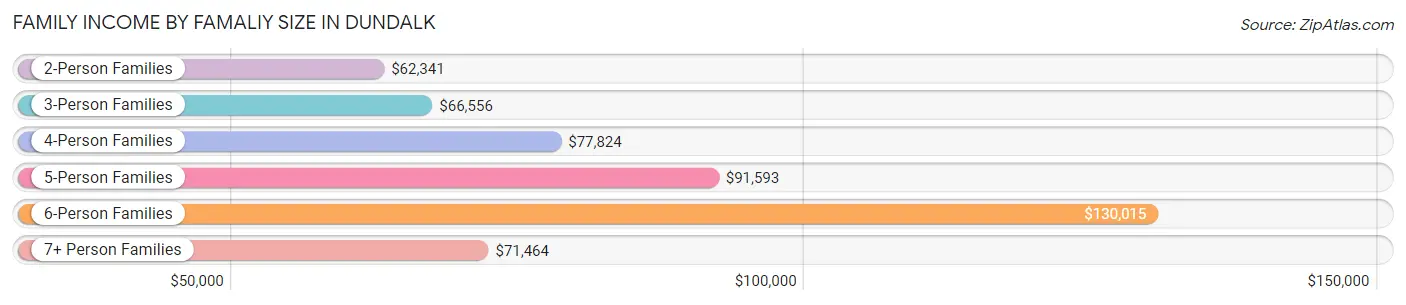
Family Income by Famaliy Size in Dundalk
6-person families (459 | 2.9%) account for the highest median family income in Dundalk with $130,015 per family, while 2-person families (6,886 | 43.1%) have the highest median income of $31,170 per family member.
| Income Bracket | # Families | Median Income |
| 2-Person Families | 6,886 (43.1%) | $62,341 |
| 3-Person Families | 4,074 (25.5%) | $66,556 |
| 4-Person Families | 2,835 (17.7%) | $77,824 |
| 5-Person Families | 1,146 (7.2%) | $91,593 |
| 6-Person Families | 459 (2.9%) | $130,015 |
| 7+ Person Families | 579 (3.6%) | $71,464 |
| Total | 15,979 (100.0%) | $69,535 |
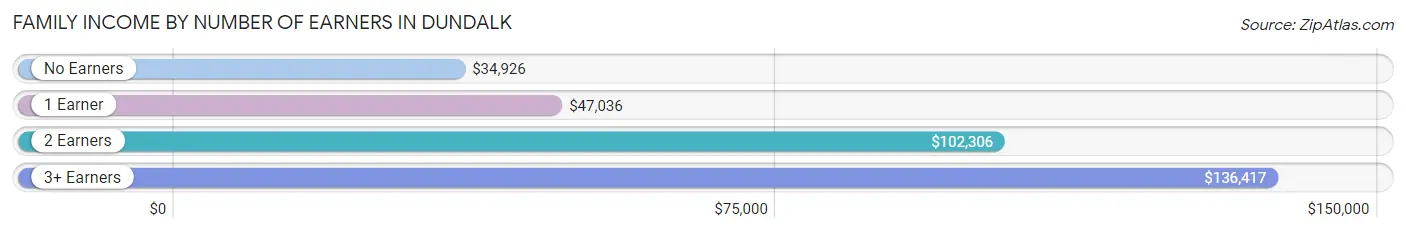
Family Income by Number of Earners in Dundalk
The median family income in Dundalk is $69,535, with families comprising 3+ earners (2,075) having the highest median family income of $136,417, while families with no earners (3,235) have the lowest median family income of $34,926, accounting for 13.0% and 20.3% of families, respectively.
| Number of Earners | # Families | Median Income |
| No Earners | 3,235 (20.3%) | $34,926 |
| 1 Earner | 5,658 (35.4%) | $47,036 |
| 2 Earners | 5,011 (31.4%) | $102,306 |
| 3+ Earners | 2,075 (13.0%) | $136,417 |
| Total | 15,979 (100.0%) | $69,535 |
Household Income in Dundalk
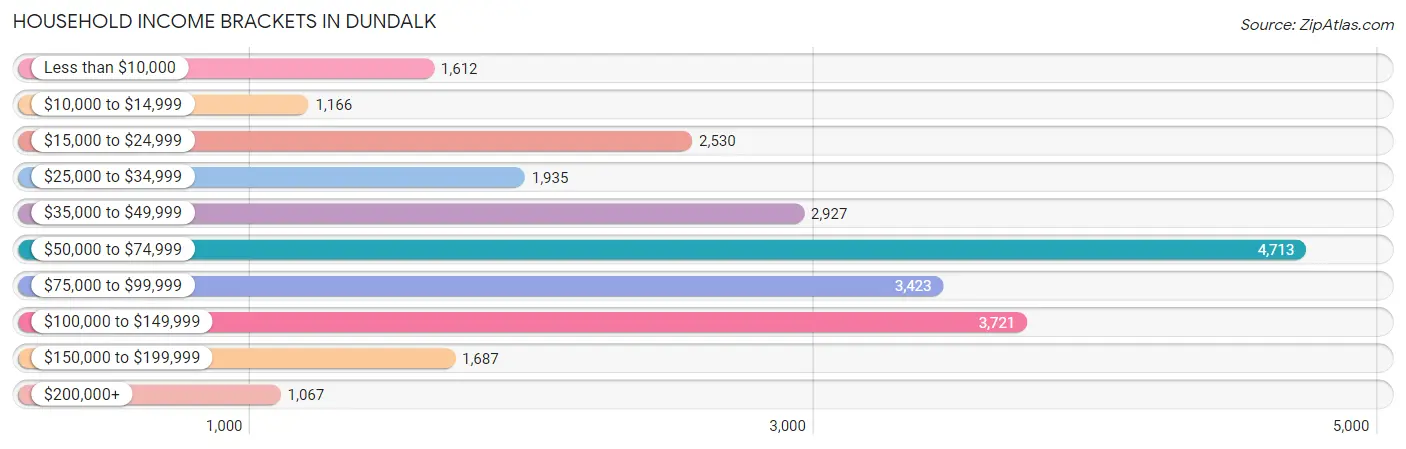
Household Income Brackets in Dundalk
With 4,713 households falling in the category, the $50,000 to $74,999 income range is the most frequent in Dundalk, accounting for 19.0% of all households. In contrast, only 1,067 households (4.3%) fall into the $200,000+ income bracket, making it the least populous group.
| Income Bracket | # Households | % Households |
| Less than $10,000 | 1,612 | 6.5% |
| $10,000 to $14,999 | 1,166 | 4.7% |
| $15,000 to $24,999 | 2,530 | 10.2% |
| $25,000 to $34,999 | 1,935 | 7.8% |
| $35,000 to $49,999 | 2,927 | 11.8% |
| $50,000 to $74,999 | 4,713 | 19.0% |
| $75,000 to $99,999 | 3,423 | 13.8% |
| $100,000 to $149,999 | 3,721 | 15.0% |
| $150,000 to $199,999 | 1,687 | 6.8% |
| $200,000+ | 1,067 | 4.3% |
Household Income by Householder Age in Dundalk
The median household income in Dundalk is $61,217, with the highest median household income of $69,207 found in the 45 to 64 years age bracket for the primary householder. A total of 8,966 households (36.1%) fall into this category. Meanwhile, the 65+ years age bracket for the primary householder has the lowest median household income of $46,315, with 6,698 households (27.0%) in this group.
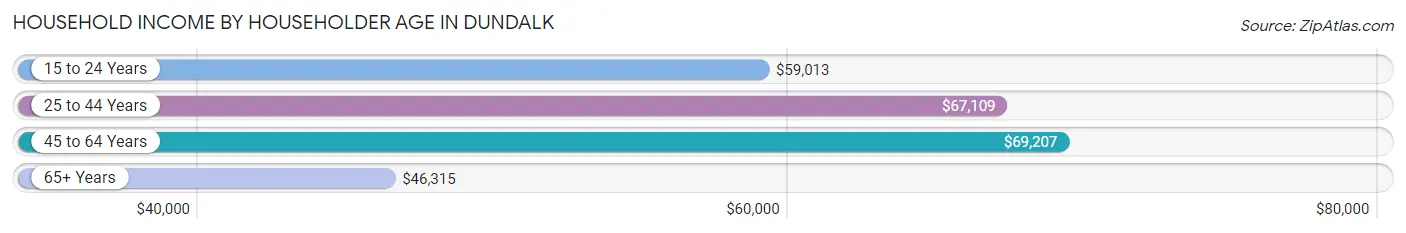
| Income Bracket | # Households | Median Income |
| 15 to 24 Years | 680 (2.7%) | $59,013 |
| 25 to 44 Years | 8,461 (34.1%) | $67,109 |
| 45 to 64 Years | 8,966 (36.1%) | $69,207 |
| 65+ Years | 6,698 (27.0%) | $46,315 |
| Total | 24,805 (100.0%) | $61,217 |
Poverty in Dundalk
Income Below Poverty by Sex and Age in Dundalk
With 15.3% poverty level for males and 23.2% for females among the residents of Dundalk, 15 year old males and 16 and 17 year old females are the most vulnerable to poverty, with 119 males (31.3%) and 272 females (38.0%) in their respective age groups living below the poverty level.
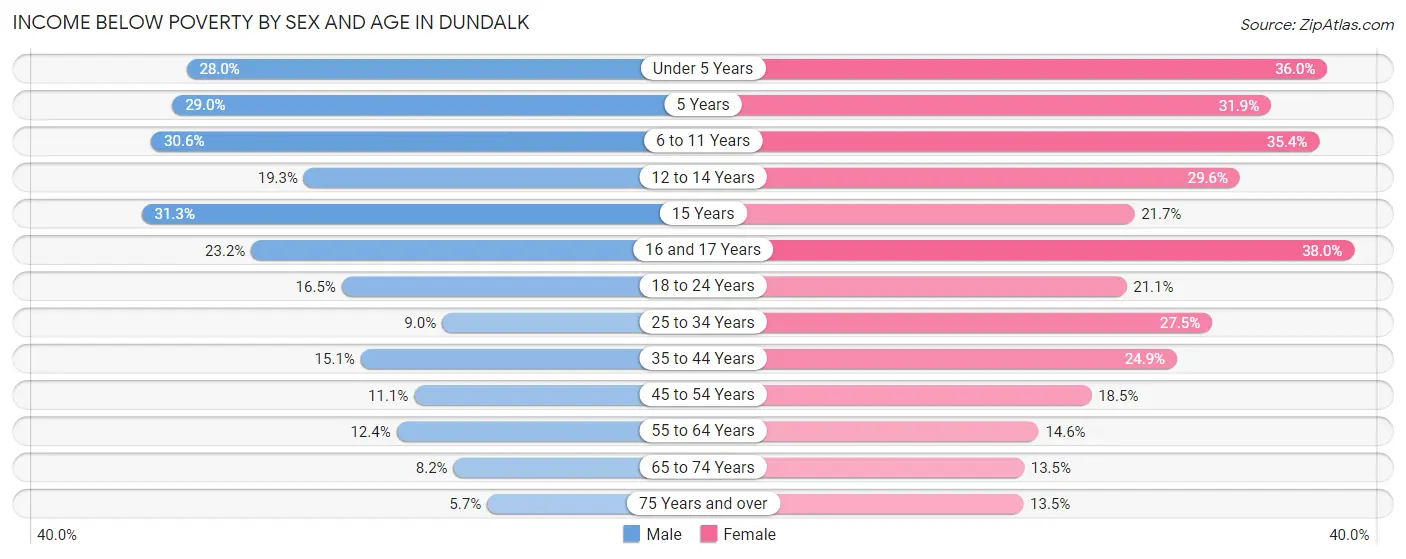
| Age Bracket | Male | Female |
| Under 5 Years | 470 (28.0%) | 804 (36.0%) |
| 5 Years | 151 (29.0%) | 138 (31.9%) |
| 6 to 11 Years | 848 (30.6%) | 1,084 (35.4%) |
| 12 to 14 Years | 281 (19.3%) | 385 (29.5%) |
| 15 Years | 119 (31.3%) | 117 (21.7%) |
| 16 and 17 Years | 210 (23.2%) | 272 (38.0%) |
| 18 to 24 Years | 488 (16.5%) | 493 (21.1%) |
| 25 to 34 Years | 446 (9.0%) | 1,320 (27.5%) |
| 35 to 44 Years | 658 (15.0%) | 1,200 (24.9%) |
| 45 to 54 Years | 405 (11.1%) | 650 (18.5%) |
| 55 to 64 Years | 449 (12.4%) | 666 (14.6%) |
| 65 to 74 Years | 229 (8.2%) | 459 (13.5%) |
| 75 Years and over | 84 (5.7%) | 326 (13.5%) |
| Total | 4,838 (15.3%) | 7,914 (23.2%) |
Income Above Poverty by Sex and Age in Dundalk
According to the poverty statistics in Dundalk, males aged 75 years and over and females aged 75 years and over are the age groups that are most secure financially, with 94.3% of males and 86.5% of females in these age groups living above the poverty line.
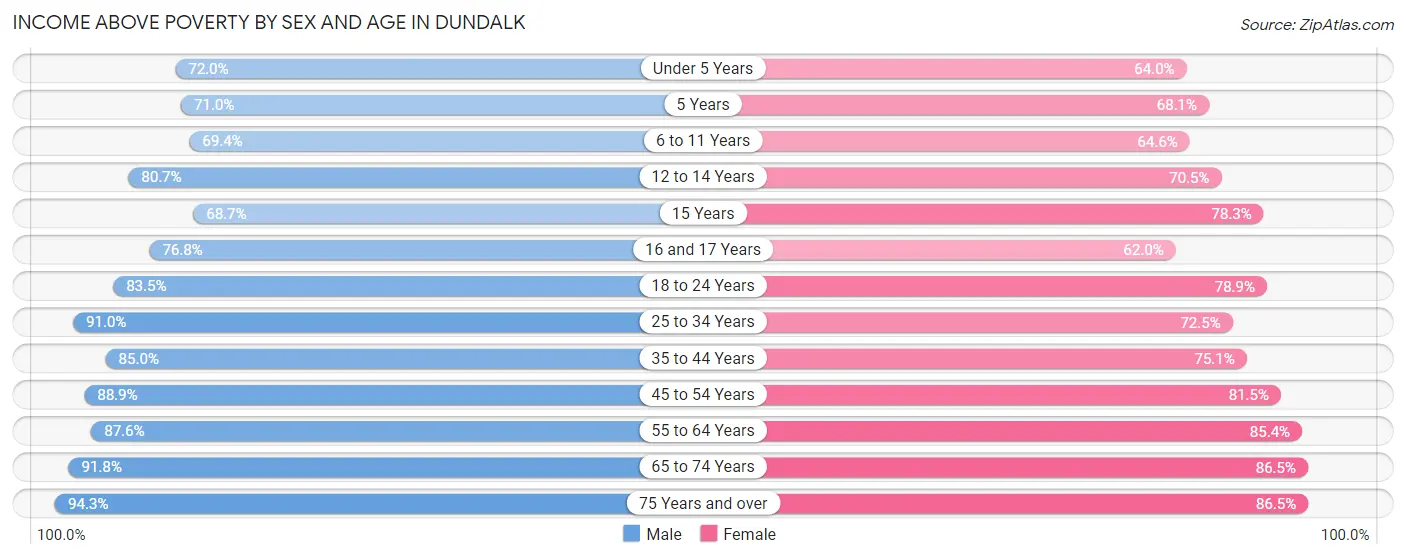
| Age Bracket | Male | Female |
| Under 5 Years | 1,210 (72.0%) | 1,427 (64.0%) |
| 5 Years | 369 (71.0%) | 295 (68.1%) |
| 6 to 11 Years | 1,923 (69.4%) | 1,975 (64.6%) |
| 12 to 14 Years | 1,177 (80.7%) | 918 (70.5%) |
| 15 Years | 261 (68.7%) | 422 (78.3%) |
| 16 and 17 Years | 696 (76.8%) | 443 (62.0%) |
| 18 to 24 Years | 2,476 (83.5%) | 1,841 (78.9%) |
| 25 to 34 Years | 4,506 (91.0%) | 3,481 (72.5%) |
| 35 to 44 Years | 3,714 (85.0%) | 3,623 (75.1%) |
| 45 to 54 Years | 3,251 (88.9%) | 2,859 (81.5%) |
| 55 to 64 Years | 3,176 (87.6%) | 3,897 (85.4%) |
| 65 to 74 Years | 2,579 (91.8%) | 2,939 (86.5%) |
| 75 Years and over | 1,398 (94.3%) | 2,096 (86.5%) |
| Total | 26,736 (84.7%) | 26,216 (76.8%) |
Income Below Poverty Among Married-Couple Families in Dundalk
The poverty statistics for married-couple families in Dundalk show that 8.5% or 786 of the total 9,222 families live below the poverty line. Families with 5 or more children have the highest poverty rate of 60.6%, comprising of 63 families. On the other hand, families with no children have the lowest poverty rate of 2.8%, which includes 154 families.
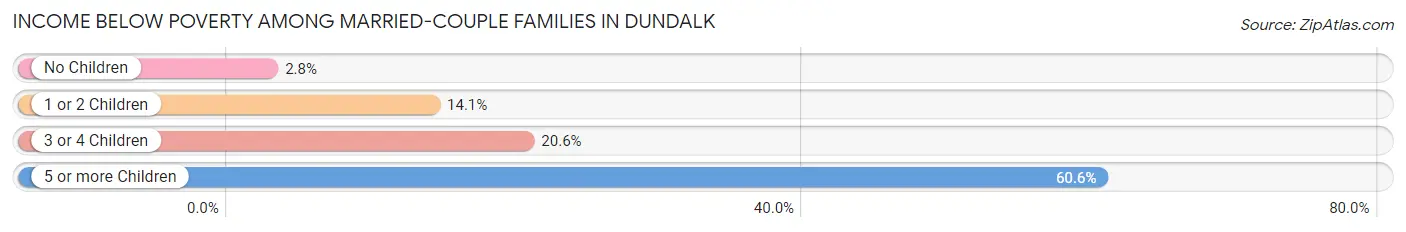
| Children | Above Poverty | Below Poverty |
| No Children | 5,340 (97.2%) | 154 (2.8%) |
| 1 or 2 Children | 2,340 (85.9%) | 383 (14.1%) |
| 3 or 4 Children | 715 (79.4%) | 186 (20.6%) |
| 5 or more Children | 41 (39.4%) | 63 (60.6%) |
| Total | 8,436 (91.5%) | 786 (8.5%) |
Income Below Poverty Among Single-Parent Households in Dundalk
According to the poverty data in Dundalk, 6.3% or 109 single-father households and 37.1% or 1,861 single-mother households are living below the poverty line. Among single-father households, those with 1 or 2 children have the highest poverty rate, with 58 households (7.3%) experiencing poverty. Likewise, among single-mother households, those with 5 or more children have the highest poverty rate, with 117 households (100.0%) falling below the poverty line.
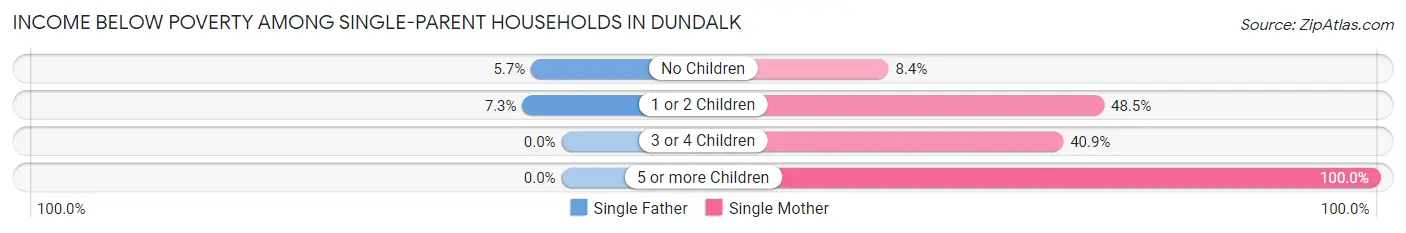
| Children | Single Father | Single Mother |
| No Children | 51 (5.7%) | 122 (8.4%) |
| 1 or 2 Children | 58 (7.3%) | 1,375 (48.5%) |
| 3 or 4 Children | 0 (0.0%) | 247 (40.9%) |
| 5 or more Children | 0 (0.0%) | 117 (100.0%) |
| Total | 109 (6.3%) | 1,861 (37.1%) |
Income Below Poverty Among Married-Couple vs Single-Parent Households in Dundalk
The poverty data for Dundalk shows that 786 of the married-couple family households (8.5%) and 1,970 of the single-parent households (29.1%) are living below the poverty level. Within the married-couple family households, those with 5 or more children have the highest poverty rate, with 63 households (60.6%) falling below the poverty line. Among the single-parent households, those with 5 or more children have the highest poverty rate, with 117 household (100.0%) living below poverty.
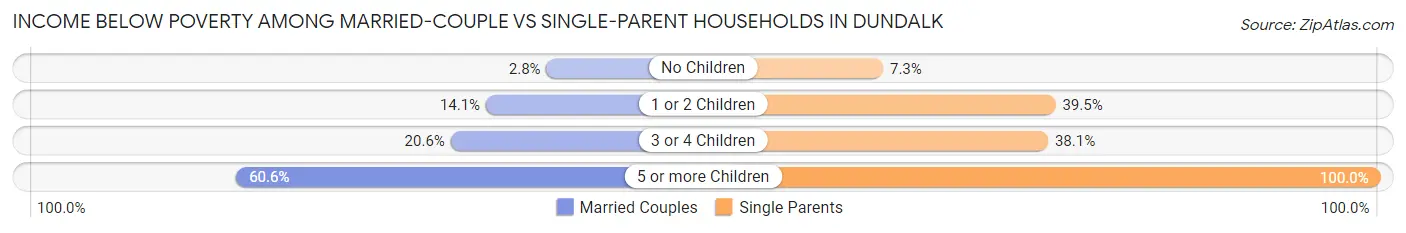
| Children | Married-Couple Families | Single-Parent Households |
| No Children | 154 (2.8%) | 173 (7.3%) |
| 1 or 2 Children | 383 (14.1%) | 1,433 (39.5%) |
| 3 or 4 Children | 186 (20.6%) | 247 (38.1%) |
| 5 or more Children | 63 (60.6%) | 117 (100.0%) |
| Total | 786 (8.5%) | 1,970 (29.1%) |
Race in Dundalk
The most populous races in Dundalk are White / Caucasian (45,194 | 68.1%), Black / African American (11,172 | 16.9%), and Hispanic or Latino (7,861 | 11.8%).
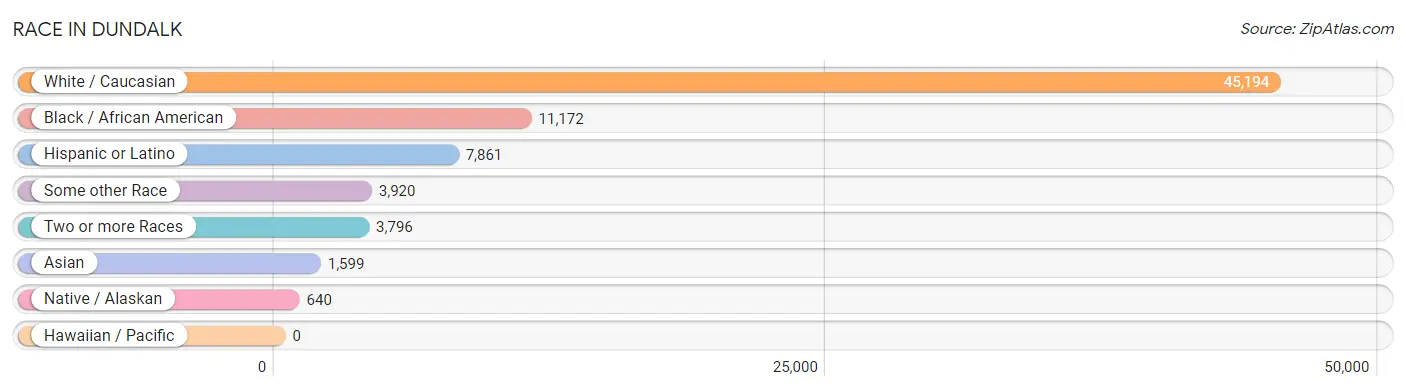
| Race | # Population | % Population |
| Asian | 1,599 | 2.4% |
| Black / African American | 11,172 | 16.9% |
| Hawaiian / Pacific | 0 | 0.0% |
| Hispanic or Latino | 7,861 | 11.8% |
| Native / Alaskan | 640 | 1.0% |
| White / Caucasian | 45,194 | 68.1% |
| Two or more Races | 3,796 | 5.7% |
| Some other Race | 3,920 | 5.9% |
| Total | 66,321 | 100.0% |
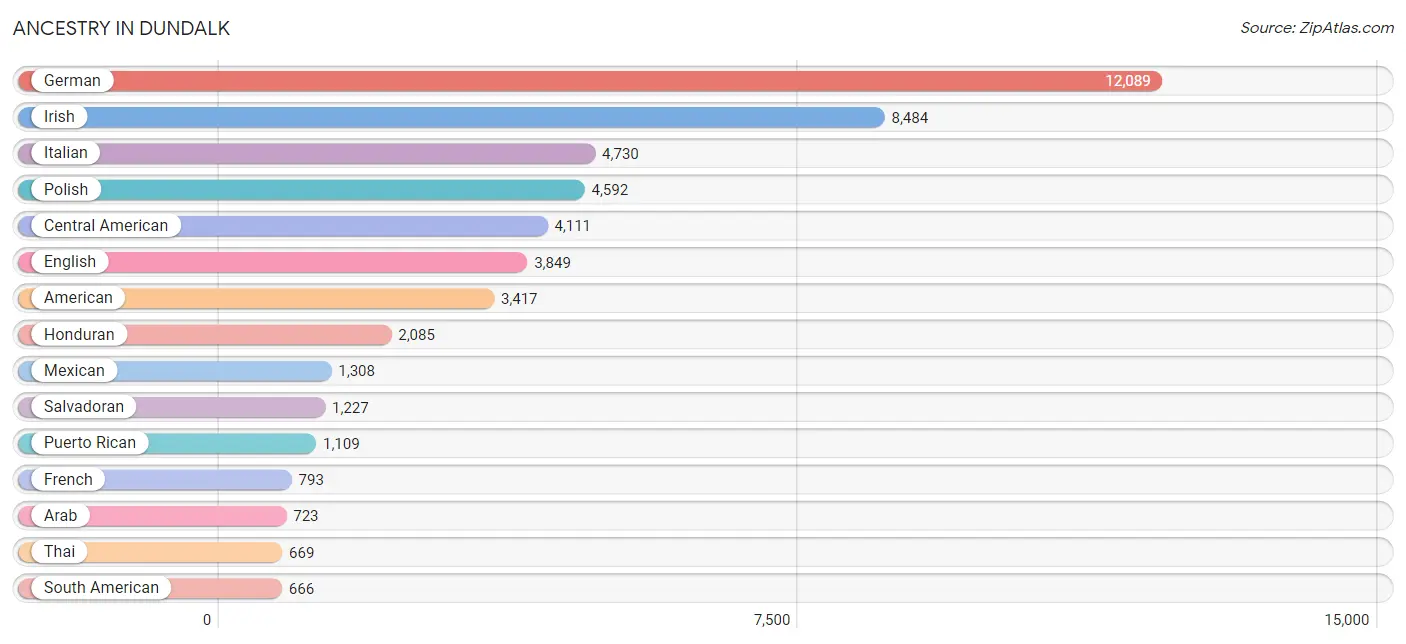
Ancestry in Dundalk
The most populous ancestries reported in Dundalk are German (12,089 | 18.2%), Irish (8,484 | 12.8%), Italian (4,730 | 7.1%), Polish (4,592 | 6.9%), and Central American (4,111 | 6.2%), together accounting for 51.3% of all Dundalk residents.
| Ancestry | # Population | % Population |
| African | 180 | 0.3% |
| American | 3,417 | 5.1% |
| Arab | 723 | 1.1% |
| Argentinean | 17 | 0.0% |
| Austrian | 4 | 0.0% |
| Bahamian | 22 | 0.0% |
| Belgian | 9 | 0.0% |
| Bhutanese | 97 | 0.2% |
| Blackfeet | 100 | 0.2% |
| British | 49 | 0.1% |
| Bulgarian | 52 | 0.1% |
| Burmese | 136 | 0.2% |
| Cajun | 8 | 0.0% |
| Canadian | 7 | 0.0% |
| Central American | 4,111 | 6.2% |
| Central American Indian | 180 | 0.3% |
| Cherokee | 165 | 0.3% |
| Chilean | 234 | 0.4% |
| Colombian | 218 | 0.3% |
| Creek | 9 | 0.0% |
| Croatian | 19 | 0.0% |
| Cuban | 138 | 0.2% |
| Czech | 163 | 0.3% |
| Czechoslovakian | 169 | 0.3% |
| Danish | 50 | 0.1% |
| Dominican | 276 | 0.4% |
| Dutch | 464 | 0.7% |
| Eastern European | 267 | 0.4% |
| Ecuadorian | 49 | 0.1% |
| Egyptian | 422 | 0.6% |
| English | 3,849 | 5.8% |
| Estonian | 7 | 0.0% |
| European | 446 | 0.7% |
| Finnish | 47 | 0.1% |
| French | 793 | 1.2% |
| French Canadian | 70 | 0.1% |
| German | 12,089 | 18.2% |
| Greek | 531 | 0.8% |
| Guatemalan | 585 | 0.9% |
| Honduran | 2,085 | 3.1% |
| Hungarian | 160 | 0.2% |
| Indian (Asian) | 225 | 0.3% |
| Iranian | 21 | 0.0% |
| Irish | 8,484 | 12.8% |
| Iroquois | 6 | 0.0% |
| Italian | 4,730 | 7.1% |
| Jamaican | 228 | 0.3% |
| Kenyan | 75 | 0.1% |
| Korean | 518 | 0.8% |
| Lebanese | 6 | 0.0% |
| Lithuanian | 103 | 0.2% |
| Lumbee | 164 | 0.3% |
| Mexican | 1,308 | 2.0% |
| Mexican American Indian | 90 | 0.1% |
| Moroccan | 172 | 0.3% |
| Nicaraguan | 15 | 0.0% |
| Nigerian | 83 | 0.1% |
| Northern European | 18 | 0.0% |
| Norwegian | 83 | 0.1% |
| Pakistani | 12 | 0.0% |
| Panamanian | 199 | 0.3% |
| Pennsylvania German | 22 | 0.0% |
| Peruvian | 96 | 0.1% |
| Polish | 4,592 | 6.9% |
| Portuguese | 132 | 0.2% |
| Puerto Rican | 1,109 | 1.7% |
| Romanian | 12 | 0.0% |
| Russian | 182 | 0.3% |
| Salvadoran | 1,227 | 1.8% |
| Scandinavian | 49 | 0.1% |
| Scotch-Irish | 371 | 0.6% |
| Scottish | 587 | 0.9% |
| Serbian | 17 | 0.0% |
| Slovak | 46 | 0.1% |
| Slovene | 14 | 0.0% |
| South American | 666 | 1.0% |
| Spaniard | 73 | 0.1% |
| Spanish | 38 | 0.1% |
| Sri Lankan | 55 | 0.1% |
| Subsaharan African | 435 | 0.7% |
| Sudanese | 95 | 0.1% |
| Swedish | 84 | 0.1% |
| Swiss | 21 | 0.0% |
| Syrian | 107 | 0.2% |
| Thai | 669 | 1.0% |
| Trinidadian and Tobagonian | 69 | 0.1% |
| Turkish | 6 | 0.0% |
| Ugandan | 2 | 0.0% |
| Ukrainian | 210 | 0.3% |
| Uruguayan | 35 | 0.1% |
| Venezuelan | 17 | 0.0% |
| Vietnamese | 110 | 0.2% |
| Welsh | 165 | 0.3% |
| West Indian | 19 | 0.0% | View All 94 Rows |
Immigrants in Dundalk
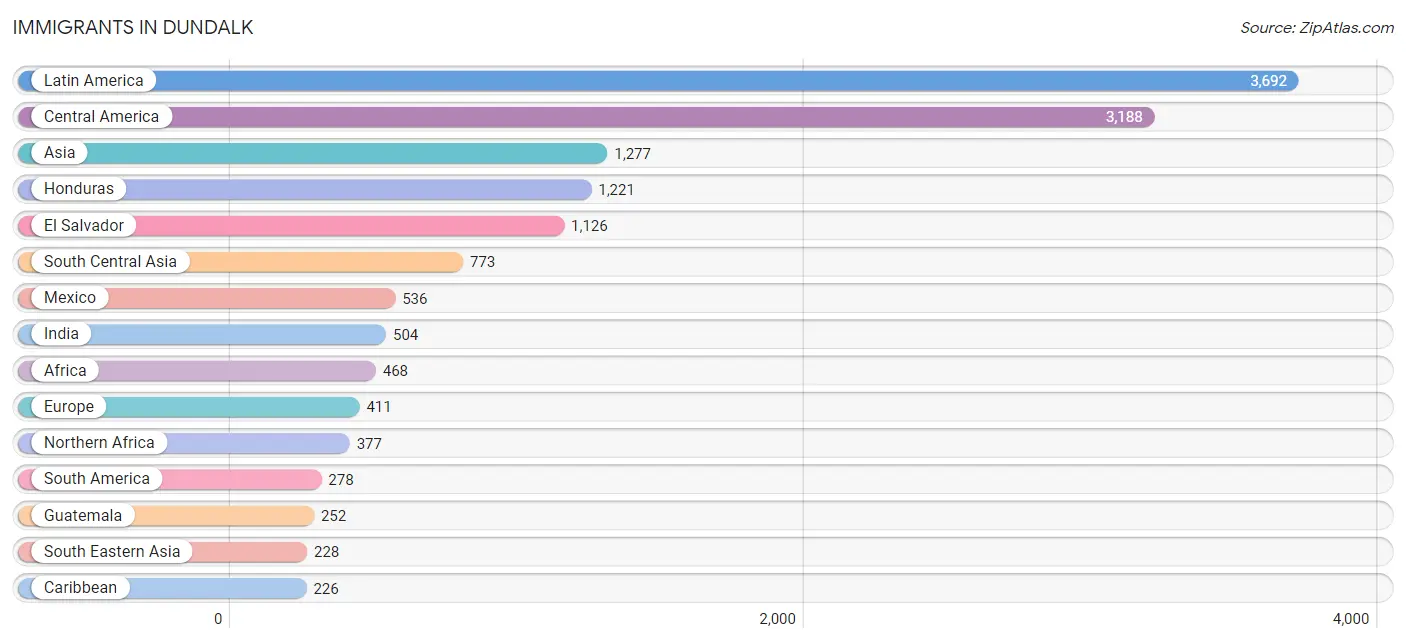
The most numerous immigrant groups reported in Dundalk came from Latin America (3,692 | 5.6%), Central America (3,188 | 4.8%), Asia (1,277 | 1.9%), Honduras (1,221 | 1.8%), and El Salvador (1,126 | 1.7%), together accounting for 15.9% of all Dundalk residents.
| Immigration Origin | # Population | % Population |
| Africa | 468 | 0.7% |
| Argentina | 17 | 0.0% |
| Asia | 1,277 | 1.9% |
| Australia | 9 | 0.0% |
| Bahamas | 22 | 0.0% |
| Bangladesh | 70 | 0.1% |
| Bulgaria | 52 | 0.1% |
| Canada | 20 | 0.0% |
| Caribbean | 226 | 0.3% |
| Central America | 3,188 | 4.8% |
| China | 92 | 0.1% |
| Colombia | 111 | 0.2% |
| Dominican Republic | 128 | 0.2% |
| Eastern Africa | 66 | 0.1% |
| Eastern Asia | 137 | 0.2% |
| Eastern Europe | 65 | 0.1% |
| Ecuador | 8 | 0.0% |
| Egypt | 209 | 0.3% |
| El Salvador | 1,126 | 1.7% |
| England | 21 | 0.0% |
| Europe | 411 | 0.6% |
| Germany | 221 | 0.3% |
| Greece | 74 | 0.1% |
| Guatemala | 252 | 0.4% |
| Guyana | 12 | 0.0% |
| Honduras | 1,221 | 1.8% |
| India | 504 | 0.8% |
| Iran | 21 | 0.0% |
| Kenya | 62 | 0.1% |
| Korea | 45 | 0.1% |
| Latin America | 3,692 | 5.6% |
| Mexico | 536 | 0.8% |
| Morocco | 107 | 0.2% |
| Nepal | 41 | 0.1% |
| Nigeria | 25 | 0.0% |
| Northern Africa | 377 | 0.6% |
| Northern Europe | 27 | 0.0% |
| Oceania | 9 | 0.0% |
| Pakistan | 137 | 0.2% |
| Panama | 53 | 0.1% |
| Peru | 73 | 0.1% |
| Philippines | 203 | 0.3% |
| Poland | 6 | 0.0% |
| Portugal | 6 | 0.0% |
| Russia | 4 | 0.0% |
| South America | 278 | 0.4% |
| South Central Asia | 773 | 1.2% |
| South Eastern Asia | 228 | 0.3% |
| Southern Europe | 98 | 0.2% |
| Spain | 18 | 0.0% |
| Sudan | 61 | 0.1% |
| Syria | 92 | 0.1% |
| Thailand | 12 | 0.0% |
| Trinidad and Tobago | 76 | 0.1% |
| Uganda | 4 | 0.0% |
| Uruguay | 35 | 0.1% |
| Venezuela | 17 | 0.0% |
| Vietnam | 13 | 0.0% |
| Western Africa | 25 | 0.0% |
| Western Asia | 139 | 0.2% |
| Western Europe | 221 | 0.3% | View All 61 Rows |
Sex and Age in Dundalk
Sex and Age in Dundalk
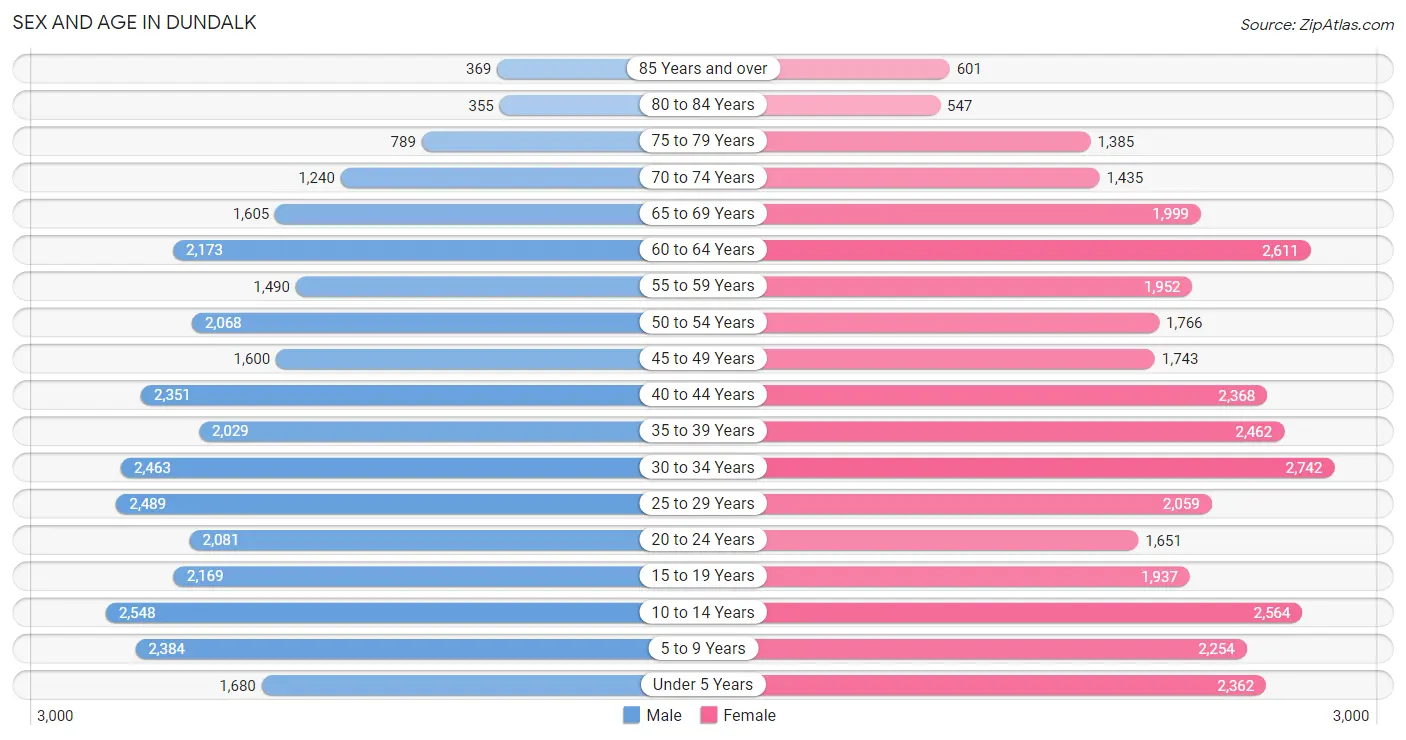
The most populous age groups in Dundalk are 10 to 14 Years (2,548 | 8.0%) for men and 30 to 34 Years (2,742 | 8.0%) for women.
| Age Bracket | Male | Female |
| Under 5 Years | 1,680 (5.3%) | 2,362 (6.9%) |
| 5 to 9 Years | 2,384 (7.5%) | 2,254 (6.6%) |
| 10 to 14 Years | 2,548 (8.0%) | 2,564 (7.4%) |
| 15 to 19 Years | 2,169 (6.8%) | 1,937 (5.6%) |
| 20 to 24 Years | 2,081 (6.5%) | 1,651 (4.8%) |
| 25 to 29 Years | 2,489 (7.8%) | 2,059 (6.0%) |
| 30 to 34 Years | 2,463 (7.7%) | 2,742 (8.0%) |
| 35 to 39 Years | 2,029 (6.4%) | 2,462 (7.1%) |
| 40 to 44 Years | 2,351 (7.4%) | 2,368 (6.9%) |
| 45 to 49 Years | 1,600 (5.0%) | 1,743 (5.1%) |
| 50 to 54 Years | 2,068 (6.5%) | 1,766 (5.1%) |
| 55 to 59 Years | 1,490 (4.7%) | 1,952 (5.7%) |
| 60 to 64 Years | 2,173 (6.8%) | 2,611 (7.6%) |
| 65 to 69 Years | 1,605 (5.0%) | 1,999 (5.8%) |
| 70 to 74 Years | 1,240 (3.9%) | 1,435 (4.2%) |
| 75 to 79 Years | 789 (2.5%) | 1,385 (4.0%) |
| 80 to 84 Years | 355 (1.1%) | 547 (1.6%) |
| 85 Years and over | 369 (1.2%) | 601 (1.8%) |
| Total | 31,883 (100.0%) | 34,438 (100.0%) |
Families and Households in Dundalk
Median Family Size in Dundalk
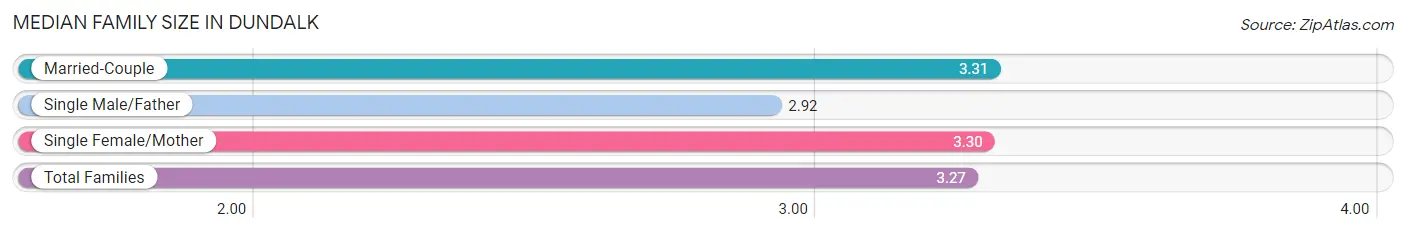
The median family size in Dundalk is 3.27 persons per family, with married-couple families (9,222 | 57.7%) accounting for the largest median family size of 3.31 persons per family. On the other hand, single male/father families (1,741 | 10.9%) represent the smallest median family size with 2.92 persons per family.
| Family Type | # Families | Family Size |
| Married-Couple | 9,222 (57.7%) | 3.31 |
| Single Male/Father | 1,741 (10.9%) | 2.92 |
| Single Female/Mother | 5,016 (31.4%) | 3.30 |
| Total Families | 15,979 (100.0%) | 3.27 |
Median Household Size in Dundalk
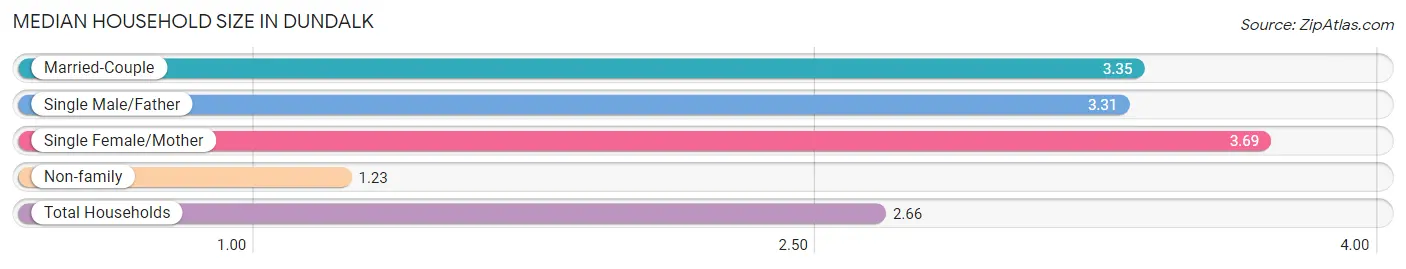
The median household size in Dundalk is 2.66 persons per household, with single female/mother households (5,016 | 20.2%) accounting for the largest median household size of 3.69 persons per household. non-family households (8,826 | 35.6%) represent the smallest median household size with 1.23 persons per household.
| Household Type | # Households | Household Size |
| Married-Couple | 9,222 (37.2%) | 3.35 |
| Single Male/Father | 1,741 (7.0%) | 3.31 |
| Single Female/Mother | 5,016 (20.2%) | 3.69 |
| Non-family | 8,826 (35.6%) | 1.23 |
| Total Households | 24,805 (100.0%) | 2.66 |
Household Size by Marriage Status in Dundalk
Out of a total of 24,805 households in Dundalk, 15,979 (64.4%) are family households, while 8,826 (35.6%) are nonfamily households. The most numerous type of family households are 2-person households, comprising 6,136, and the most common type of nonfamily households are 1-person households, comprising 7,189.
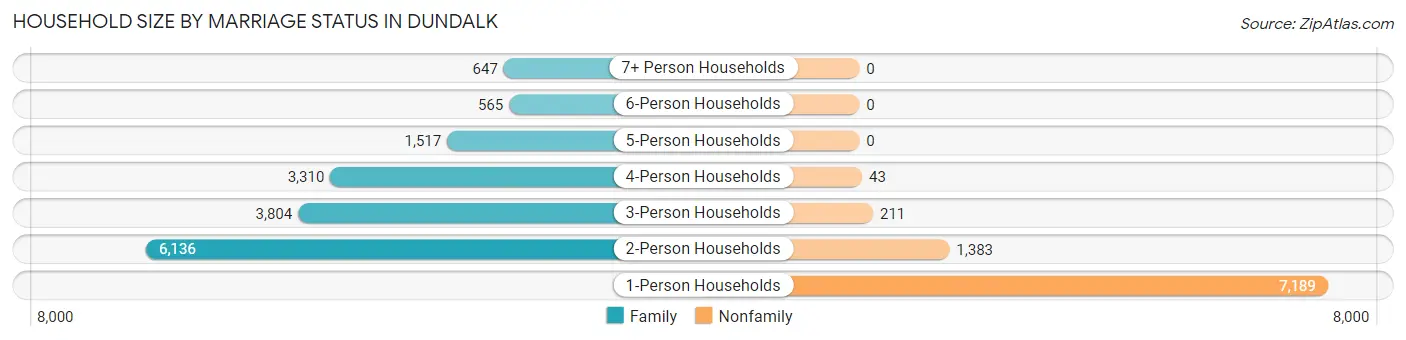
| Household Size | Family Households | Nonfamily Households |
| 1-Person Households | - | 7,189 (29.0%) |
| 2-Person Households | 6,136 (24.7%) | 1,383 (5.6%) |
| 3-Person Households | 3,804 (15.3%) | 211 (0.9%) |
| 4-Person Households | 3,310 (13.3%) | 43 (0.2%) |
| 5-Person Households | 1,517 (6.1%) | 0 (0.0%) |
| 6-Person Households | 565 (2.3%) | 0 (0.0%) |
| 7+ Person Households | 647 (2.6%) | 0 (0.0%) |
| Total | 15,979 (64.4%) | 8,826 (35.6%) |
Female Fertility in Dundalk
Fertility by Age in Dundalk
Average fertility rate in Dundalk is 46.0 births per 1,000 women. Women in the age bracket of 20 to 34 years have the highest fertility rate with 80.0 births per 1,000 women. Women in the age bracket of 20 to 34 years acount for 74.3% of all women with births.
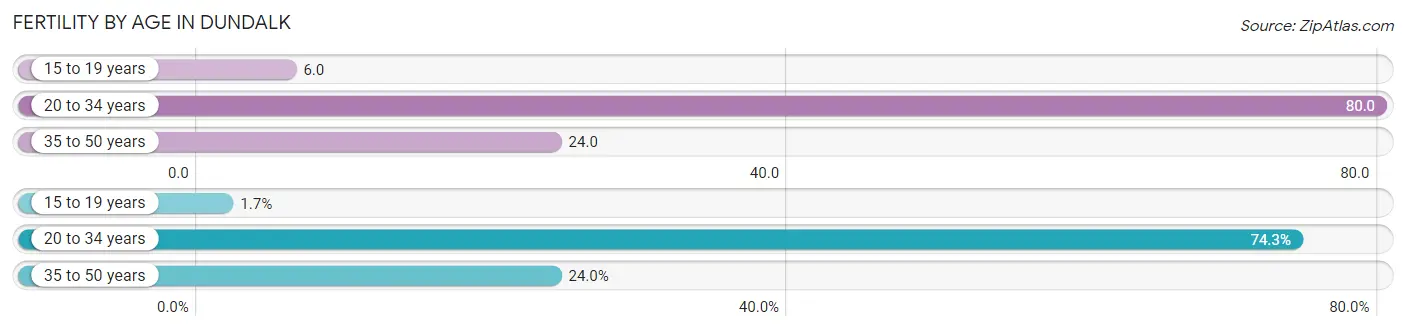
| Age Bracket | Women with Births | Births / 1,000 Women |
| 15 to 19 years | 12 (1.7%) | 6.0 |
| 20 to 34 years | 517 (74.3%) | 80.0 |
| 35 to 50 years | 167 (24.0%) | 24.0 |
| Total | 696 (100.0%) | 46.0 |
Fertility by Age by Marriage Status in Dundalk
48.9% of women with births (696) in Dundalk are married. The highest percentage of unmarried women with births falls into 15 to 19 years age bracket with 100.0% of them unmarried at the time of birth, while the lowest percentage of unmarried women with births belong to 35 to 50 years age bracket with 44.9% of them unmarried.
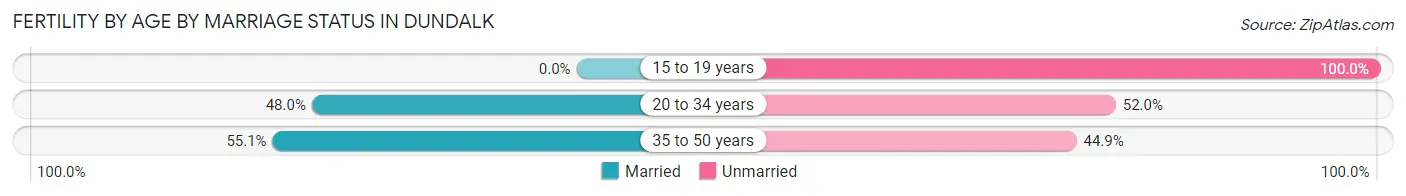
| Age Bracket | Married | Unmarried |
| 15 to 19 years | 0 (0.0%) | 12 (100.0%) |
| 20 to 34 years | 248 (48.0%) | 269 (52.0%) |
| 35 to 50 years | 92 (55.1%) | 75 (44.9%) |
| Total | 340 (48.8%) | 356 (51.1%) |
Fertility by Education in Dundalk
Average fertility rate in Dundalk is 46.0 births per 1,000 women. Women with the education attainment of college or associate's degree have the highest fertility rate of 65.0 births per 1,000 women, while women with the education attainment of less than high school have the lowest fertility at 21.0 births per 1,000 women. Women with the education attainment of college or associate's degree represent 39.2% of all women with births.
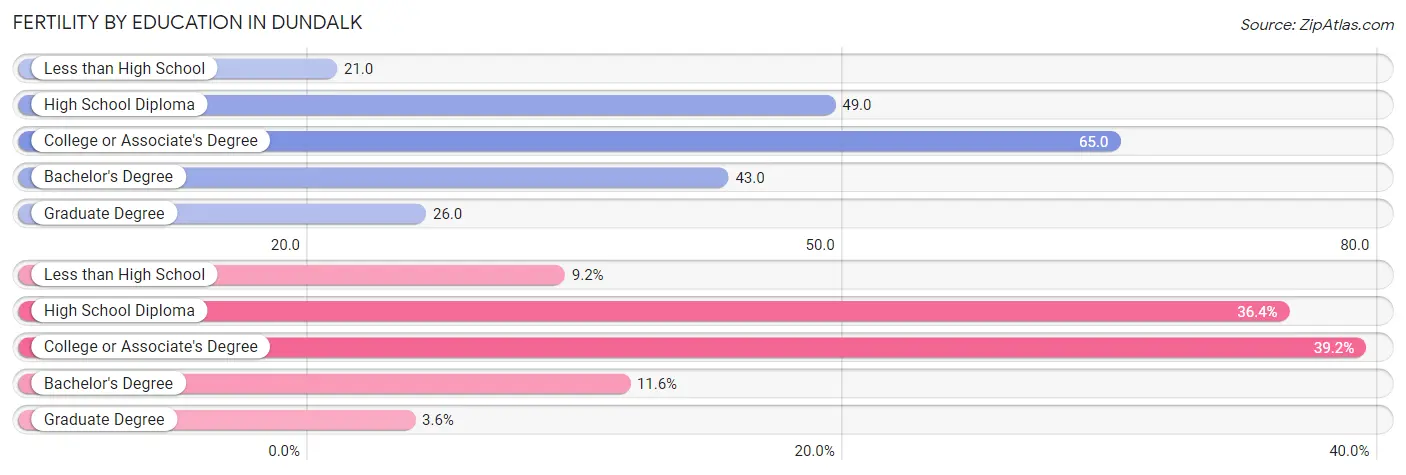
| Educational Attainment | Women with Births | Births / 1,000 Women |
| Less than High School | 64 (9.2%) | 21.0 |
| High School Diploma | 253 (36.3%) | 49.0 |
| College or Associate's Degree | 273 (39.2%) | 65.0 |
| Bachelor's Degree | 81 (11.6%) | 43.0 |
| Graduate Degree | 25 (3.6%) | 26.0 |
| Total | 696 (100.0%) | 46.0 |
Fertility by Education by Marriage Status in Dundalk
51.1% of women with births in Dundalk are unmarried. Women with the educational attainment of less than high school are most likely to be married with 100.0% of them married at childbirth, while women with the educational attainment of high school diploma are least likely to be married with 79.8% of them unmarried at childbirth.
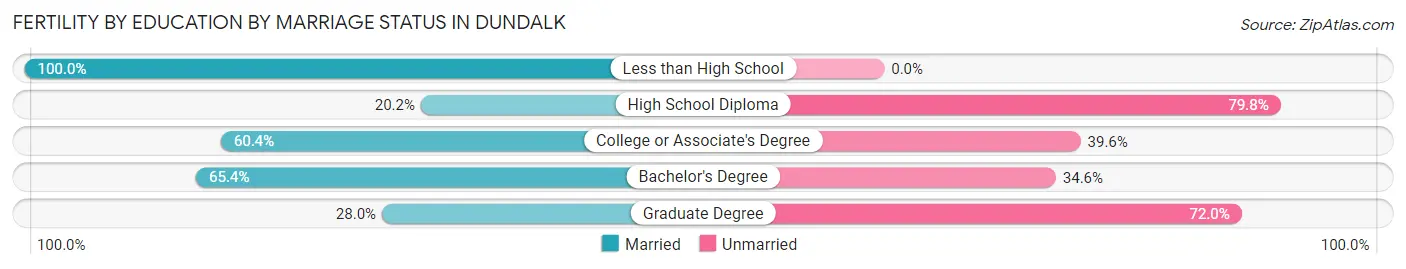
| Educational Attainment | Married | Unmarried |
| Less than High School | 64 (100.0%) | 0 (0.0%) |
| High School Diploma | 51 (20.2%) | 202 (79.8%) |
| College or Associate's Degree | 165 (60.4%) | 108 (39.6%) |
| Bachelor's Degree | 53 (65.4%) | 28 (34.6%) |
| Graduate Degree | 7 (28.0%) | 18 (72.0%) |
| Total | 340 (48.8%) | 356 (51.1%) |
Employment Characteristics in Dundalk
Employment by Class of Employer in Dundalk
Among the 28,796 employed individuals in Dundalk, private company employees (20,911 | 72.6%), not-for-profit organizations (2,172 | 7.5%), and local government employees (1,490 | 5.2%) make up the most common classes of employment.
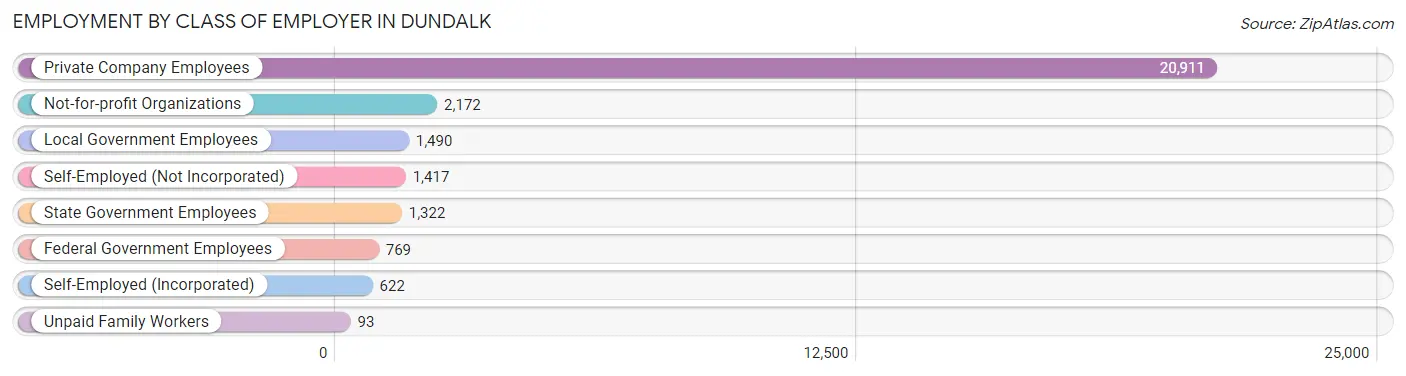
| Employer Class | # Employees | % Employees |
| Private Company Employees | 20,911 | 72.6% |
| Self-Employed (Incorporated) | 622 | 2.2% |
| Self-Employed (Not Incorporated) | 1,417 | 4.9% |
| Not-for-profit Organizations | 2,172 | 7.5% |
| Local Government Employees | 1,490 | 5.2% |
| State Government Employees | 1,322 | 4.6% |
| Federal Government Employees | 769 | 2.7% |
| Unpaid Family Workers | 93 | 0.3% |
| Total | 28,796 | 100.0% |
Employment Status by Age in Dundalk
According to the labor force statistics for Dundalk, out of the total population over 16 years of age (51,610), 61.4% or 31,689 individuals are in the labor force, with 6.9% or 2,187 of them unemployed. The age group with the highest labor force participation rate is 25 to 29 years, with 82.3% or 3,743 individuals in the labor force. Within the labor force, the 75 years and over age range has the highest percentage of unemployed individuals, with 21.3% or 39 of them being unemployed.
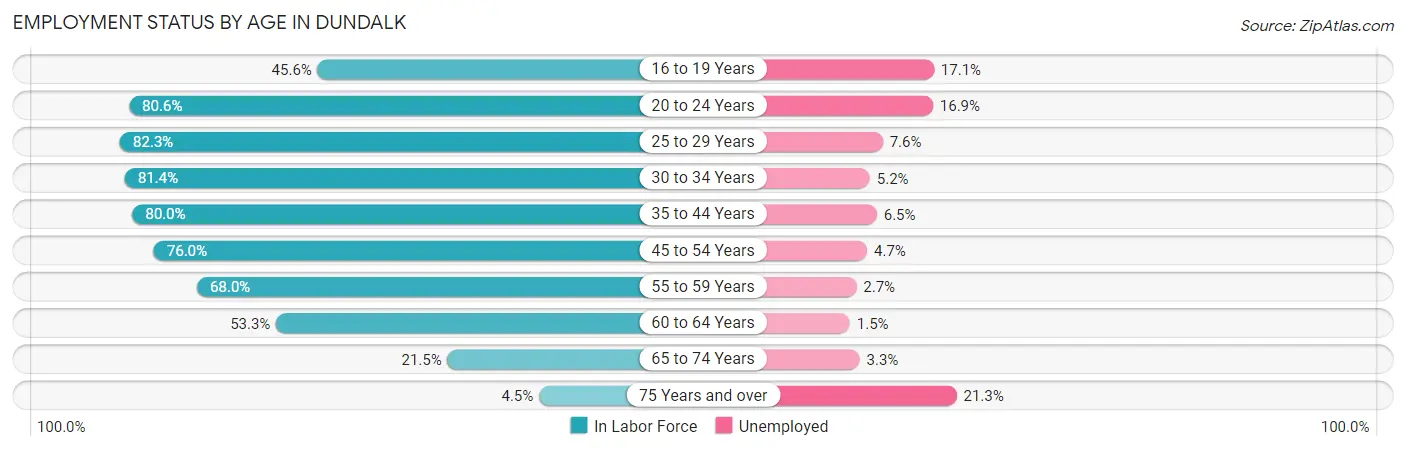
| Age Bracket | In Labor Force | Unemployed |
| 16 to 19 Years | 1,453 (45.6%) | 248 (17.1%) |
| 20 to 24 Years | 3,008 (80.6%) | 508 (16.9%) |
| 25 to 29 Years | 3,743 (82.3%) | 284 (7.6%) |
| 30 to 34 Years | 4,237 (81.4%) | 220 (5.2%) |
| 35 to 44 Years | 7,368 (80.0%) | 479 (6.5%) |
| 45 to 54 Years | 5,455 (76.0%) | 256 (4.7%) |
| 55 to 59 Years | 2,341 (68.0%) | 63 (2.7%) |
| 60 to 64 Years | 2,550 (53.3%) | 38 (1.5%) |
| 65 to 74 Years | 1,350 (21.5%) | 45 (3.3%) |
| 75 Years and over | 182 (4.5%) | 39 (21.3%) |
| Total | 31,689 (61.4%) | 2,187 (6.9%) |
Employment Status by Educational Attainment in Dundalk
According to labor force statistics for Dundalk, 74.7% of individuals (25,671) out of the total population between 25 and 64 years of age (34,366) are in the labor force, with 5.2% or 1,335 of them being unemployed. The group with the highest labor force participation rate are those with the educational attainment of bachelor's degree or higher, with 85.9% or 4,615 individuals in the labor force. Within the labor force, individuals with high school diploma education have the highest percentage of unemployment, with 6.5% or 654 of them being unemployed.
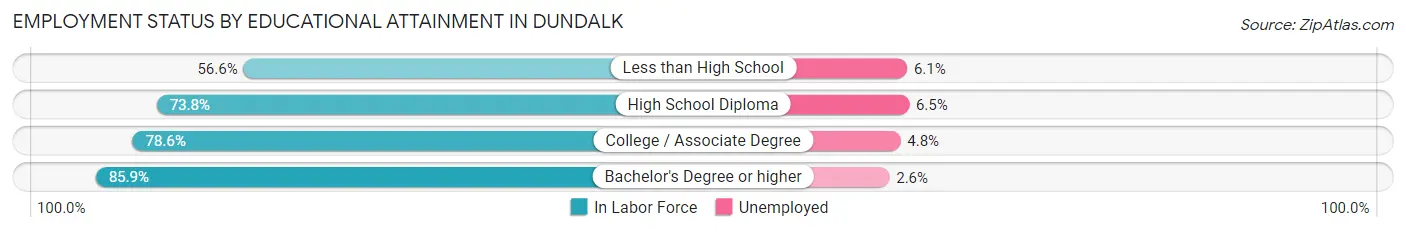
| Educational Attainment | In Labor Force | Unemployed |
| Less than High School | 2,762 (56.6%) | 298 (6.1%) |
| High School Diploma | 10,068 (73.8%) | 887 (6.5%) |
| College / Associate Degree | 8,232 (78.6%) | 503 (4.8%) |
| Bachelor's Degree or higher | 4,615 (85.9%) | 140 (2.6%) |
| Total | 25,671 (74.7%) | 1,787 (5.2%) |
Employment Occupations by Sex in Dundalk
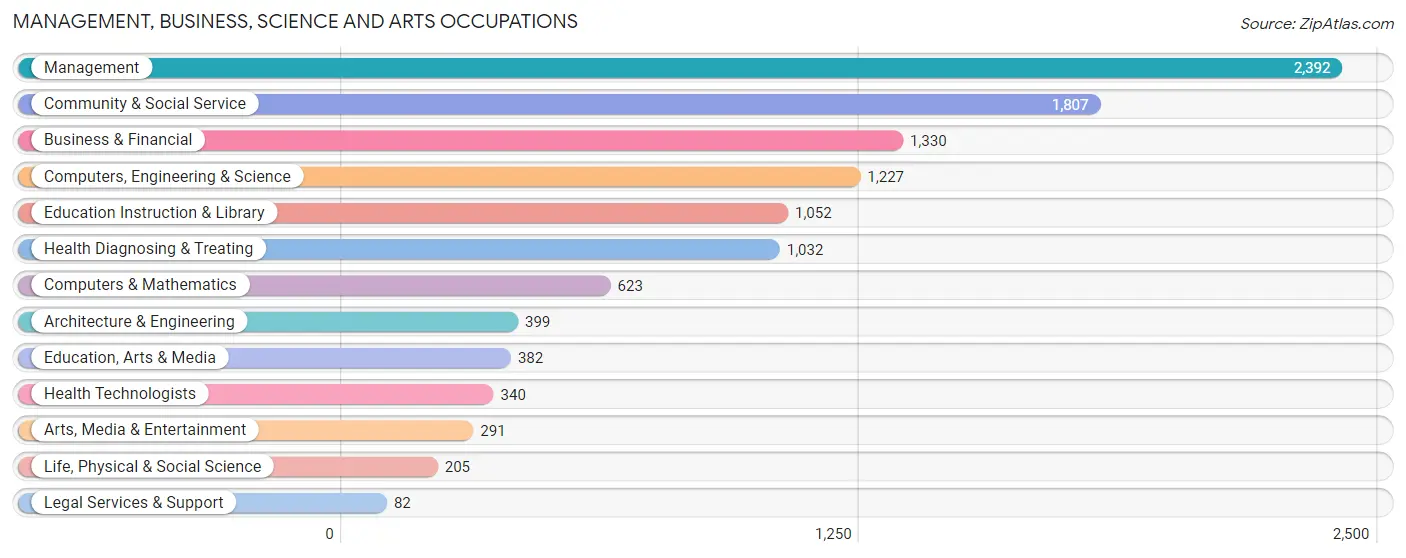
Management, Business, Science and Arts Occupations
The most common Management, Business, Science and Arts occupations in Dundalk are Management (2,392 | 8.1%), Community & Social Service (1,807 | 6.1%), Business & Financial (1,330 | 4.5%), Computers, Engineering & Science (1,227 | 4.2%), and Education Instruction & Library (1,052 | 3.6%).
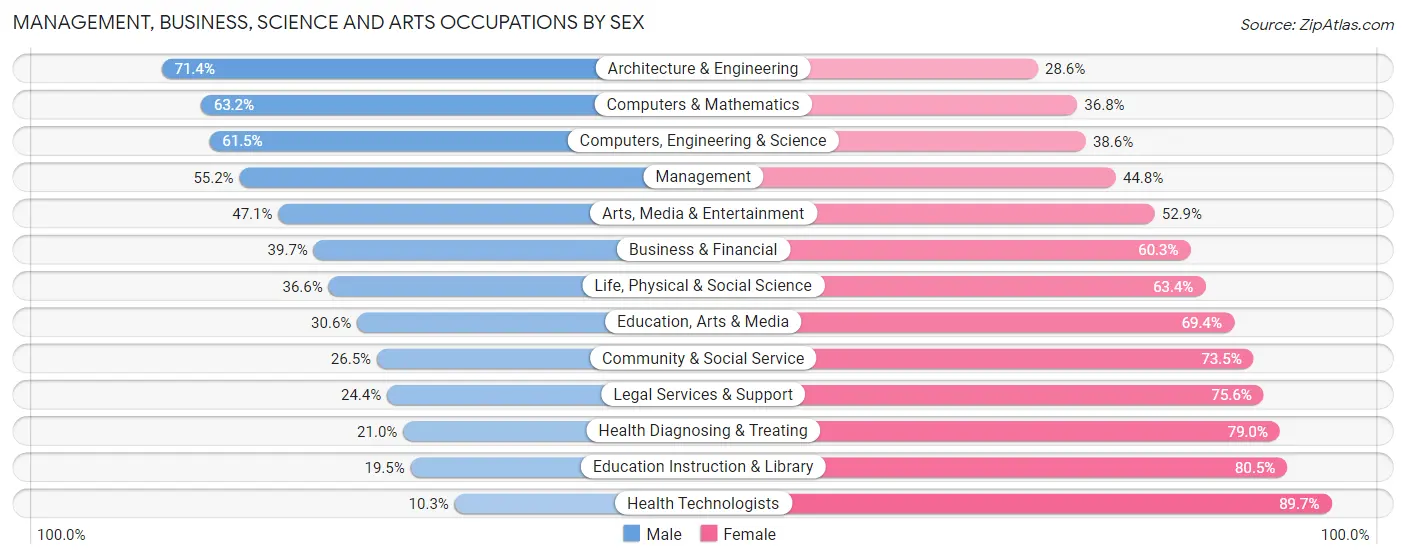
Management, Business, Science and Arts Occupations by Sex
Within the Management, Business, Science and Arts occupations in Dundalk, the most male-oriented occupations are Architecture & Engineering (71.4%), Computers & Mathematics (63.2%), and Computers, Engineering & Science (61.5%), while the most female-oriented occupations are Health Technologists (89.7%), Education Instruction & Library (80.5%), and Health Diagnosing & Treating (79.0%).
| Occupation | Male | Female |
| Management | 1,320 (55.2%) | 1,072 (44.8%) |
| Business & Financial | 528 (39.7%) | 802 (60.3%) |
| Computers, Engineering & Science | 754 (61.5%) | 473 (38.6%) |
| Computers & Mathematics | 394 (63.2%) | 229 (36.8%) |
| Architecture & Engineering | 285 (71.4%) | 114 (28.6%) |
| Life, Physical & Social Science | 75 (36.6%) | 130 (63.4%) |
| Community & Social Service | 479 (26.5%) | 1,328 (73.5%) |
| Education, Arts & Media | 117 (30.6%) | 265 (69.4%) |
| Legal Services & Support | 20 (24.4%) | 62 (75.6%) |
| Education Instruction & Library | 205 (19.5%) | 847 (80.5%) |
| Arts, Media & Entertainment | 137 (47.1%) | 154 (52.9%) |
| Health Diagnosing & Treating | 217 (21.0%) | 815 (79.0%) |
| Health Technologists | 35 (10.3%) | 305 (89.7%) |
| Total (Category) | 3,298 (42.3%) | 4,490 (57.7%) |
| Total (Overall) | 15,863 (53.8%) | 13,613 (46.2%) |
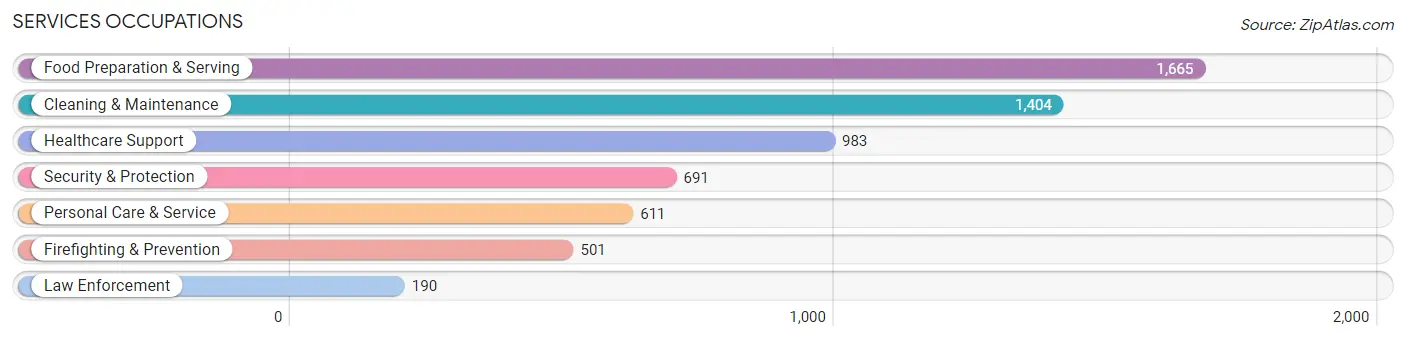
Services Occupations
The most common Services occupations in Dundalk are Food Preparation & Serving (1,665 | 5.7%), Cleaning & Maintenance (1,404 | 4.8%), Healthcare Support (983 | 3.3%), Security & Protection (691 | 2.3%), and Personal Care & Service (611 | 2.1%).
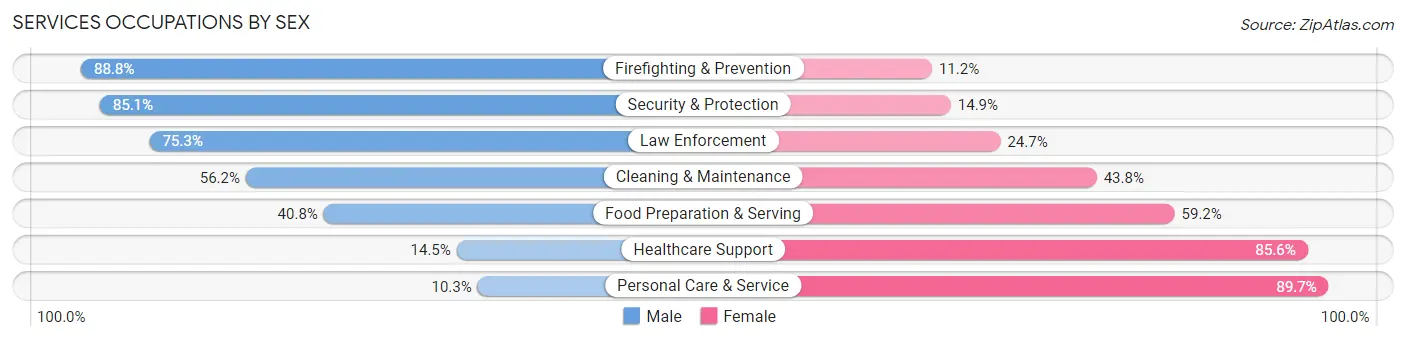
Services Occupations by Sex
Within the Services occupations in Dundalk, the most male-oriented occupations are Firefighting & Prevention (88.8%), Security & Protection (85.1%), and Law Enforcement (75.3%), while the most female-oriented occupations are Personal Care & Service (89.7%), Healthcare Support (85.6%), and Food Preparation & Serving (59.2%).
| Occupation | Male | Female |
| Healthcare Support | 142 (14.4%) | 841 (85.6%) |
| Security & Protection | 588 (85.1%) | 103 (14.9%) |
| Firefighting & Prevention | 445 (88.8%) | 56 (11.2%) |
| Law Enforcement | 143 (75.3%) | 47 (24.7%) |
| Food Preparation & Serving | 679 (40.8%) | 986 (59.2%) |
| Cleaning & Maintenance | 789 (56.2%) | 615 (43.8%) |
| Personal Care & Service | 63 (10.3%) | 548 (89.7%) |
| Total (Category) | 2,261 (42.2%) | 3,093 (57.8%) |
| Total (Overall) | 15,863 (53.8%) | 13,613 (46.2%) |
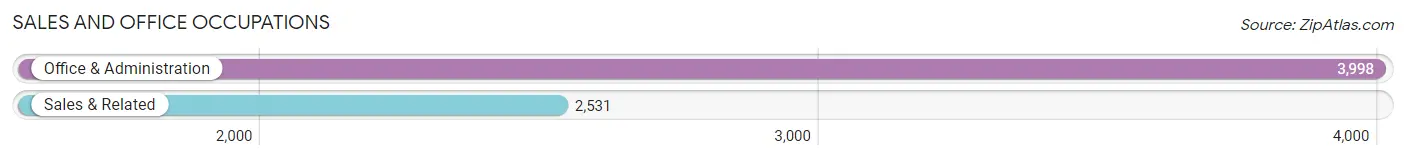
Sales and Office Occupations
The most common Sales and Office occupations in Dundalk are Office & Administration (3,998 | 13.6%), and Sales & Related (2,531 | 8.6%).
Sales and Office Occupations by Sex
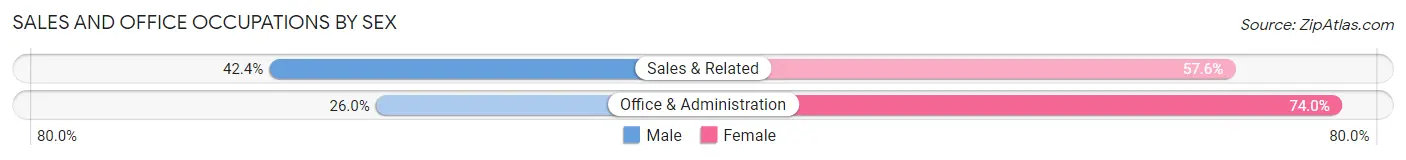
| Occupation | Male | Female |
| Sales & Related | 1,073 (42.4%) | 1,458 (57.6%) |
| Office & Administration | 1,040 (26.0%) | 2,958 (74.0%) |
| Total (Category) | 2,113 (32.4%) | 4,416 (67.6%) |
| Total (Overall) | 15,863 (53.8%) | 13,613 (46.2%) |
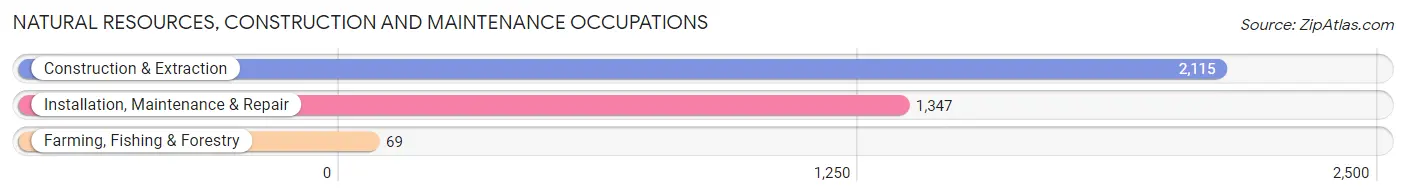
Natural Resources, Construction and Maintenance Occupations
The most common Natural Resources, Construction and Maintenance occupations in Dundalk are Construction & Extraction (2,115 | 7.2%), Installation, Maintenance & Repair (1,347 | 4.6%), and Farming, Fishing & Forestry (69 | 0.2%).
Natural Resources, Construction and Maintenance Occupations by Sex
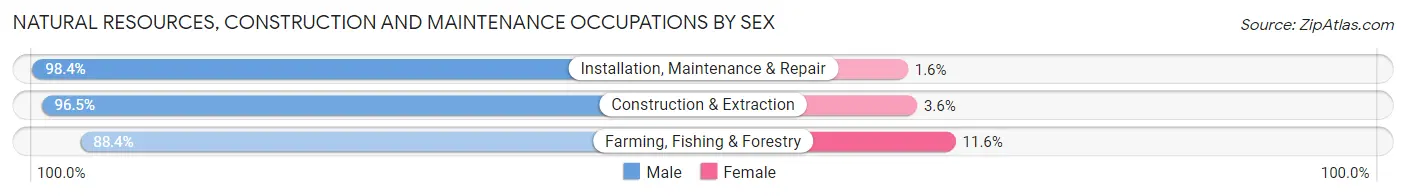
| Occupation | Male | Female |
| Farming, Fishing & Forestry | 61 (88.4%) | 8 (11.6%) |
| Construction & Extraction | 2,040 (96.5%) | 75 (3.5%) |
| Installation, Maintenance & Repair | 1,325 (98.4%) | 22 (1.6%) |
| Total (Category) | 3,426 (97.0%) | 105 (3.0%) |
| Total (Overall) | 15,863 (53.8%) | 13,613 (46.2%) |
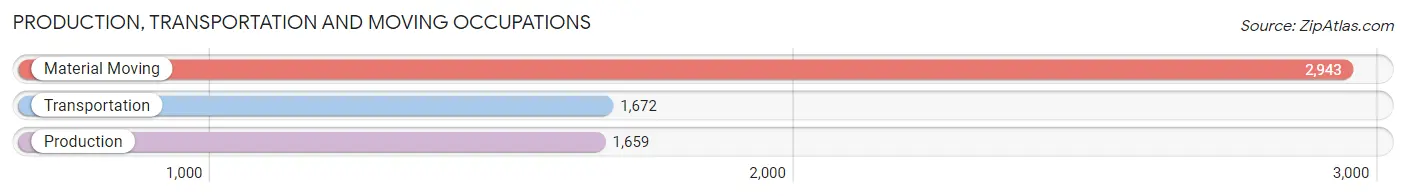
Production, Transportation and Moving Occupations
The most common Production, Transportation and Moving occupations in Dundalk are Material Moving (2,943 | 10.0%), Transportation (1,672 | 5.7%), and Production (1,659 | 5.6%).
Production, Transportation and Moving Occupations by Sex
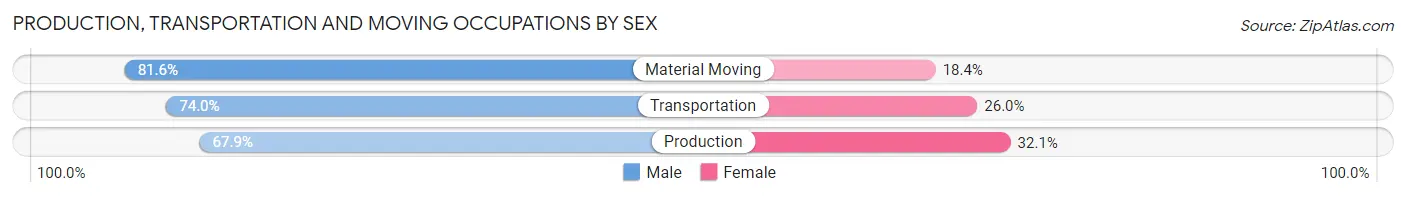
| Occupation | Male | Female |
| Production | 1,126 (67.9%) | 533 (32.1%) |
| Transportation | 1,237 (74.0%) | 435 (26.0%) |
| Material Moving | 2,402 (81.6%) | 541 (18.4%) |
| Total (Category) | 4,765 (75.9%) | 1,509 (24.0%) |
| Total (Overall) | 15,863 (53.8%) | 13,613 (46.2%) |
Employment Industries by Sex in Dundalk
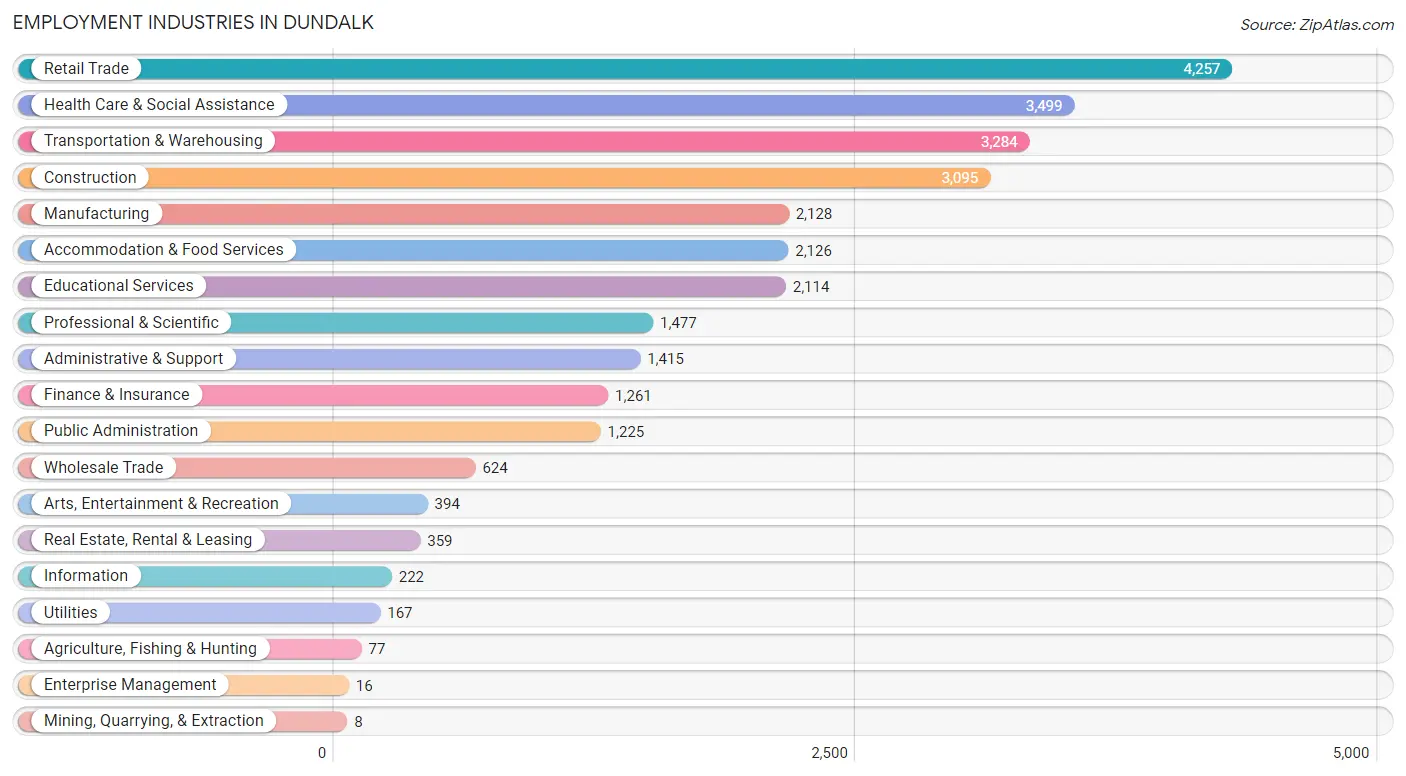
Employment Industries in Dundalk
The major employment industries in Dundalk include Retail Trade (4,257 | 14.4%), Health Care & Social Assistance (3,499 | 11.9%), Transportation & Warehousing (3,284 | 11.1%), Construction (3,095 | 10.5%), and Manufacturing (2,128 | 7.2%).
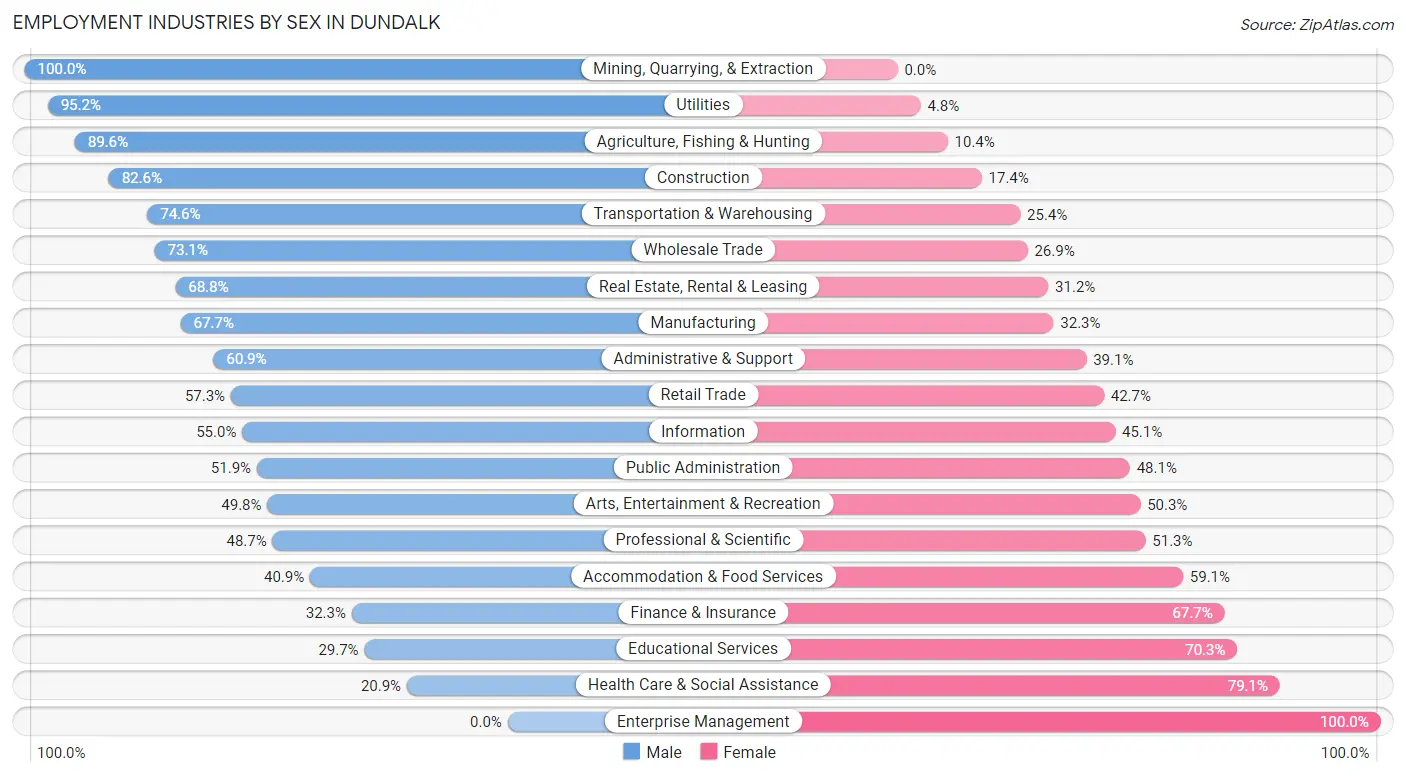
Employment Industries by Sex in Dundalk
The Dundalk industries that see more men than women are Mining, Quarrying, & Extraction (100.0%), Utilities (95.2%), and Agriculture, Fishing & Hunting (89.6%), whereas the industries that tend to have a higher number of women are Enterprise Management (100.0%), Health Care & Social Assistance (79.1%), and Educational Services (70.3%).
| Industry | Male | Female |
| Agriculture, Fishing & Hunting | 69 (89.6%) | 8 (10.4%) |
| Mining, Quarrying, & Extraction | 8 (100.0%) | 0 (0.0%) |
| Construction | 2,556 (82.6%) | 539 (17.4%) |
| Manufacturing | 1,441 (67.7%) | 687 (32.3%) |
| Wholesale Trade | 456 (73.1%) | 168 (26.9%) |
| Retail Trade | 2,439 (57.3%) | 1,818 (42.7%) |
| Transportation & Warehousing | 2,450 (74.6%) | 834 (25.4%) |
| Utilities | 159 (95.2%) | 8 (4.8%) |
| Information | 122 (54.9%) | 100 (45.1%) |
| Finance & Insurance | 407 (32.3%) | 854 (67.7%) |
| Real Estate, Rental & Leasing | 247 (68.8%) | 112 (31.2%) |
| Professional & Scientific | 719 (48.7%) | 758 (51.3%) |
| Enterprise Management | 0 (0.0%) | 16 (100.0%) |
| Administrative & Support | 862 (60.9%) | 553 (39.1%) |
| Educational Services | 627 (29.7%) | 1,487 (70.3%) |
| Health Care & Social Assistance | 730 (20.9%) | 2,769 (79.1%) |
| Arts, Entertainment & Recreation | 196 (49.7%) | 198 (50.2%) |
| Accommodation & Food Services | 870 (40.9%) | 1,256 (59.1%) |
| Public Administration | 636 (51.9%) | 589 (48.1%) |
| Total | 15,863 (53.8%) | 13,613 (46.2%) |
Education in Dundalk
School Enrollment in Dundalk
The most common levels of schooling among the 16,266 students in Dundalk are middle school (4,036 | 24.8%), elementary school (3,824 | 23.5%), and high school (3,693 | 22.7%).
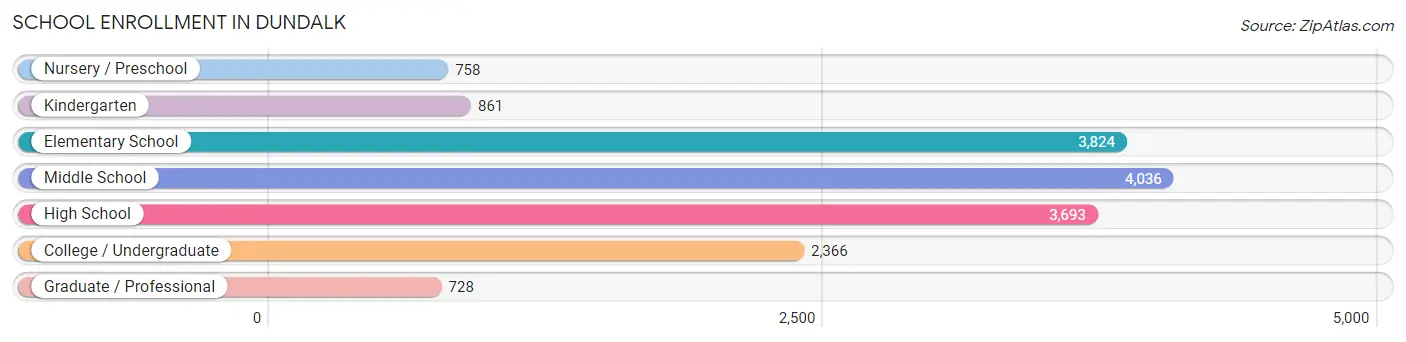
| School Level | # Students | % Students |
| Nursery / Preschool | 758 | 4.7% |
| Kindergarten | 861 | 5.3% |
| Elementary School | 3,824 | 23.5% |
| Middle School | 4,036 | 24.8% |
| High School | 3,693 | 22.7% |
| College / Undergraduate | 2,366 | 14.5% |
| Graduate / Professional | 728 | 4.5% |
| Total | 16,266 | 100.0% |
School Enrollment by Age by Funding Source in Dundalk
Out of a total of 16,266 students who are enrolled in schools in Dundalk, 1,708 (10.5%) attend a private institution, while the remaining 14,558 (89.5%) are enrolled in public schools. The age group of 25 to 34 year olds has the highest likelihood of being enrolled in private schools, with 336 (35.0% in the age bracket) enrolled. Conversely, the age group of 18 to 19 year olds has the lowest likelihood of being enrolled in a private school, with 948 (96.1% in the age bracket) attending a public institution.
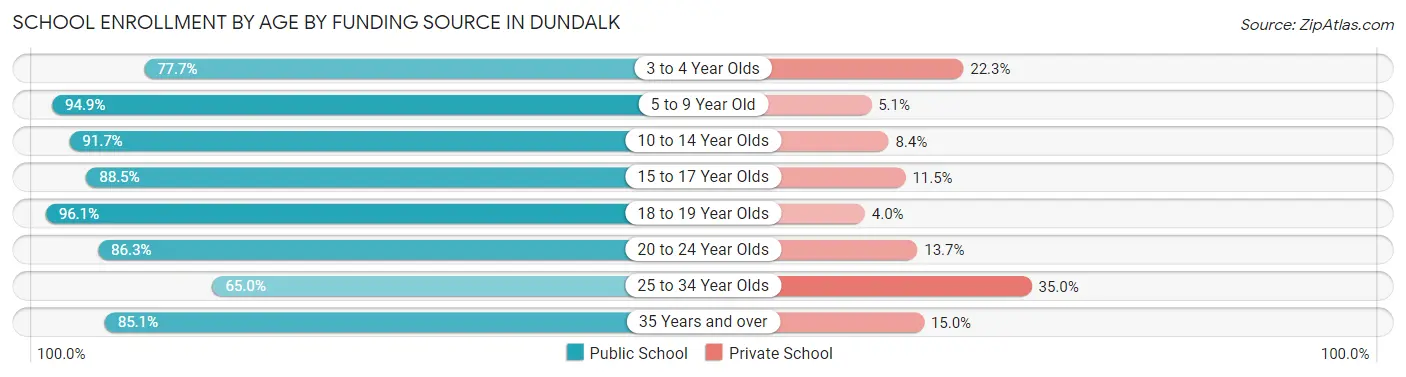
| Age Bracket | Public School | Private School |
| 3 to 4 Year Olds | 478 (77.7%) | 137 (22.3%) |
| 5 to 9 Year Old | 4,128 (94.9%) | 223 (5.1%) |
| 10 to 14 Year Olds | 4,566 (91.6%) | 416 (8.4%) |
| 15 to 17 Year Olds | 2,114 (88.5%) | 275 (11.5%) |
| 18 to 19 Year Olds | 948 (96.1%) | 39 (4.0%) |
| 20 to 24 Year Olds | 1,064 (86.3%) | 169 (13.7%) |
| 25 to 34 Year Olds | 624 (65.0%) | 336 (35.0%) |
| 35 Years and over | 637 (85.1%) | 112 (14.9%) |
| Total | 14,558 (89.5%) | 1,708 (10.5%) |
Educational Attainment by Field of Study in Dundalk
Business (1,750 | 25.8%), education (710 | 10.4%), science & technology (679 | 10.0%), arts & humanities (485 | 7.1%), and social sciences (456 | 6.7%) are the most common fields of study among 6,794 individuals in Dundalk who have obtained a bachelor's degree or higher.
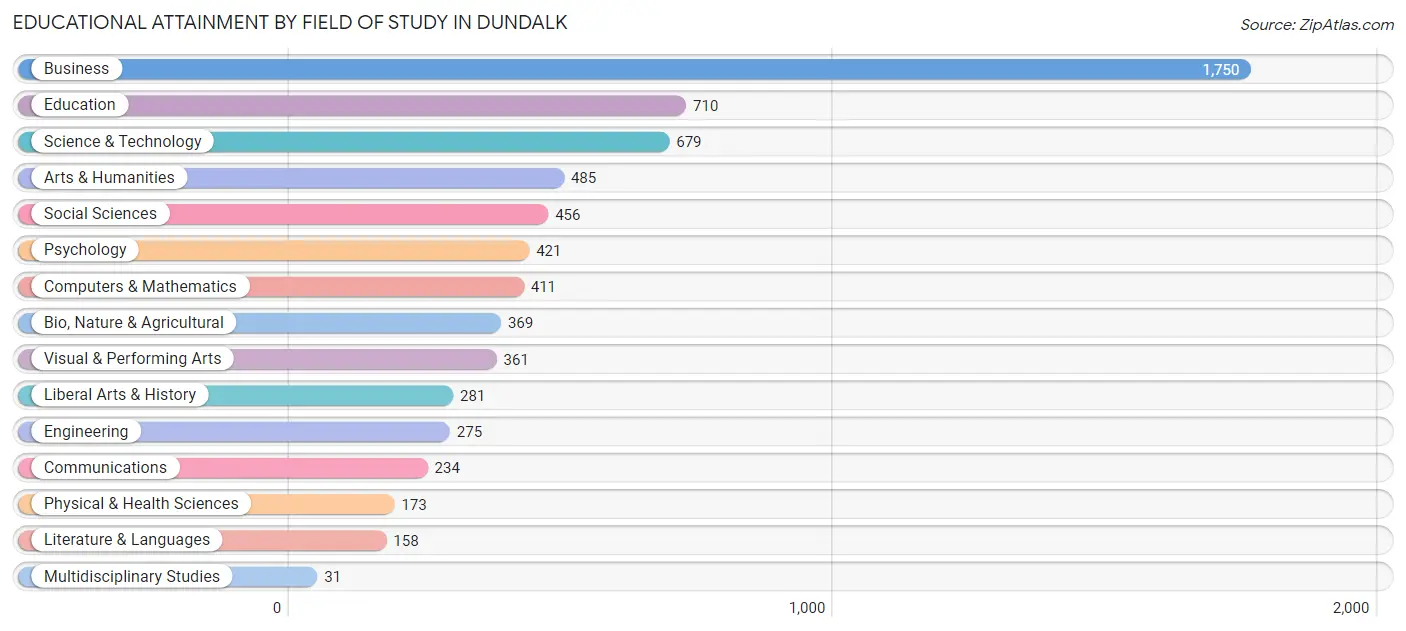
| Field of Study | # Graduates | % Graduates |
| Computers & Mathematics | 411 | 6.0% |
| Bio, Nature & Agricultural | 369 | 5.4% |
| Physical & Health Sciences | 173 | 2.5% |
| Psychology | 421 | 6.2% |
| Social Sciences | 456 | 6.7% |
| Engineering | 275 | 4.1% |
| Multidisciplinary Studies | 31 | 0.5% |
| Science & Technology | 679 | 10.0% |
| Business | 1,750 | 25.8% |
| Education | 710 | 10.4% |
| Literature & Languages | 158 | 2.3% |
| Liberal Arts & History | 281 | 4.1% |
| Visual & Performing Arts | 361 | 5.3% |
| Communications | 234 | 3.4% |
| Arts & Humanities | 485 | 7.1% |
| Total | 6,794 | 100.0% |
Transportation & Commute in Dundalk
Vehicle Availability by Sex in Dundalk
The most prevalent vehicle ownership categories in Dundalk are males with 2 vehicles (6,544, accounting for 41.9%) and females with 2 vehicles (5,535, making up 49.6%).
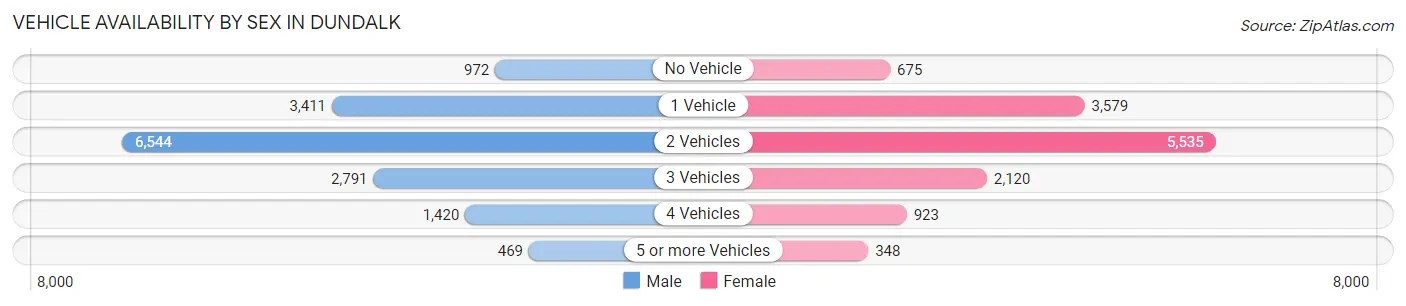
| Vehicles Available | Male | Female |
| No Vehicle | 972 (6.2%) | 675 (5.1%) |
| 1 Vehicle | 3,411 (21.9%) | 3,579 (27.2%) |
| 2 Vehicles | 6,544 (41.9%) | 5,535 (42.0%) |
| 3 Vehicles | 2,791 (17.9%) | 2,120 (16.1%) |
| 4 Vehicles | 1,420 (9.1%) | 923 (7.0%) |
| 5 or more Vehicles | 469 (3.0%) | 348 (2.6%) |
| Total | 15,607 (100.0%) | 13,180 (100.0%) |
Commute Time in Dundalk
The most frequently occuring commute durations in Dundalk are 30 to 34 minutes (5,366 commuters, 19.8%), 15 to 19 minutes (3,781 commuters, 13.9%), and 10 to 14 minutes (3,651 commuters, 13.5%).
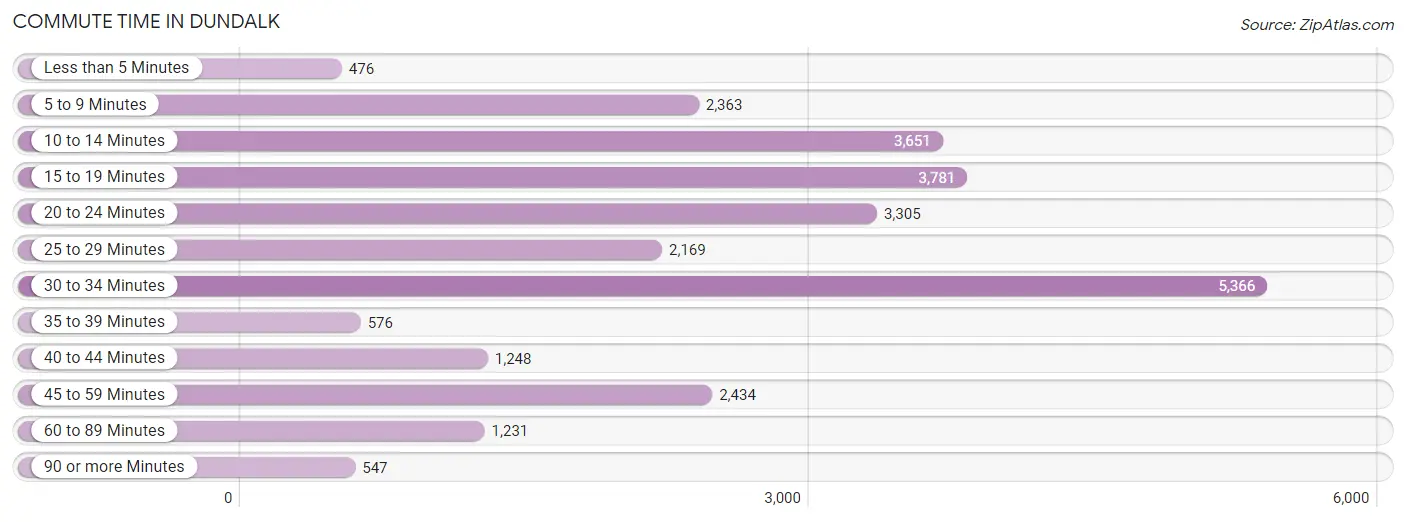
| Commute Time | # Commuters | % Commuters |
| Less than 5 Minutes | 476 | 1.8% |
| 5 to 9 Minutes | 2,363 | 8.7% |
| 10 to 14 Minutes | 3,651 | 13.5% |
| 15 to 19 Minutes | 3,781 | 13.9% |
| 20 to 24 Minutes | 3,305 | 12.2% |
| 25 to 29 Minutes | 2,169 | 8.0% |
| 30 to 34 Minutes | 5,366 | 19.8% |
| 35 to 39 Minutes | 576 | 2.1% |
| 40 to 44 Minutes | 1,248 | 4.6% |
| 45 to 59 Minutes | 2,434 | 9.0% |
| 60 to 89 Minutes | 1,231 | 4.5% |
| 90 or more Minutes | 547 | 2.0% |
Commute Time by Sex in Dundalk
The most common commute times in Dundalk are 30 to 34 minutes (2,894 commuters, 19.5%) for males and 30 to 34 minutes (2,472 commuters, 20.2%) for females.
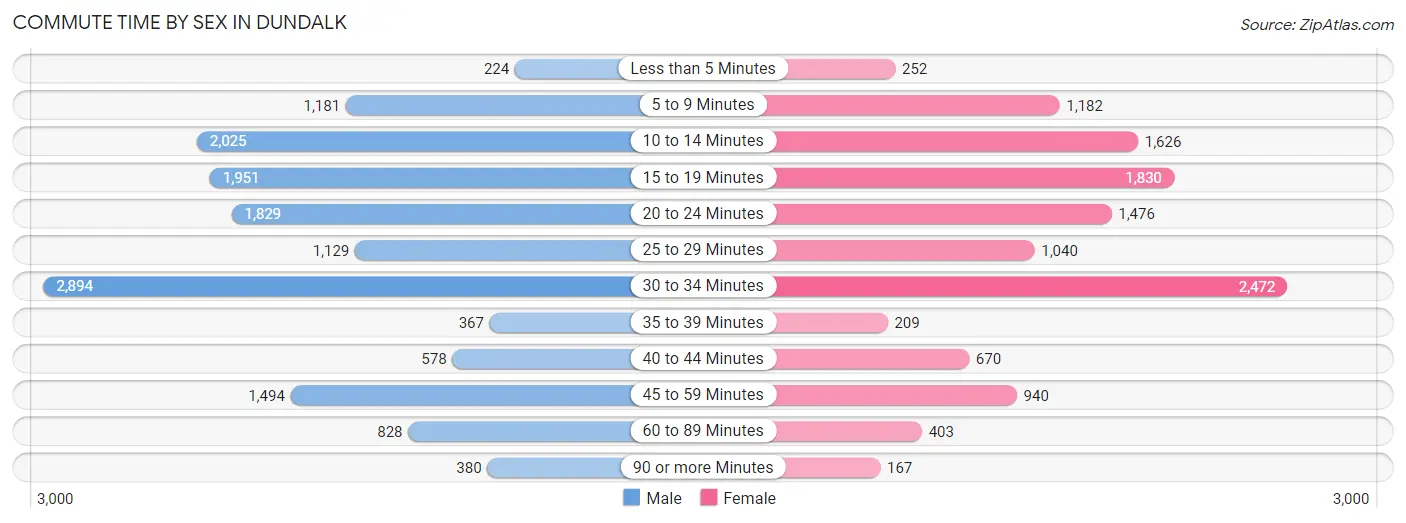
| Commute Time | Male | Female |
| Less than 5 Minutes | 224 (1.5%) | 252 (2.1%) |
| 5 to 9 Minutes | 1,181 (7.9%) | 1,182 (9.6%) |
| 10 to 14 Minutes | 2,025 (13.6%) | 1,626 (13.3%) |
| 15 to 19 Minutes | 1,951 (13.1%) | 1,830 (14.9%) |
| 20 to 24 Minutes | 1,829 (12.3%) | 1,476 (12.0%) |
| 25 to 29 Minutes | 1,129 (7.6%) | 1,040 (8.5%) |
| 30 to 34 Minutes | 2,894 (19.5%) | 2,472 (20.2%) |
| 35 to 39 Minutes | 367 (2.5%) | 209 (1.7%) |
| 40 to 44 Minutes | 578 (3.9%) | 670 (5.5%) |
| 45 to 59 Minutes | 1,494 (10.0%) | 940 (7.7%) |
| 60 to 89 Minutes | 828 (5.6%) | 403 (3.3%) |
| 90 or more Minutes | 380 (2.5%) | 167 (1.4%) |
Time of Departure to Work by Sex in Dundalk
The most frequent times of departure to work in Dundalk are 6:30 AM to 6:59 AM (1,838, 12.3%) for males and 7:30 AM to 7:59 AM (1,583, 12.9%) for females.
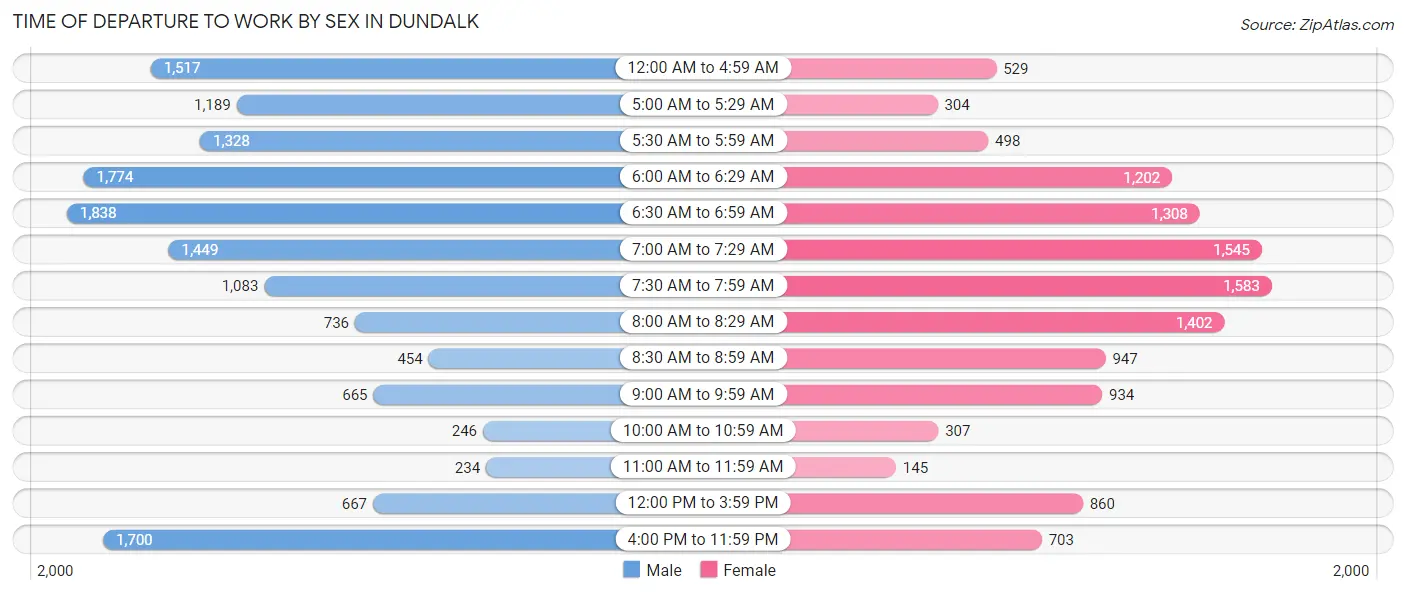
| Time of Departure | Male | Female |
| 12:00 AM to 4:59 AM | 1,517 (10.2%) | 529 (4.3%) |
| 5:00 AM to 5:29 AM | 1,189 (8.0%) | 304 (2.5%) |
| 5:30 AM to 5:59 AM | 1,328 (8.9%) | 498 (4.1%) |
| 6:00 AM to 6:29 AM | 1,774 (11.9%) | 1,202 (9.8%) |
| 6:30 AM to 6:59 AM | 1,838 (12.3%) | 1,308 (10.7%) |
| 7:00 AM to 7:29 AM | 1,449 (9.7%) | 1,545 (12.6%) |
| 7:30 AM to 7:59 AM | 1,083 (7.3%) | 1,583 (12.9%) |
| 8:00 AM to 8:29 AM | 736 (5.0%) | 1,402 (11.4%) |
| 8:30 AM to 8:59 AM | 454 (3.0%) | 947 (7.7%) |
| 9:00 AM to 9:59 AM | 665 (4.5%) | 934 (7.6%) |
| 10:00 AM to 10:59 AM | 246 (1.7%) | 307 (2.5%) |
| 11:00 AM to 11:59 AM | 234 (1.6%) | 145 (1.2%) |
| 12:00 PM to 3:59 PM | 667 (4.5%) | 860 (7.0%) |
| 4:00 PM to 11:59 PM | 1,700 (11.4%) | 703 (5.7%) |
| Total | 14,880 (100.0%) | 12,267 (100.0%) |
Housing Occupancy in Dundalk
Occupancy by Ownership in Dundalk
Of the total 24,805 dwellings in Dundalk, owner-occupied units account for 15,667 (63.2%), while renter-occupied units make up 9,138 (36.8%).
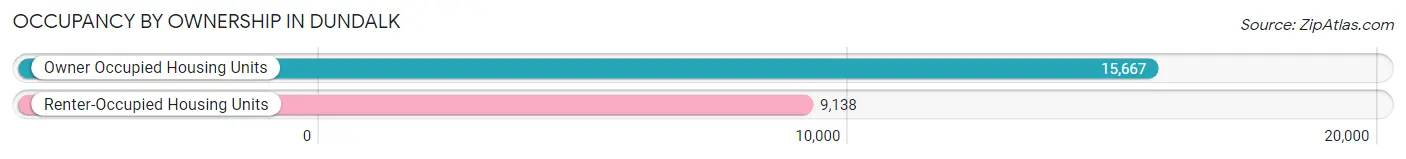
| Occupancy | # Housing Units | % Housing Units |
| Owner Occupied Housing Units | 15,667 | 63.2% |
| Renter-Occupied Housing Units | 9,138 | 36.8% |
| Total Occupied Housing Units | 24,805 | 100.0% |
Occupancy by Household Size in Dundalk
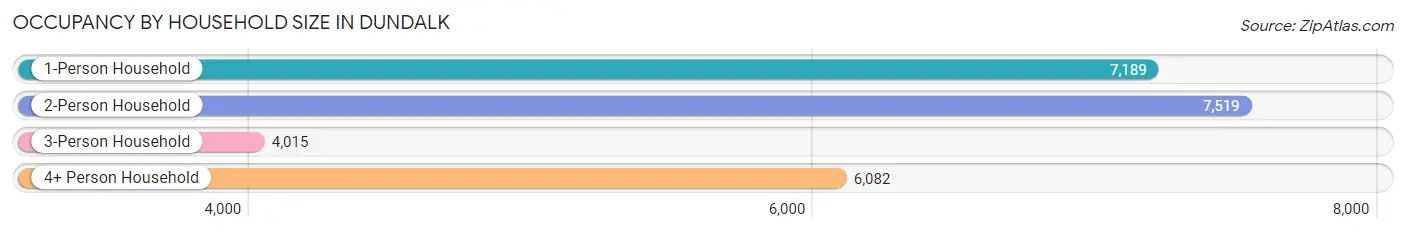
| Household Size | # Housing Units | % Housing Units |
| 1-Person Household | 7,189 | 29.0% |
| 2-Person Household | 7,519 | 30.3% |
| 3-Person Household | 4,015 | 16.2% |
| 4+ Person Household | 6,082 | 24.5% |
| Total Housing Units | 24,805 | 100.0% |
Occupancy by Ownership by Household Size in Dundalk
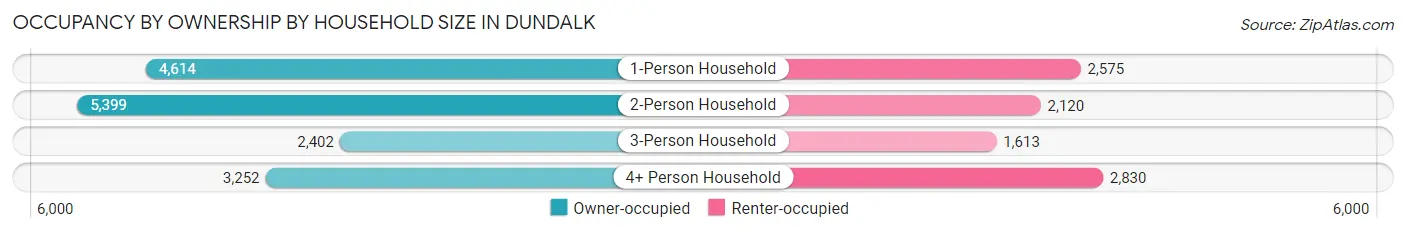
| Household Size | Owner-occupied | Renter-occupied |
| 1-Person Household | 4,614 (64.2%) | 2,575 (35.8%) |
| 2-Person Household | 5,399 (71.8%) | 2,120 (28.2%) |
| 3-Person Household | 2,402 (59.8%) | 1,613 (40.2%) |
| 4+ Person Household | 3,252 (53.5%) | 2,830 (46.5%) |
| Total Housing Units | 15,667 (63.2%) | 9,138 (36.8%) |
Occupancy by Educational Attainment in Dundalk
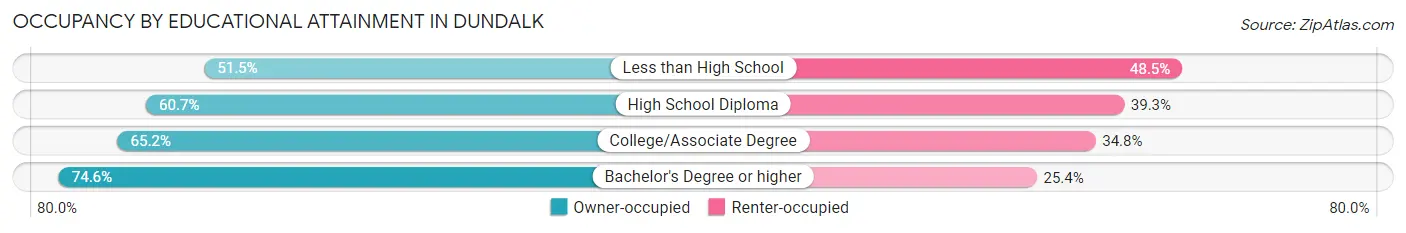
| Household Size | Owner-occupied | Renter-occupied |
| Less than High School | 1,755 (51.5%) | 1,654 (48.5%) |
| High School Diploma | 5,613 (60.7%) | 3,633 (39.3%) |
| College/Associate Degree | 5,321 (65.2%) | 2,835 (34.8%) |
| Bachelor's Degree or higher | 2,978 (74.6%) | 1,016 (25.4%) |
Occupancy by Age of Householder in Dundalk
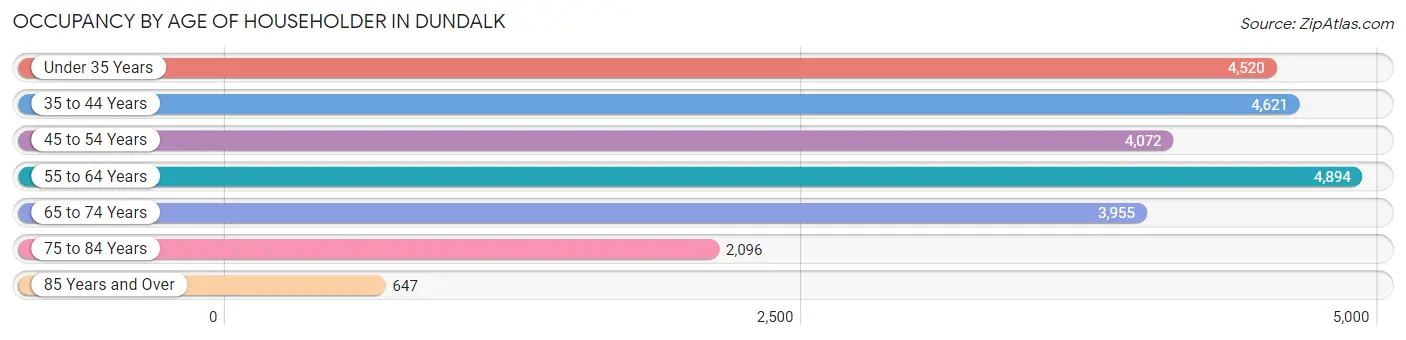
| Age Bracket | # Households | % Households |
| Under 35 Years | 4,520 | 18.2% |
| 35 to 44 Years | 4,621 | 18.6% |
| 45 to 54 Years | 4,072 | 16.4% |
| 55 to 64 Years | 4,894 | 19.7% |
| 65 to 74 Years | 3,955 | 15.9% |
| 75 to 84 Years | 2,096 | 8.5% |
| 85 Years and Over | 647 | 2.6% |
| Total | 24,805 | 100.0% |
Housing Finances in Dundalk
Median Income by Occupancy in Dundalk
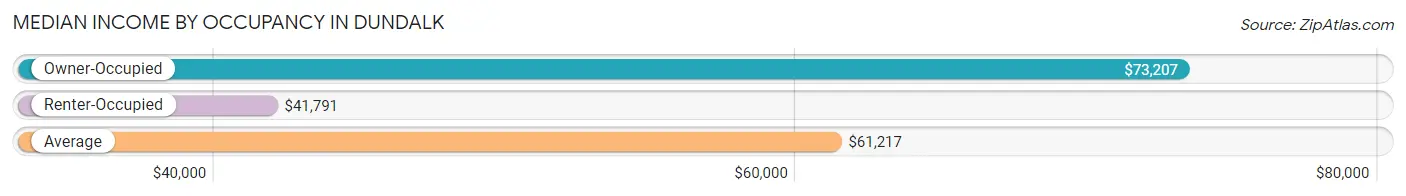
| Occupancy Type | # Households | Median Income |
| Owner-Occupied | 15,667 (63.2%) | $73,207 |
| Renter-Occupied | 9,138 (36.8%) | $41,791 |
| Average | 24,805 (100.0%) | $61,217 |
Occupancy by Householder Income Bracket in Dundalk
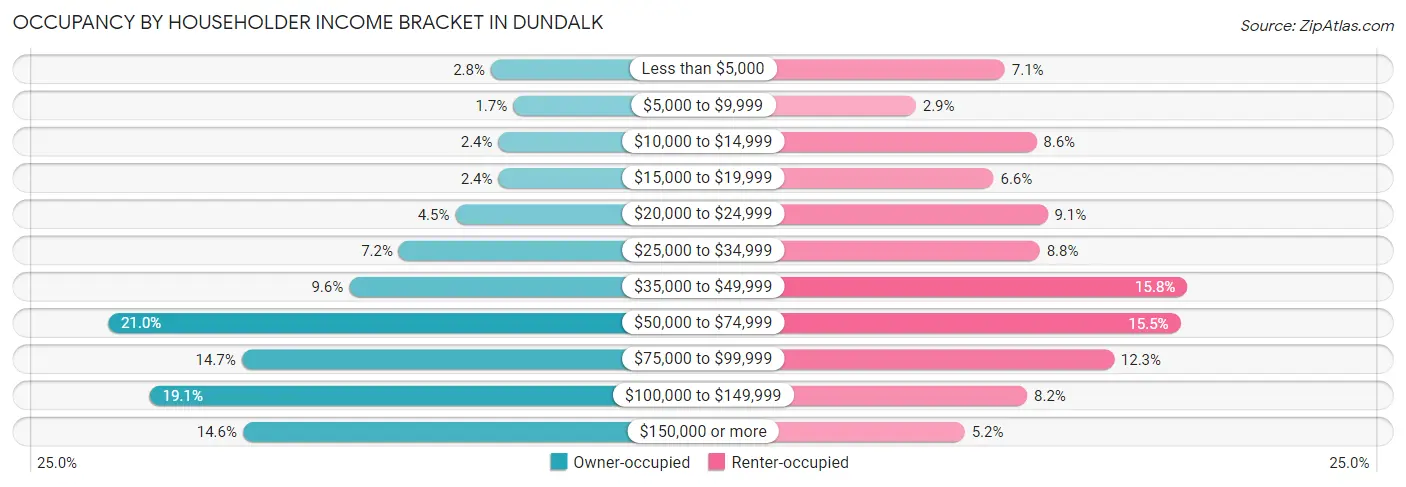
| Income Bracket | Owner-occupied | Renter-occupied |
| Less than $5,000 | 438 (2.8%) | 650 (7.1%) |
| $5,000 to $9,999 | 273 (1.7%) | 262 (2.9%) |
| $10,000 to $14,999 | 383 (2.4%) | 787 (8.6%) |
| $15,000 to $19,999 | 383 (2.4%) | 600 (6.6%) |
| $20,000 to $24,999 | 703 (4.5%) | 835 (9.1%) |
| $25,000 to $34,999 | 1,125 (7.2%) | 801 (8.8%) |
| $35,000 to $49,999 | 1,496 (9.6%) | 1,443 (15.8%) |
| $50,000 to $74,999 | 3,295 (21.0%) | 1,414 (15.5%) |
| $75,000 to $99,999 | 2,298 (14.7%) | 1,124 (12.3%) |
| $100,000 to $149,999 | 2,984 (19.1%) | 747 (8.2%) |
| $150,000 or more | 2,289 (14.6%) | 475 (5.2%) |
| Total | 15,667 (100.0%) | 9,138 (100.0%) |
Monthly Housing Cost Tiers in Dundalk
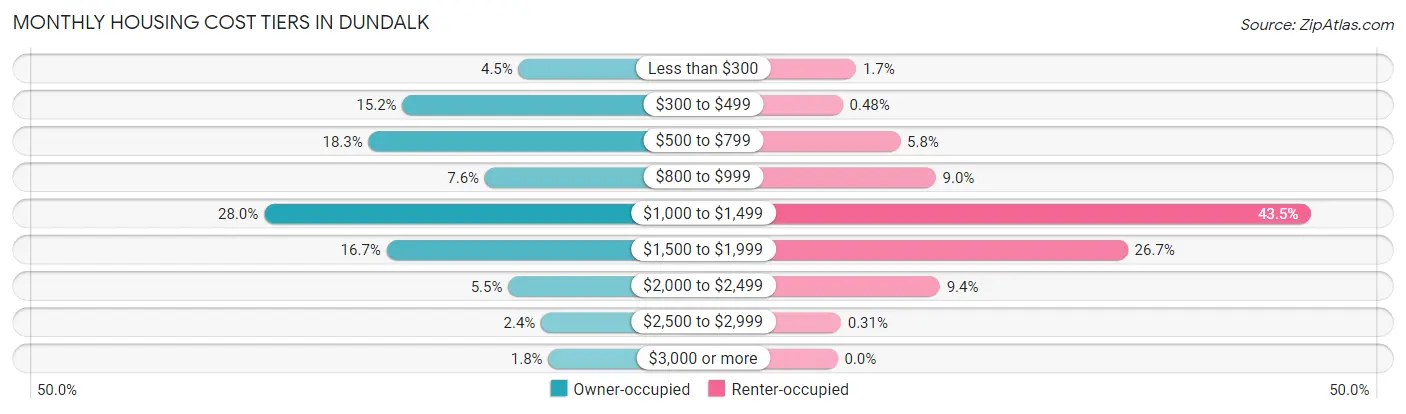
| Monthly Cost | Owner-occupied | Renter-occupied |
| Less than $300 | 708 (4.5%) | 156 (1.7%) |
| $300 to $499 | 2,384 (15.2%) | 44 (0.5%) |
| $500 to $799 | 2,873 (18.3%) | 527 (5.8%) |
| $800 to $999 | 1,194 (7.6%) | 826 (9.0%) |
| $1,000 to $1,499 | 4,379 (28.0%) | 3,977 (43.5%) |
| $1,500 to $1,999 | 2,611 (16.7%) | 2,442 (26.7%) |
| $2,000 to $2,499 | 857 (5.5%) | 861 (9.4%) |
| $2,500 to $2,999 | 382 (2.4%) | 28 (0.3%) |
| $3,000 or more | 279 (1.8%) | 0 (0.0%) |
| Total | 15,667 (100.0%) | 9,138 (100.0%) |
Physical Housing Characteristics in Dundalk
Housing Structures in Dundalk
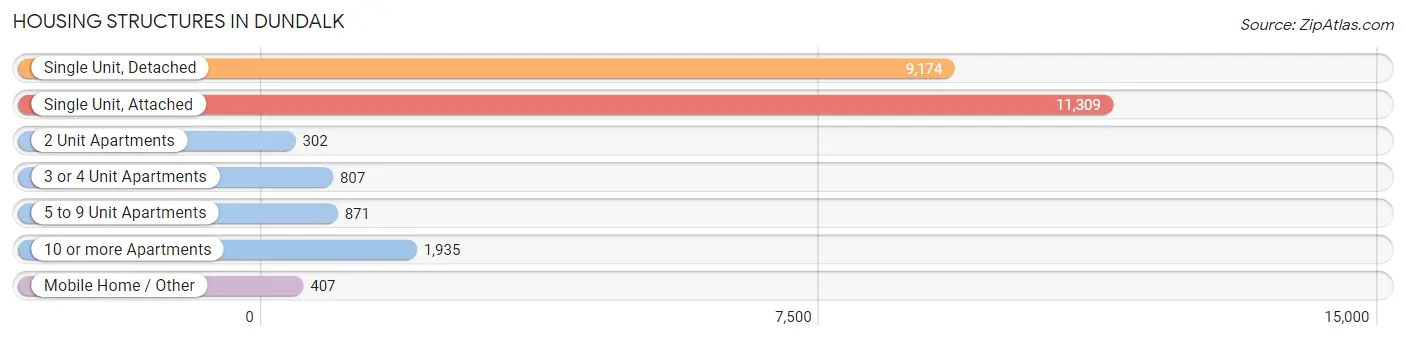
| Structure Type | # Housing Units | % Housing Units |
| Single Unit, Detached | 9,174 | 37.0% |
| Single Unit, Attached | 11,309 | 45.6% |
| 2 Unit Apartments | 302 | 1.2% |
| 3 or 4 Unit Apartments | 807 | 3.3% |
| 5 to 9 Unit Apartments | 871 | 3.5% |
| 10 or more Apartments | 1,935 | 7.8% |
| Mobile Home / Other | 407 | 1.6% |
| Total | 24,805 | 100.0% |
Housing Structures by Occupancy in Dundalk
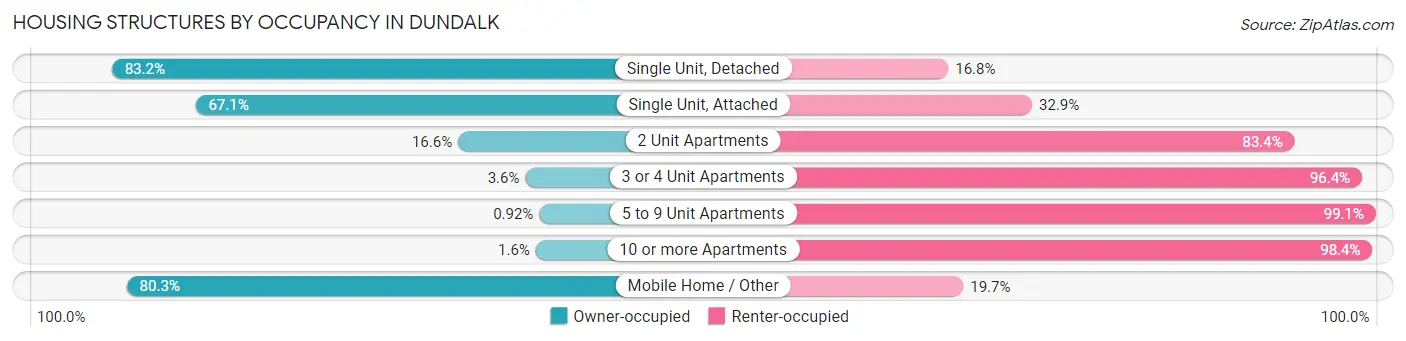
| Structure Type | Owner-occupied | Renter-occupied |
| Single Unit, Detached | 7,635 (83.2%) | 1,539 (16.8%) |
| Single Unit, Attached | 7,587 (67.1%) | 3,722 (32.9%) |
| 2 Unit Apartments | 50 (16.6%) | 252 (83.4%) |
| 3 or 4 Unit Apartments | 29 (3.6%) | 778 (96.4%) |
| 5 to 9 Unit Apartments | 8 (0.9%) | 863 (99.1%) |
| 10 or more Apartments | 31 (1.6%) | 1,904 (98.4%) |
| Mobile Home / Other | 327 (80.3%) | 80 (19.7%) |
| Total | 15,667 (63.2%) | 9,138 (36.8%) |
Housing Structures by Number of Rooms in Dundalk
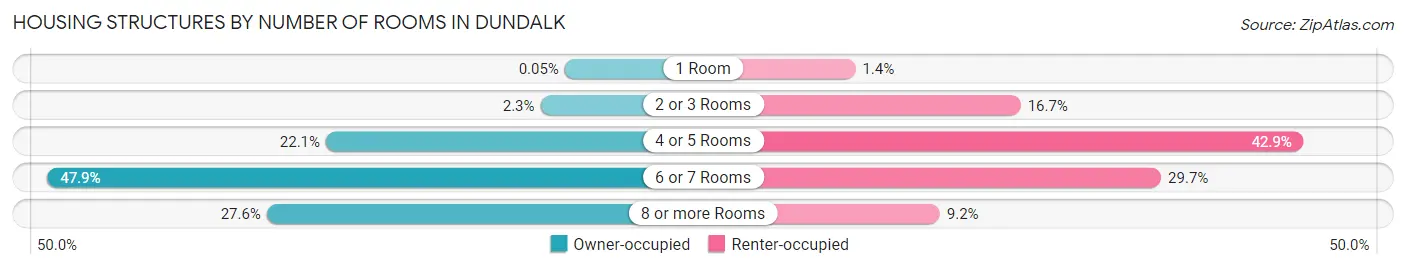
| Number of Rooms | Owner-occupied | Renter-occupied |
| 1 Room | 8 (0.1%) | 132 (1.4%) |
| 2 or 3 Rooms | 361 (2.3%) | 1,528 (16.7%) |
| 4 or 5 Rooms | 3,468 (22.1%) | 3,919 (42.9%) |
| 6 or 7 Rooms | 7,504 (47.9%) | 2,715 (29.7%) |
| 8 or more Rooms | 4,326 (27.6%) | 844 (9.2%) |
| Total | 15,667 (100.0%) | 9,138 (100.0%) |
Housing Structure by Heating Type in Dundalk
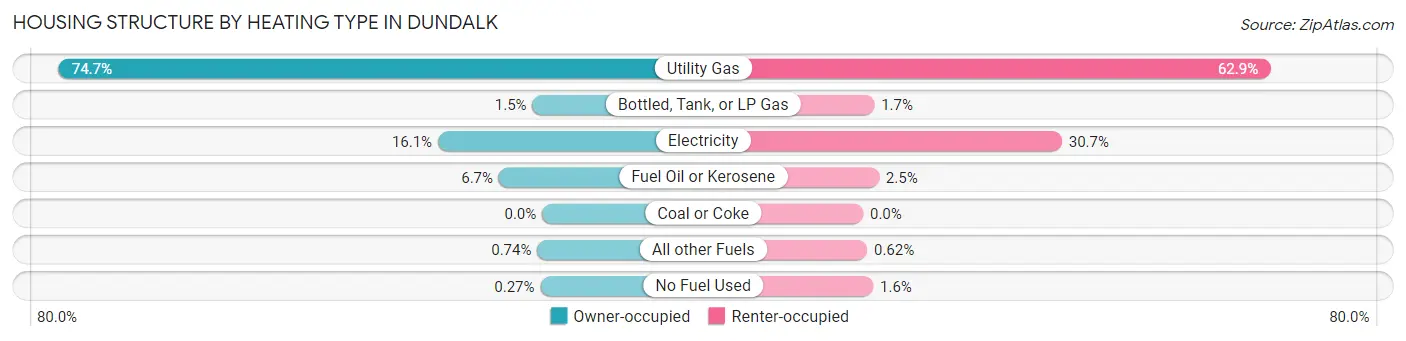
| Heating Type | Owner-occupied | Renter-occupied |
| Utility Gas | 11,705 (74.7%) | 5,748 (62.9%) |
| Bottled, Tank, or LP Gas | 234 (1.5%) | 158 (1.7%) |
| Electricity | 2,523 (16.1%) | 2,808 (30.7%) |
| Fuel Oil or Kerosene | 1,047 (6.7%) | 224 (2.5%) |
| Coal or Coke | 0 (0.0%) | 0 (0.0%) |
| All other Fuels | 116 (0.7%) | 57 (0.6%) |
| No Fuel Used | 42 (0.3%) | 143 (1.6%) |
| Total | 15,667 (100.0%) | 9,138 (100.0%) |
Household Vehicle Usage in Dundalk
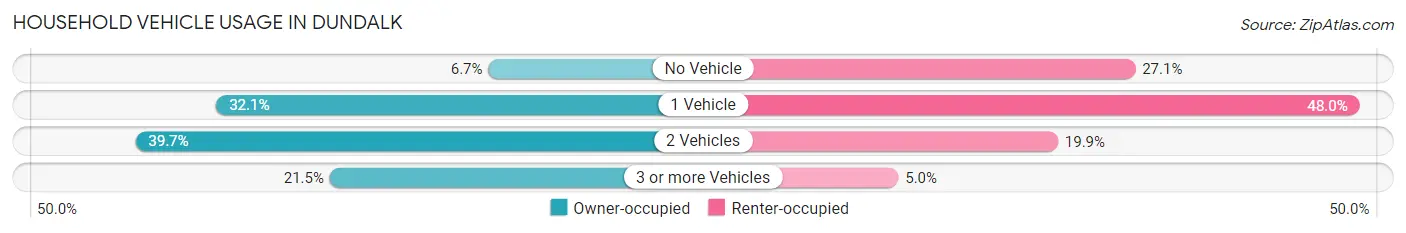
| Vehicles per Household | Owner-occupied | Renter-occupied |
| No Vehicle | 1,052 (6.7%) | 2,476 (27.1%) |
| 1 Vehicle | 5,031 (32.1%) | 4,390 (48.0%) |
| 2 Vehicles | 6,214 (39.7%) | 1,817 (19.9%) |
| 3 or more Vehicles | 3,370 (21.5%) | 455 (5.0%) |
| Total | 15,667 (100.0%) | 9,138 (100.0%) |
Real Estate & Mortgages in Dundalk
Real Estate and Mortgage Overview in Dundalk
| Characteristic | Without Mortgage | With Mortgage |
| Housing Units | 5,798 | 9,869 |
| Median Property Value | $174,700 | $188,800 |
| Median Household Income | $55,654 | $1,778 |
| Monthly Housing Costs | $494 | $279 |
| Real Estate Taxes | $2,399 | $327 |
Property Value by Mortgage Status in Dundalk
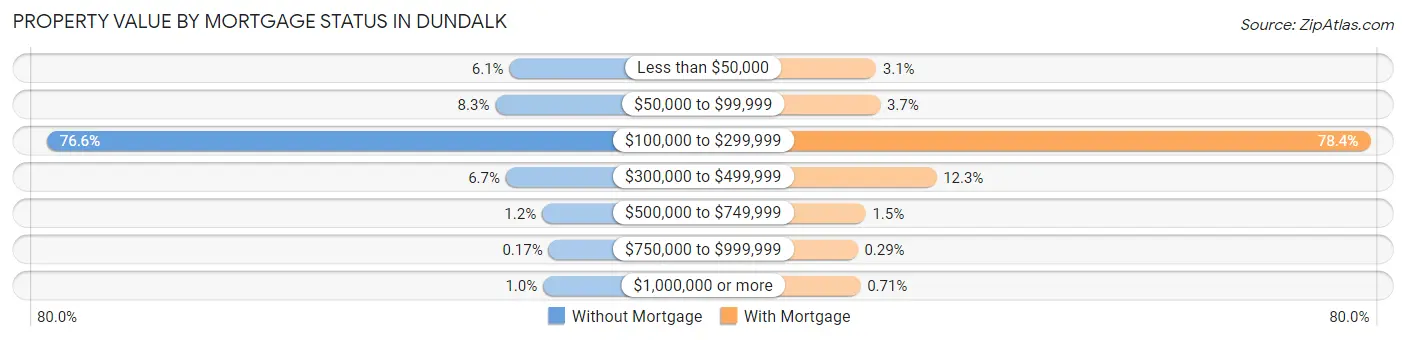
| Property Value | Without Mortgage | With Mortgage |
| Less than $50,000 | 355 (6.1%) | 305 (3.1%) |
| $50,000 to $99,999 | 480 (8.3%) | 367 (3.7%) |
| $100,000 to $299,999 | 4,441 (76.6%) | 7,736 (78.4%) |
| $300,000 to $499,999 | 387 (6.7%) | 1,213 (12.3%) |
| $500,000 to $749,999 | 67 (1.2%) | 149 (1.5%) |
| $750,000 to $999,999 | 10 (0.2%) | 29 (0.3%) |
| $1,000,000 or more | 58 (1.0%) | 70 (0.7%) |
| Total | 5,798 (100.0%) | 9,869 (100.0%) |
Household Income by Mortgage Status in Dundalk
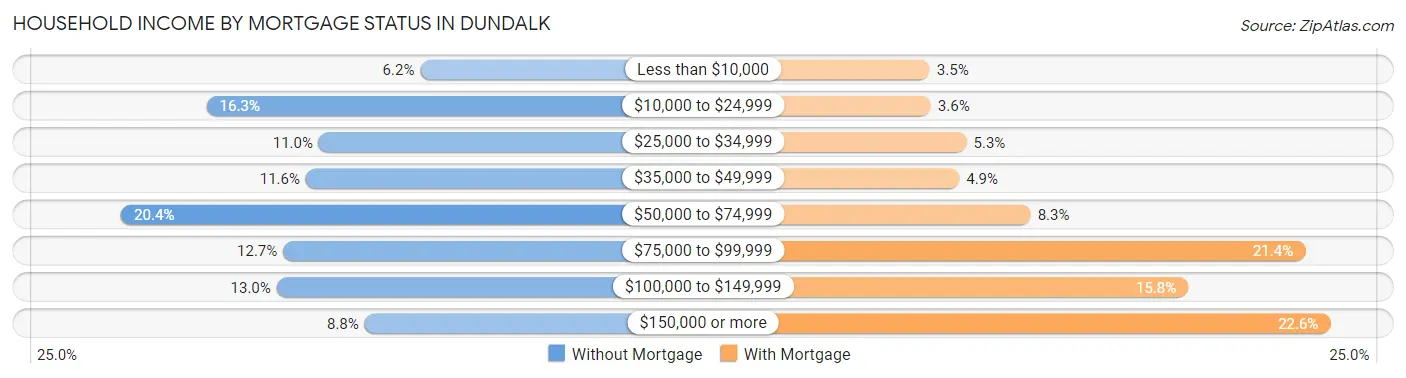
| Household Income | Without Mortgage | With Mortgage |
| Less than $10,000 | 357 (6.2%) | 349 (3.5%) |
| $10,000 to $24,999 | 947 (16.3%) | 354 (3.6%) |
| $25,000 to $34,999 | 637 (11.0%) | 522 (5.3%) |
| $35,000 to $49,999 | 673 (11.6%) | 488 (4.9%) |
| $50,000 to $74,999 | 1,183 (20.4%) | 823 (8.3%) |
| $75,000 to $99,999 | 736 (12.7%) | 2,112 (21.4%) |
| $100,000 to $149,999 | 754 (13.0%) | 1,562 (15.8%) |
| $150,000 or more | 511 (8.8%) | 2,230 (22.6%) |
| Total | 5,798 (100.0%) | 9,869 (100.0%) |
Property Value to Household Income Ratio in Dundalk
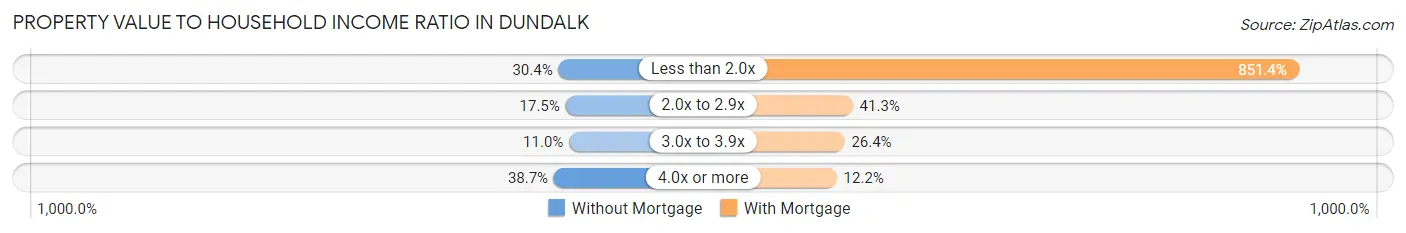
| Value-to-Income Ratio | Without Mortgage | With Mortgage |
| Less than 2.0x | 1,761 (30.4%) | 84,026 (851.4%) |
| 2.0x to 2.9x | 1,015 (17.5%) | 4,076 (41.3%) |
| 3.0x to 3.9x | 639 (11.0%) | 2,601 (26.4%) |
| 4.0x or more | 2,241 (38.7%) | 1,206 (12.2%) |
| Total | 5,798 (100.0%) | 9,869 (100.0%) |
Real Estate Taxes by Mortgage Status in Dundalk
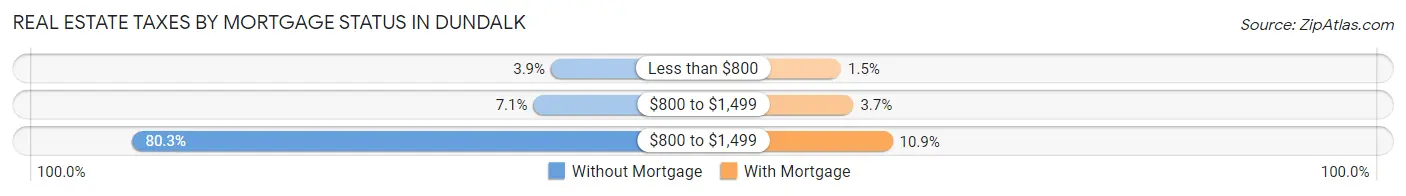
| Property Taxes | Without Mortgage | With Mortgage |
| Less than $800 | 225 (3.9%) | 145 (1.5%) |
| $800 to $1,499 | 411 (7.1%) | 368 (3.7%) |
| $800 to $1,499 | 4,654 (80.3%) | 1,072 (10.9%) |
| Total | 5,798 (100.0%) | 9,869 (100.0%) |
Health & Disability in Dundalk
Health Insurance Coverage by Age in Dundalk
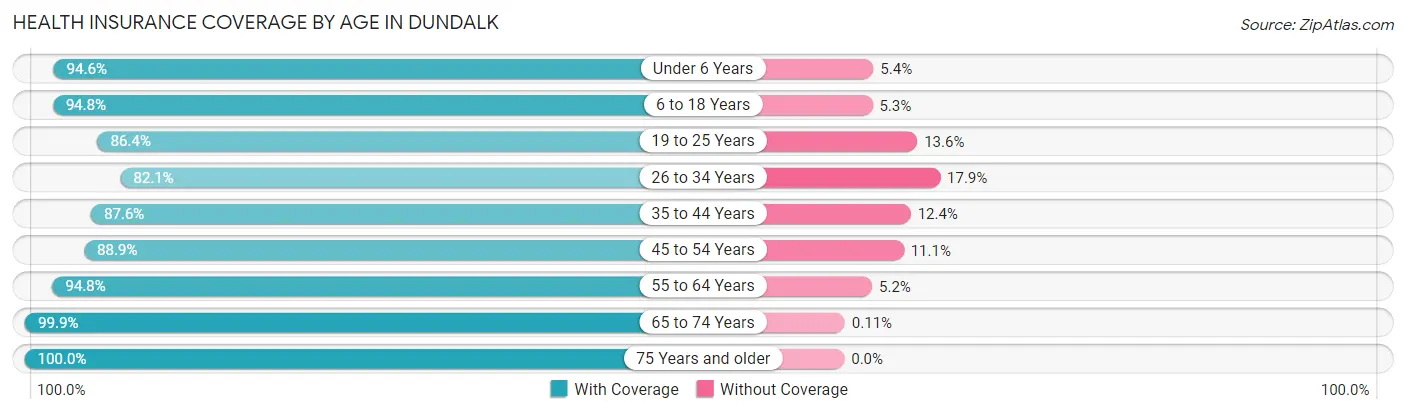
| Age Bracket | With Coverage | Without Coverage |
| Under 6 Years | 4,752 (94.6%) | 273 (5.4%) |
| 6 to 18 Years | 11,632 (94.8%) | 645 (5.2%) |
| 19 to 25 Years | 4,477 (86.4%) | 705 (13.6%) |
| 26 to 34 Years | 7,287 (82.1%) | 1,585 (17.9%) |
| 35 to 44 Years | 8,055 (87.6%) | 1,138 (12.4%) |
| 45 to 54 Years | 6,371 (88.9%) | 794 (11.1%) |
| 55 to 64 Years | 7,764 (94.8%) | 424 (5.2%) |
| 65 to 74 Years | 6,199 (99.9%) | 7 (0.1%) |
| 75 Years and older | 3,904 (100.0%) | 0 (0.0%) |
| Total | 60,441 (91.6%) | 5,571 (8.4%) |
Health Insurance Coverage by Citizenship Status in Dundalk
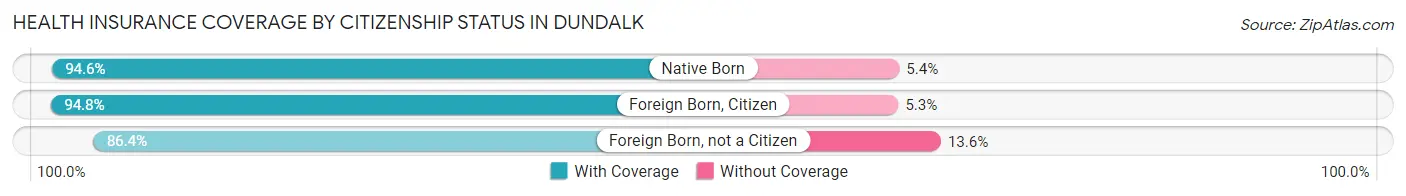
| Citizenship Status | With Coverage | Without Coverage |
| Native Born | 4,752 (94.6%) | 273 (5.4%) |
| Foreign Born, Citizen | 11,632 (94.8%) | 645 (5.2%) |
| Foreign Born, not a Citizen | 4,477 (86.4%) | 705 (13.6%) |
Health Insurance Coverage by Household Income in Dundalk
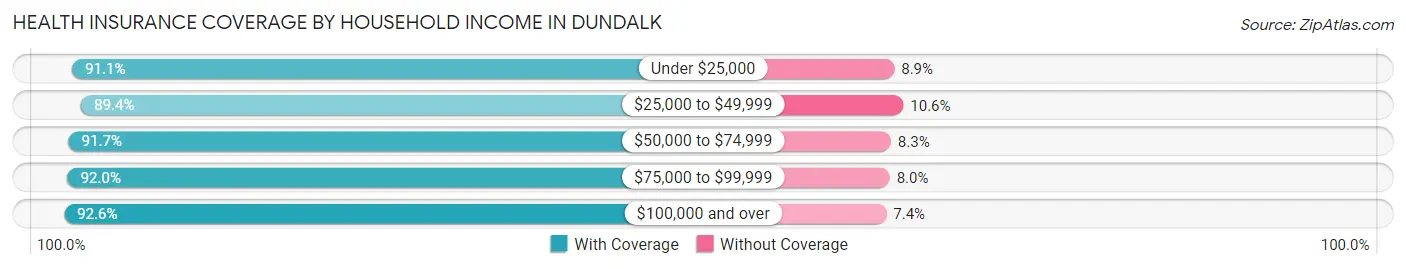
| Household Income | With Coverage | Without Coverage |
| Under $25,000 | 9,259 (91.1%) | 905 (8.9%) |
| $25,000 to $49,999 | 10,441 (89.4%) | 1,238 (10.6%) |
| $50,000 to $74,999 | 10,236 (91.7%) | 922 (8.3%) |
| $75,000 to $99,999 | 9,125 (92.0%) | 798 (8.0%) |
| $100,000 and over | 21,343 (92.6%) | 1,707 (7.4%) |
Public vs Private Health Insurance Coverage by Age in Dundalk
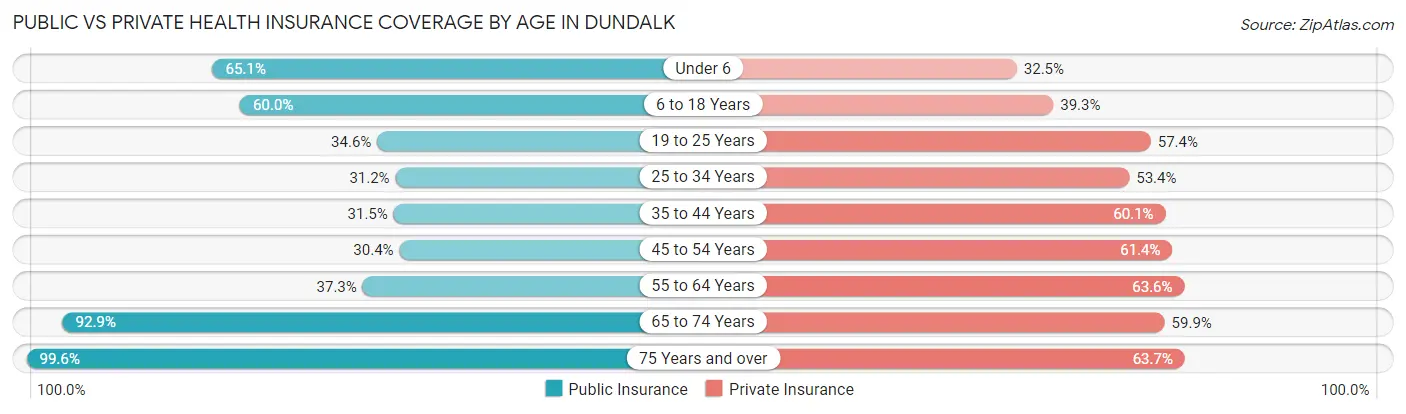
| Age Bracket | Public Insurance | Private Insurance |
| Under 6 | 3,272 (65.1%) | 1,633 (32.5%) |
| 6 to 18 Years | 7,369 (60.0%) | 4,820 (39.3%) |
| 19 to 25 Years | 1,791 (34.6%) | 2,972 (57.4%) |
| 25 to 34 Years | 2,765 (31.2%) | 4,735 (53.4%) |
| 35 to 44 Years | 2,897 (31.5%) | 5,522 (60.1%) |
| 45 to 54 Years | 2,180 (30.4%) | 4,396 (61.4%) |
| 55 to 64 Years | 3,051 (37.3%) | 5,206 (63.6%) |
| 65 to 74 Years | 5,768 (92.9%) | 3,719 (59.9%) |
| 75 Years and over | 3,890 (99.6%) | 2,485 (63.6%) |
| Total | 32,983 (50.0%) | 35,488 (53.8%) |
Disability Status by Sex by Age in Dundalk
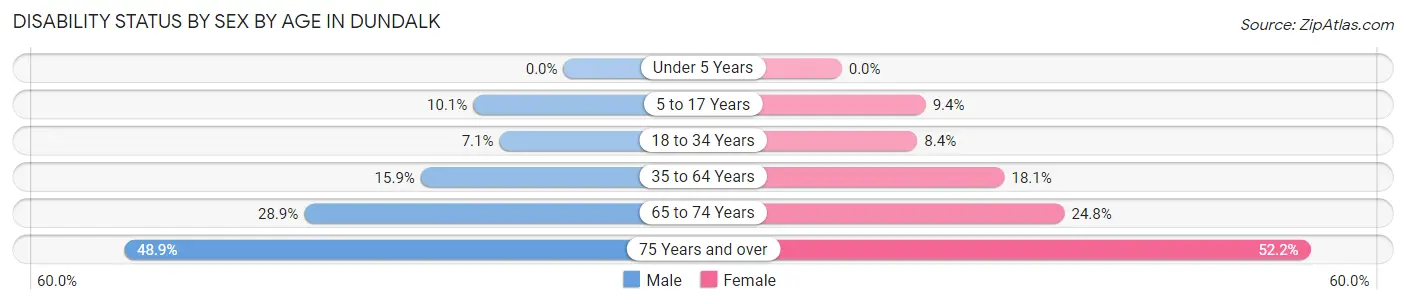
| Age Bracket | Male | Female |
| Under 5 Years | 0 (0.0%) | 0 (0.0%) |
| 5 to 17 Years | 625 (10.1%) | 568 (9.3%) |
| 18 to 34 Years | 563 (7.1%) | 600 (8.4%) |
| 35 to 64 Years | 1,851 (15.9%) | 2,338 (18.1%) |
| 65 to 74 Years | 811 (28.9%) | 843 (24.8%) |
| 75 Years and over | 725 (48.9%) | 1,264 (52.2%) |
Disability Class by Sex by Age in Dundalk
Disability Class: Hearing Difficulty
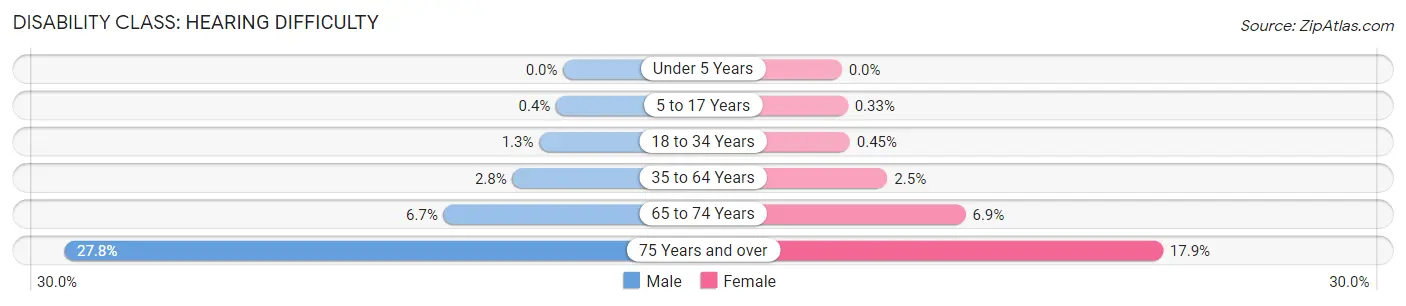
| Age Bracket | Male | Female |
| Under 5 Years | 0 (0.0%) | 0 (0.0%) |
| 5 to 17 Years | 25 (0.4%) | 20 (0.3%) |
| 18 to 34 Years | 106 (1.3%) | 32 (0.4%) |
| 35 to 64 Years | 330 (2.8%) | 327 (2.5%) |
| 65 to 74 Years | 187 (6.7%) | 234 (6.9%) |
| 75 Years and over | 412 (27.8%) | 433 (17.9%) |
Disability Class: Vision Difficulty
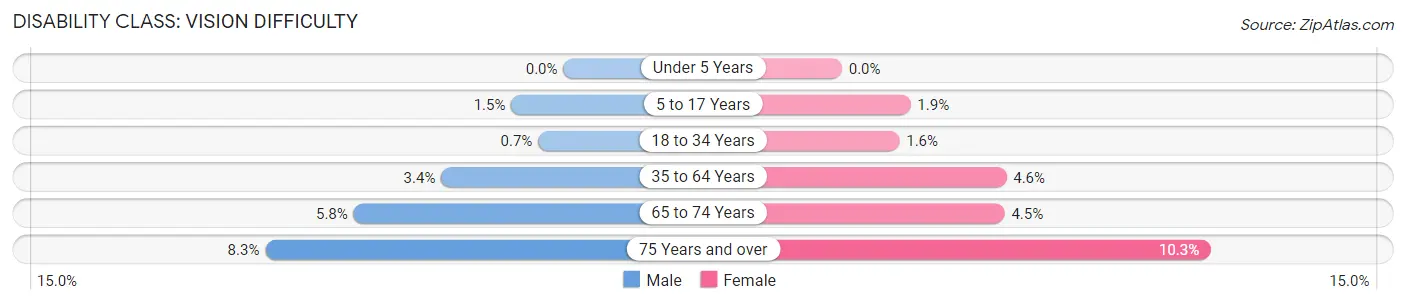
| Age Bracket | Male | Female |
| Under 5 Years | 0 (0.0%) | 0 (0.0%) |
| 5 to 17 Years | 90 (1.5%) | 116 (1.9%) |
| 18 to 34 Years | 55 (0.7%) | 114 (1.6%) |
| 35 to 64 Years | 396 (3.4%) | 590 (4.6%) |
| 65 to 74 Years | 164 (5.8%) | 154 (4.5%) |
| 75 Years and over | 123 (8.3%) | 249 (10.3%) |
Disability Class: Cognitive Difficulty
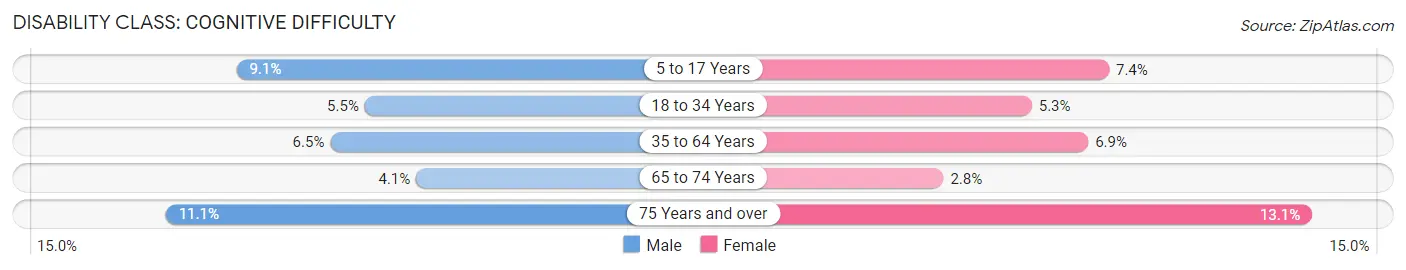
| Age Bracket | Male | Female |
| 5 to 17 Years | 566 (9.1%) | 452 (7.4%) |
| 18 to 34 Years | 437 (5.5%) | 377 (5.3%) |
| 35 to 64 Years | 756 (6.5%) | 884 (6.9%) |
| 65 to 74 Years | 115 (4.1%) | 96 (2.8%) |
| 75 Years and over | 164 (11.1%) | 317 (13.1%) |
Disability Class: Ambulatory Difficulty
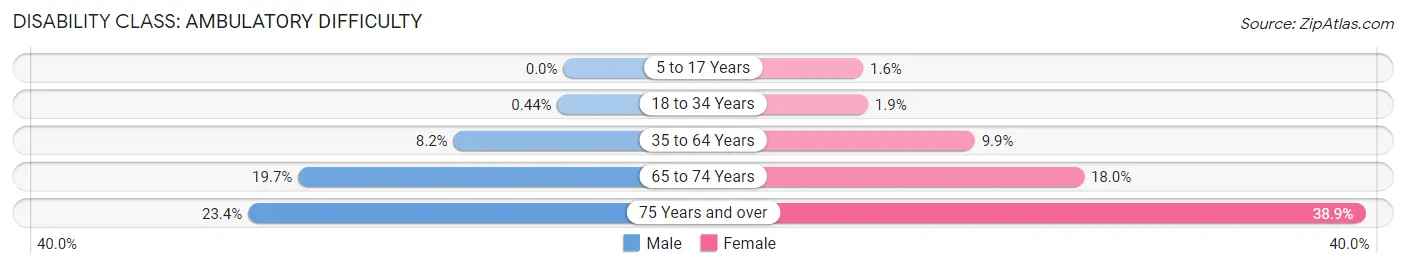
| Age Bracket | Male | Female |
| 5 to 17 Years | 0 (0.0%) | 96 (1.6%) |
| 18 to 34 Years | 35 (0.4%) | 138 (1.9%) |
| 35 to 64 Years | 951 (8.2%) | 1,273 (9.9%) |
| 65 to 74 Years | 553 (19.7%) | 611 (18.0%) |
| 75 Years and over | 347 (23.4%) | 941 (38.9%) |
Disability Class: Self-Care Difficulty
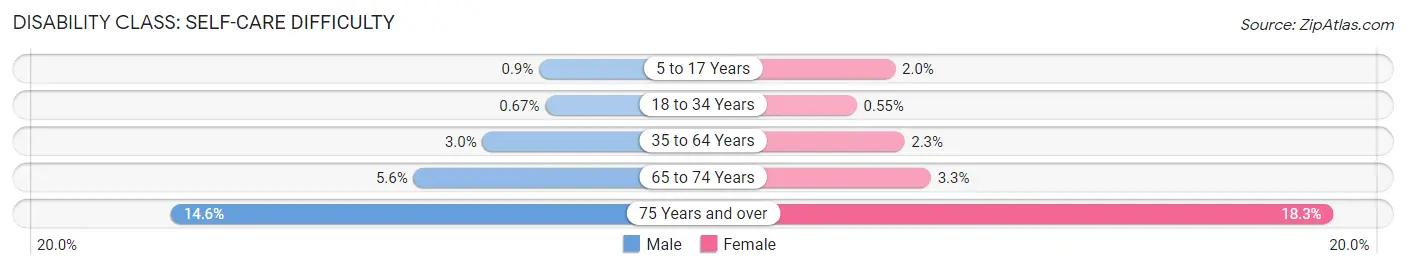
| Age Bracket | Male | Female |
| 5 to 17 Years | 56 (0.9%) | 120 (2.0%) |
| 18 to 34 Years | 53 (0.7%) | 39 (0.5%) |
| 35 to 64 Years | 350 (3.0%) | 299 (2.3%) |
| 65 to 74 Years | 156 (5.6%) | 112 (3.3%) |
| 75 Years and over | 216 (14.6%) | 442 (18.2%) |
Technology Access in Dundalk
Computing Device Access in Dundalk
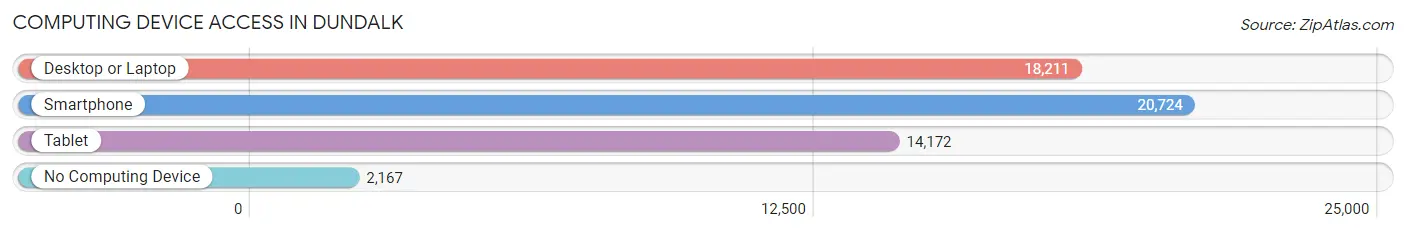
| Device Type | # Households | % Households |
| Desktop or Laptop | 18,211 | 73.4% |
| Smartphone | 20,724 | 83.6% |
| Tablet | 14,172 | 57.1% |
| No Computing Device | 2,167 | 8.7% |
| Total | 24,805 | 100.0% |
Internet Access in Dundalk
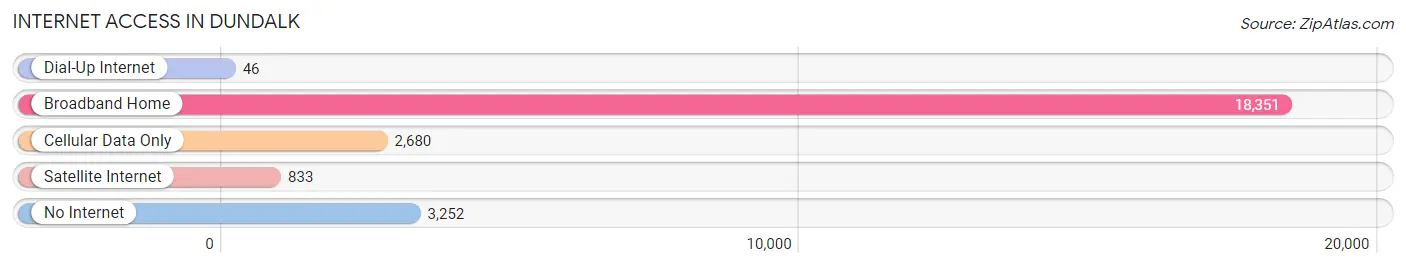
| Internet Type | # Households | % Households |
| Dial-Up Internet | 46 | 0.2% |
| Broadband Home | 18,351 | 74.0% |
| Cellular Data Only | 2,680 | 10.8% |
| Satellite Internet | 833 | 3.4% |
| No Internet | 3,252 | 13.1% |
| Total | 24,805 | 100.0% |
Dundalk Summary
Dundalk is a census-designated place (CDP) located in Baltimore County, Maryland, United States. It is located just east of the city of Baltimore and is part of the Baltimore metropolitan area. The population of Dundalk was 63,597 at the 2010 census.
History
Dundalk was first settled in the early 18th century by Scots-Irish immigrants. The area was originally known as "Erin's Hope" and was later renamed "Dundalk" after the town of Dundalk, Ireland. The town was officially incorporated in 1854.
Dundalk was an important industrial center during the early 20th century. The Bethlehem Steel Corporation operated a large steel mill in the area, which employed thousands of workers. The mill closed in the 1980s, but the area remains an important industrial center.
Geography
Dundalk is located at 39°17'N 76°30'W (39.28, -76.50). According to the United States Census Bureau, the CDP has a total area of 11.2 square miles (29.0 km2), of which 11.1 square miles (28.7 km2) is land and 0.1 square miles (0.3 km2) (0.45%) is water.
Economy
Dundalk is an important industrial center in the Baltimore metropolitan area. The area is home to several large industrial parks, including the Dundalk Marine Terminal, which is the largest port in Maryland. The area is also home to several large employers, including the Amazon fulfillment center, which employs over 1,000 people.
Demographics
As of the 2010 census, there were 63,597 people, 25,919 households, and 16,945 families residing in the CDP. The population density was 5,717.3 people per square mile (2,210.2/km2). There were 27,919 housing units at an average density of 2,521.3 per square mile (972.2/km2). The racial makeup of the CDP was 79.2% White, 11.7% African American, 0.3% Native American, 3.2% Asian, 0.1% Pacific Islander, 3.2% from other races, and 2.4% from two or more races. Hispanic or Latino of any race were 6.7% of the population.
There were 25,919 households, out of which 28.3% had children under the age of 18 living with them, 41.2% were married couples living together, 15.7% had a female householder with no husband present, and 37.2% were non-families. 30.2% of all households were made up of individuals, and 11.7% had someone living alone who was 65 years of age or older. The average household size was 2.44 and the average family size was 3.05.
In the CDP, the population was spread out, with 23.2% under the age of 18, 8.2% from 18 to 24, 30.2% from 25 to 44, 22.7% from 45 to 64, and 15.7% who were 65 years of age or older. The median age was 37 years. For every 100 females, there were 92.2 males. For every 100 females age 18 and over, there were 88.2 males.
The median income for a household in the CDP was $41,945, and the median income for a family was $50,945. Males had a median income of $37,813 versus $30,845 for females. The per capita income for the CDP was $20,945. About 8.2% of families and 10.2% of the population were below the poverty line, including 14.2% of those under age 18 and 8.2% of those age 65 or over.
Common Questions
What is Per Capita Income in Dundalk?
Per Capita income in Dundalk is $30,768.
What is the Median Family Income in Dundalk?
Median Family Income in Dundalk is $69,535.
What is the Median Household income in Dundalk?
Median Household Income in Dundalk is $61,217.
What is Income or Wage Gap in Dundalk?
Income or Wage Gap in Dundalk is 18.0%.
Women in Dundalk earn 82.0 cents for every dollar earned by a man.
What is Family Income Deficit in Dundalk?
Family Income Deficit in Dundalk is $11,168.
Families that are below poverty line in Dundalk earn $11,168 less on average than the poverty threshold level.
What is Inequality or Gini Index in Dundalk?
Inequality or Gini Index in Dundalk is 0.45.
What is the Total Population of Dundalk?
Total Population of Dundalk is 66,321.
What is the Total Male Population of Dundalk?
Total Male Population of Dundalk is 31,883.
What is the Total Female Population of Dundalk?
Total Female Population of Dundalk is 34,438.
What is the Ratio of Males per 100 Females in Dundalk?
There are 92.58 Males per 100 Females in Dundalk.
What is the Ratio of Females per 100 Males in Dundalk?
There are 108.01 Females per 100 Males in Dundalk.
What is the Median Population Age in Dundalk?
Median Population Age in Dundalk is 37.3 Years.
What is the Average Family Size in Dundalk
Average Family Size in Dundalk is 3.3 People.
What is the Average Household Size in Dundalk
Average Household Size in Dundalk is 2.7 People.
How Large is the Labor Force in Dundalk?
There are 31,689 People in the Labor Forcein in Dundalk.
What is the Percentage of People in the Labor Force in Dundalk?
61.4% of People are in the Labor Force in Dundalk.
What is the Unemployment Rate in Dundalk?
Unemployment Rate in Dundalk is 6.9%.