Chestertown, MD Map & Demographics
Chestertown Map
Chestertown Overview
$30,459
PER CAPITA INCOME
$75,976
AVG FAMILY INCOME
$43,980
AVG HOUSEHOLD INCOME
57.9%
WAGE / INCOME GAP [ % ]
42.1¢/ $1
WAGE / INCOME GAP [ $ ]
0.46
INEQUALITY / GINI INDEX
5,522
TOTAL POPULATION
2,425
MALE POPULATION
3,097
FEMALE POPULATION
78.30
MALES / 100 FEMALES
127.71
FEMALES / 100 MALES
32.9
MEDIAN AGE
2.4
AVG FAMILY SIZE
1.8
AVG HOUSEHOLD SIZE
2,369
LABOR FORCE [ PEOPLE ]
48.3%
PERCENT IN LABOR FORCE
3.9%
UNEMPLOYMENT RATE
Chestertown Zip Codes
Income in Chestertown
Income Overview in Chestertown
Per Capita Income in Chestertown is $30,459, while median incomes of families and households are $75,976 and $43,980 respectively.
| Characteristic | Number | Measure |
| Per Capita Income | 5,522 | $30,459 |
| Median Family Income | 1,100 | $75,976 |
| Mean Family Income | 1,100 | $95,239 |
| Median Household Income | 2,306 | $43,980 |
| Mean Household Income | 2,306 | $69,770 |
| Income Deficit | 1,100 | $0 |
| Wage / Income Gap (%) | 5,522 | 57.87% |
| Wage / Income Gap ($) | 5,522 | 42.13¢ per $1 |
| Gini / Inequality Index | 5,522 | 0.46 |
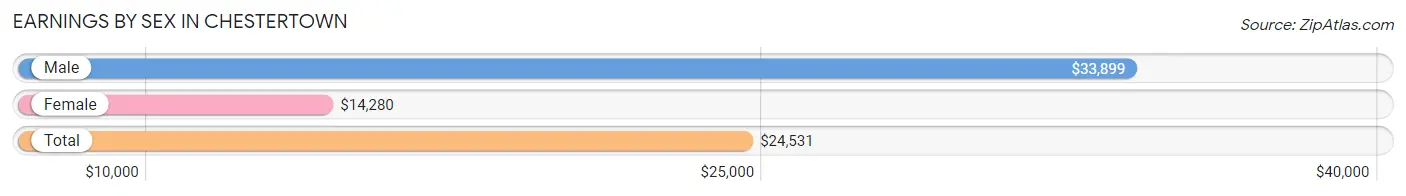
Earnings by Sex in Chestertown
Average Earnings in Chestertown are $24,531, $33,899 for men and $14,280 for women, a difference of 57.9%.
| Sex | Number | Average Earnings |
| Male | 1,057 (38.9%) | $33,899 |
| Female | 1,659 (61.1%) | $14,280 |
| Total | 2,716 (100.0%) | $24,531 |
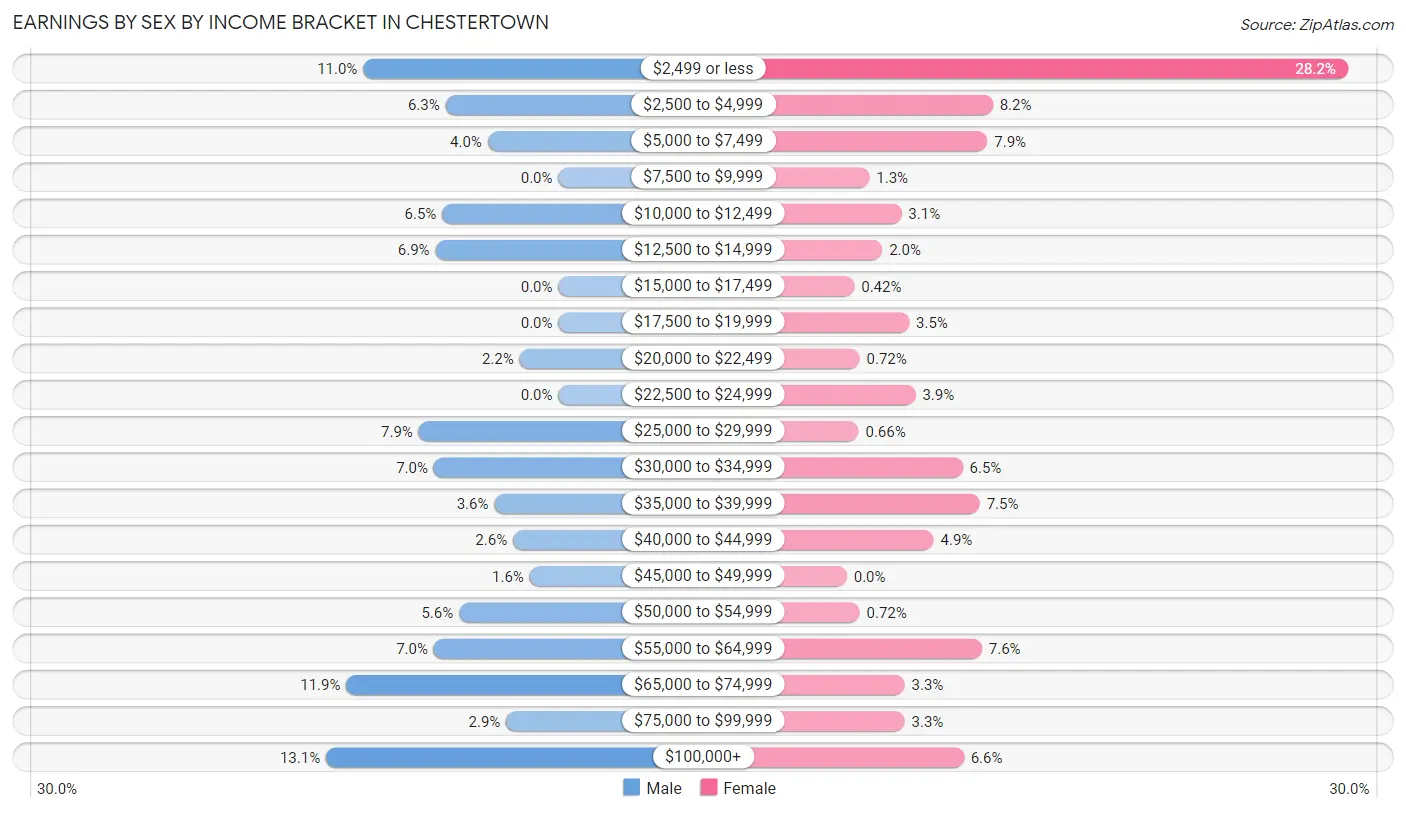
Earnings by Sex by Income Bracket in Chestertown
The most common earnings brackets in Chestertown are $100,000+ for men (138 | 13.1%) and $2,499 or less for women (467 | 28.1%).
| Income | Male | Female |
| $2,499 or less | 116 (11.0%) | 467 (28.1%) |
| $2,500 to $4,999 | 67 (6.3%) | 136 (8.2%) |
| $5,000 to $7,499 | 42 (4.0%) | 131 (7.9%) |
| $7,500 to $9,999 | 0 (0.0%) | 21 (1.3%) |
| $10,000 to $12,499 | 69 (6.5%) | 51 (3.1%) |
| $12,500 to $14,999 | 73 (6.9%) | 33 (2.0%) |
| $15,000 to $17,499 | 0 (0.0%) | 7 (0.4%) |
| $17,500 to $19,999 | 0 (0.0%) | 58 (3.5%) |
| $20,000 to $22,499 | 23 (2.2%) | 12 (0.7%) |
| $22,500 to $24,999 | 0 (0.0%) | 64 (3.9%) |
| $25,000 to $29,999 | 83 (7.9%) | 11 (0.7%) |
| $30,000 to $34,999 | 74 (7.0%) | 108 (6.5%) |
| $35,000 to $39,999 | 38 (3.6%) | 124 (7.5%) |
| $40,000 to $44,999 | 27 (2.5%) | 81 (4.9%) |
| $45,000 to $49,999 | 17 (1.6%) | 0 (0.0%) |
| $50,000 to $54,999 | 59 (5.6%) | 12 (0.7%) |
| $55,000 to $64,999 | 74 (7.0%) | 126 (7.6%) |
| $65,000 to $74,999 | 126 (11.9%) | 54 (3.3%) |
| $75,000 to $99,999 | 31 (2.9%) | 54 (3.3%) |
| $100,000+ | 138 (13.1%) | 109 (6.6%) |
| Total | 1,057 (100.0%) | 1,659 (100.0%) |
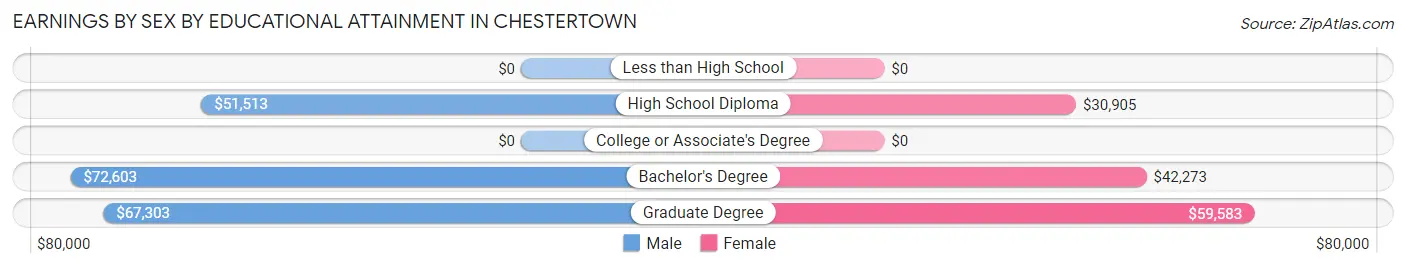
Earnings by Sex by Educational Attainment in Chestertown
Average earnings in Chestertown are $54,464 for men and $37,580 for women, a difference of 31.0%. Men with an educational attainment of bachelor's degree enjoy the highest average annual earnings of $72,603, while those with high school diploma education earn the least with $51,513. Women with an educational attainment of graduate degree earn the most with the average annual earnings of $59,583, while those with high school diploma education have the smallest earnings of $30,905.
| Educational Attainment | Male Income | Female Income |
| Less than High School | - | - |
| High School Diploma | $51,513 | $30,905 |
| College or Associate's Degree | - | - |
| Bachelor's Degree | $72,603 | $42,273 |
| Graduate Degree | $67,303 | $59,583 |
| Total | $54,464 | $37,580 |
Family Income in Chestertown
Family Income Brackets in Chestertown
According to the Chestertown family income data, there are 220 families falling into the $100,000 to $149,999 income range, which is the most common income bracket and makes up 20.0% of all families.
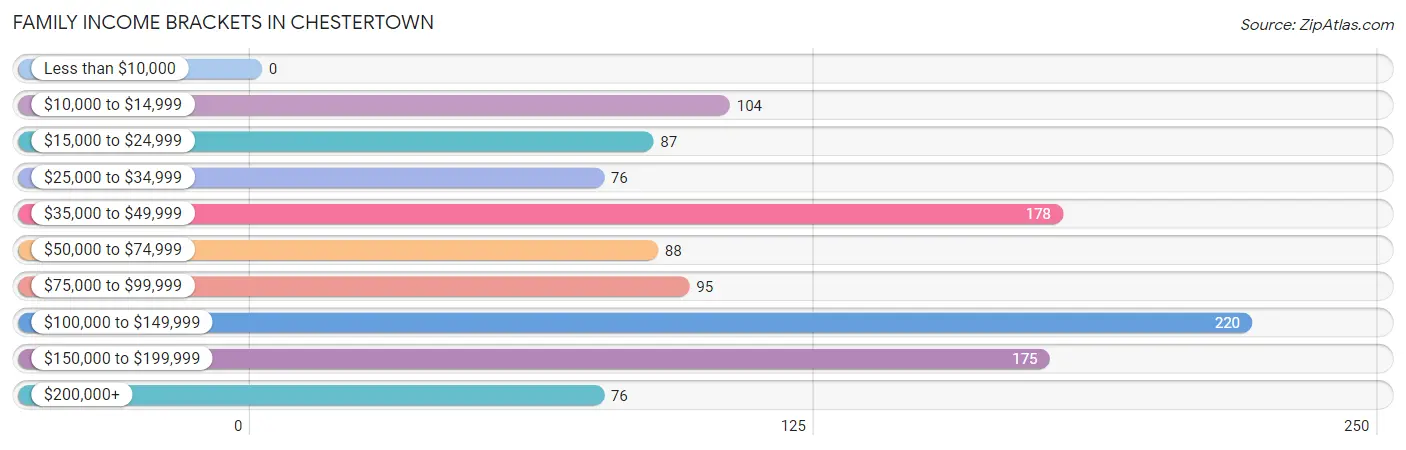
| Income Bracket | # Families | % Families |
| Less than $10,000 | 0 | 0.0% |
| $10,000 to $14,999 | 104 | 9.5% |
| $15,000 to $24,999 | 87 | 7.9% |
| $25,000 to $34,999 | 76 | 6.9% |
| $35,000 to $49,999 | 178 | 16.2% |
| $50,000 to $74,999 | 88 | 8.0% |
| $75,000 to $99,999 | 95 | 8.6% |
| $100,000 to $149,999 | 220 | 20.0% |
| $150,000 to $199,999 | 175 | 15.9% |
| $200,000+ | 76 | 6.9% |
Family Income by Famaliy Size in Chestertown
5-person families (84 | 7.6%) account for the highest median family income in Chestertown with $183,250 per family, while 2-person families (677 | 61.6%) have the highest median income of $51,416 per family member.
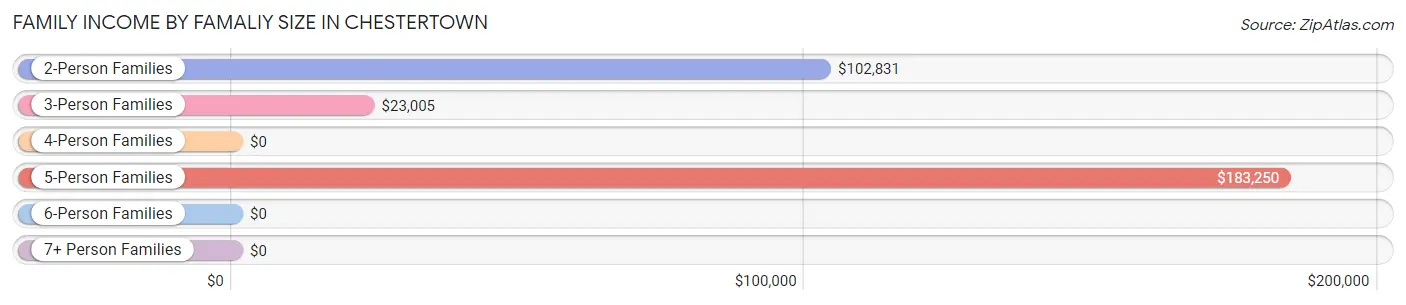
| Income Bracket | # Families | Median Income |
| 2-Person Families | 677 (61.6%) | $102,831 |
| 3-Person Families | 271 (24.6%) | $23,005 |
| 4-Person Families | 68 (6.2%) | $0 |
| 5-Person Families | 84 (7.6%) | $183,250 |
| 6-Person Families | 0 (0.0%) | $0 |
| 7+ Person Families | 0 (0.0%) | $0 |
| Total | 1,100 (100.0%) | $75,976 |
Family Income by Number of Earners in Chestertown
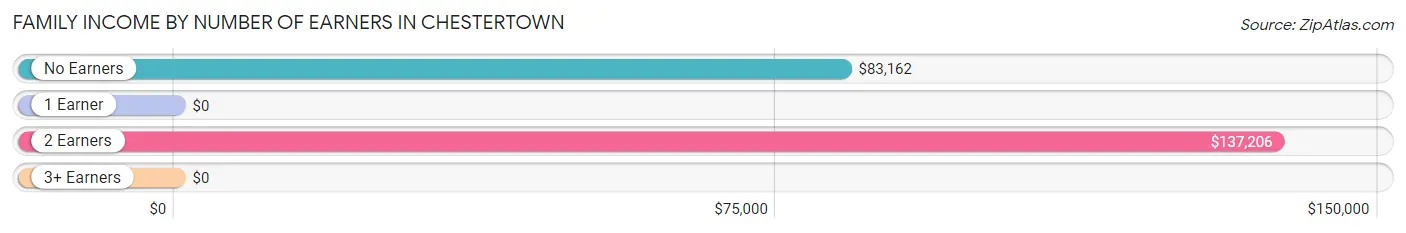
| Number of Earners | # Families | Median Income |
| No Earners | 277 (25.2%) | $83,162 |
| 1 Earner | 428 (38.9%) | $0 |
| 2 Earners | 368 (33.5%) | $137,206 |
| 3+ Earners | 27 (2.5%) | $0 |
| Total | 1,100 (100.0%) | $75,976 |
Household Income in Chestertown
Household Income Brackets in Chestertown
With 551 households falling in the category, the $35,000 to $49,999 income range is the most frequent in Chestertown, accounting for 23.9% of all households. In contrast, only 85 households (3.7%) fall into the $200,000+ income bracket, making it the least populous group.
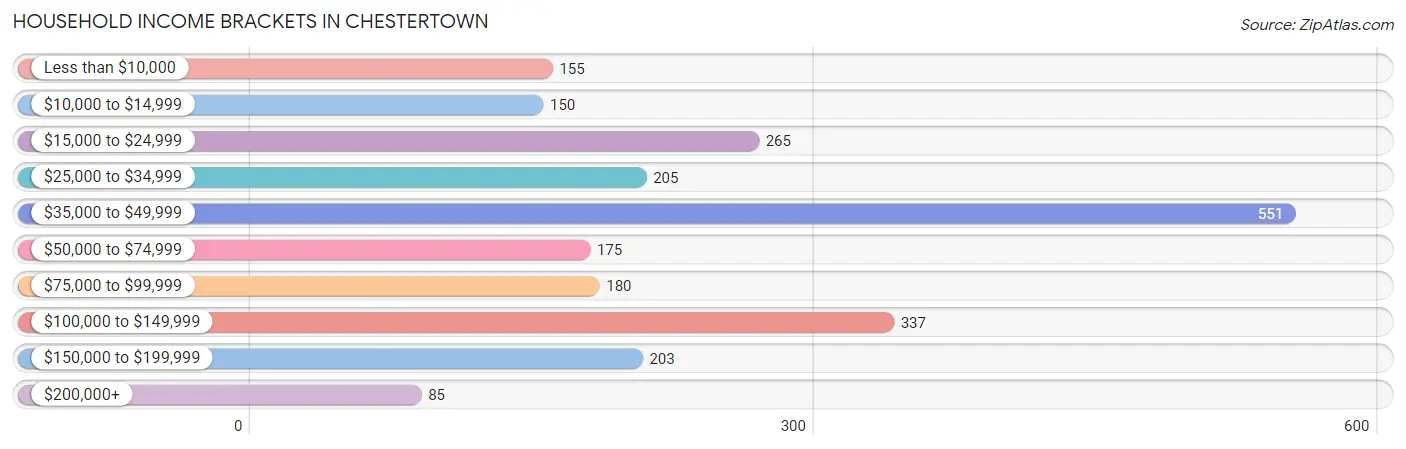
| Income Bracket | # Households | % Households |
| Less than $10,000 | 155 | 6.7% |
| $10,000 to $14,999 | 150 | 6.5% |
| $15,000 to $24,999 | 265 | 11.5% |
| $25,000 to $34,999 | 205 | 8.9% |
| $35,000 to $49,999 | 551 | 23.9% |
| $50,000 to $74,999 | 175 | 7.6% |
| $75,000 to $99,999 | 180 | 7.8% |
| $100,000 to $149,999 | 337 | 14.6% |
| $150,000 to $199,999 | 203 | 8.8% |
| $200,000+ | 85 | 3.7% |
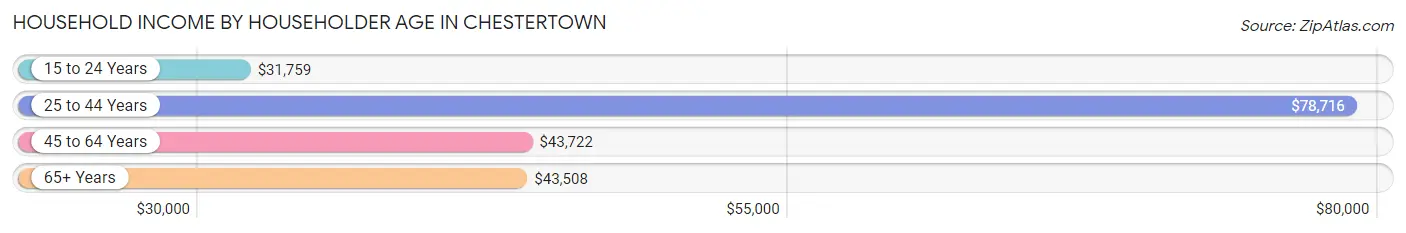
Household Income by Householder Age in Chestertown
The median household income in Chestertown is $43,980, with the highest median household income of $78,716 found in the 25 to 44 years age bracket for the primary householder. A total of 573 households (24.8%) fall into this category. Meanwhile, the 15 to 24 years age bracket for the primary householder has the lowest median household income of $31,759, with 130 households (5.6%) in this group.
| Income Bracket | # Households | Median Income |
| 15 to 24 Years | 130 (5.6%) | $31,759 |
| 25 to 44 Years | 573 (24.8%) | $78,716 |
| 45 to 64 Years | 700 (30.4%) | $43,722 |
| 65+ Years | 903 (39.2%) | $43,508 |
| Total | 2,306 (100.0%) | $43,980 |
Poverty in Chestertown
Income Below Poverty by Sex and Age in Chestertown
With 16.9% poverty level for males and 15.6% for females among the residents of Chestertown, 16 and 17 year old males and 16 and 17 year old females are the most vulnerable to poverty, with 92 males (71.3%) and 15 females (100.0%) in their respective age groups living below the poverty level.
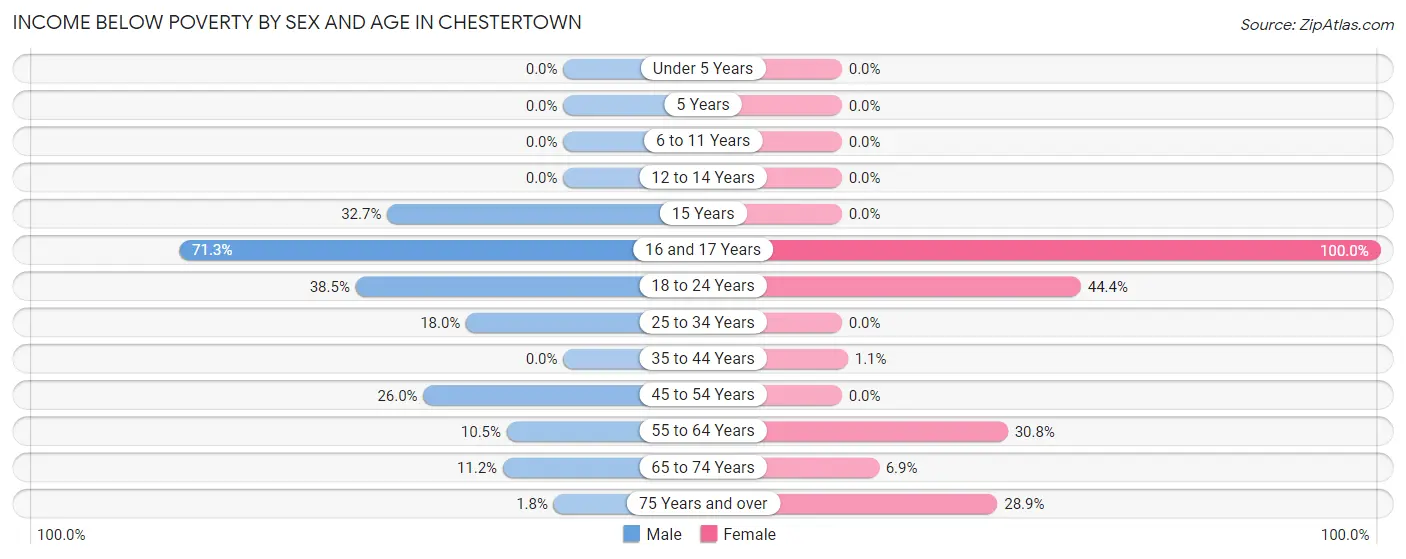
| Age Bracket | Male | Female |
| Under 5 Years | 0 (0.0%) | 0 (0.0%) |
| 5 Years | 0 (0.0%) | 0 (0.0%) |
| 6 to 11 Years | 0 (0.0%) | 0 (0.0%) |
| 12 to 14 Years | 0 (0.0%) | 0 (0.0%) |
| 15 Years | 17 (32.7%) | 0 (0.0%) |
| 16 and 17 Years | 92 (71.3%) | 15 (100.0%) |
| 18 to 24 Years | 111 (38.5%) | 59 (44.4%) |
| 25 to 34 Years | 42 (18.0%) | 0 (0.0%) |
| 35 to 44 Years | 0 (0.0%) | 2 (1.1%) |
| 45 to 54 Years | 40 (26.0%) | 0 (0.0%) |
| 55 to 64 Years | 17 (10.5%) | 105 (30.8%) |
| 65 to 74 Years | 24 (11.2%) | 20 (6.9%) |
| 75 Years and over | 6 (1.8%) | 125 (28.9%) |
| Total | 349 (16.9%) | 326 (15.6%) |
Income Above Poverty by Sex and Age in Chestertown
According to the poverty statistics in Chestertown, males aged under 5 years and females aged under 5 years are the age groups that are most secure financially, with 100.0% of males and 100.0% of females in these age groups living above the poverty line.
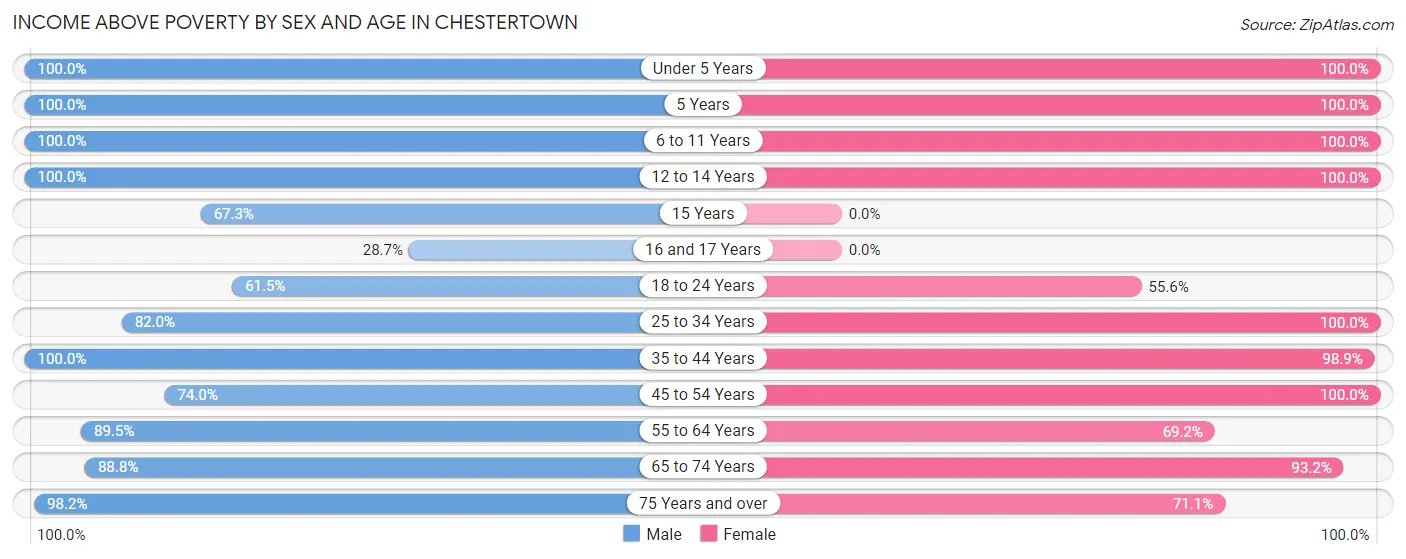
| Age Bracket | Male | Female |
| Under 5 Years | 180 (100.0%) | 60 (100.0%) |
| 5 Years | 4 (100.0%) | 73 (100.0%) |
| 6 to 11 Years | 179 (100.0%) | 9 (100.0%) |
| 12 to 14 Years | 17 (100.0%) | 40 (100.0%) |
| 15 Years | 35 (67.3%) | 0 (0.0%) |
| 16 and 17 Years | 37 (28.7%) | 0 (0.0%) |
| 18 to 24 Years | 177 (61.5%) | 74 (55.6%) |
| 25 to 34 Years | 191 (82.0%) | 275 (100.0%) |
| 35 to 44 Years | 115 (100.0%) | 178 (98.9%) |
| 45 to 54 Years | 114 (74.0%) | 242 (100.0%) |
| 55 to 64 Years | 145 (89.5%) | 236 (69.2%) |
| 65 to 74 Years | 190 (88.8%) | 272 (93.1%) |
| 75 Years and over | 333 (98.2%) | 308 (71.1%) |
| Total | 1,717 (83.1%) | 1,767 (84.4%) |
Income Below Poverty Among Married-Couple Families in Chestertown
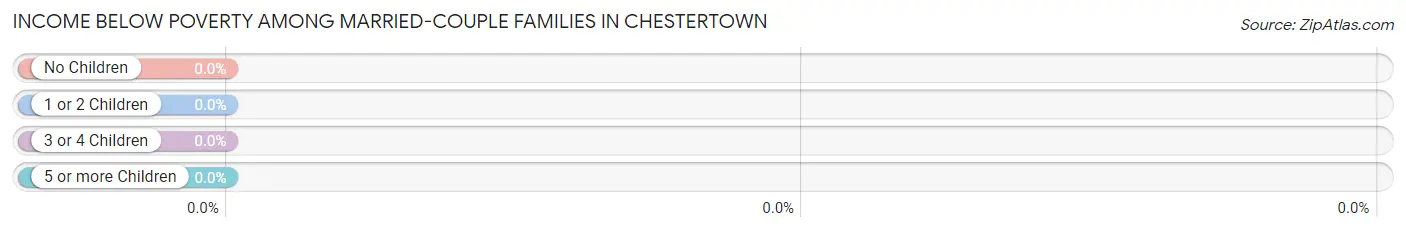
| Children | Above Poverty | Below Poverty |
| No Children | 441 (100.0%) | 0 (0.0%) |
| 1 or 2 Children | 56 (100.0%) | 0 (0.0%) |
| 3 or 4 Children | 65 (100.0%) | 0 (0.0%) |
| 5 or more Children | 0 (0.0%) | 0 (0.0%) |
| Total | 562 (100.0%) | 0 (0.0%) |
Income Below Poverty Among Single-Parent Households in Chestertown
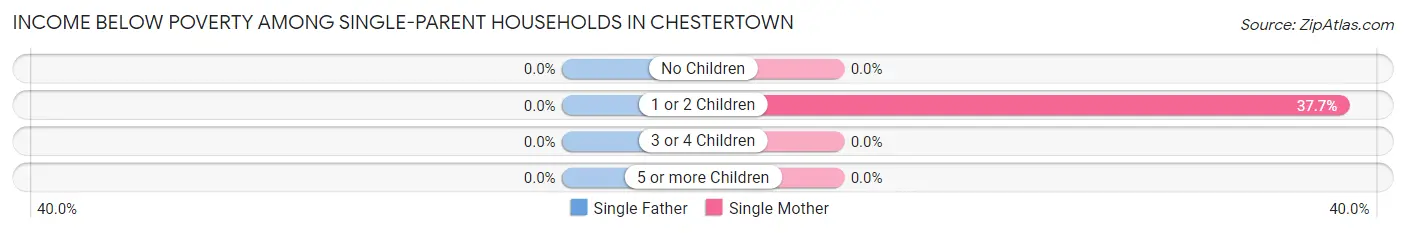
| Children | Single Father | Single Mother |
| No Children | 0 (0.0%) | 0 (0.0%) |
| 1 or 2 Children | 0 (0.0%) | 125 (37.7%) |
| 3 or 4 Children | 0 (0.0%) | 0 (0.0%) |
| 5 or more Children | 0 (0.0%) | 0 (0.0%) |
| Total | 0 (0.0%) | 125 (26.2%) |
Income Below Poverty Among Married-Couple vs Single-Parent Households in Chestertown
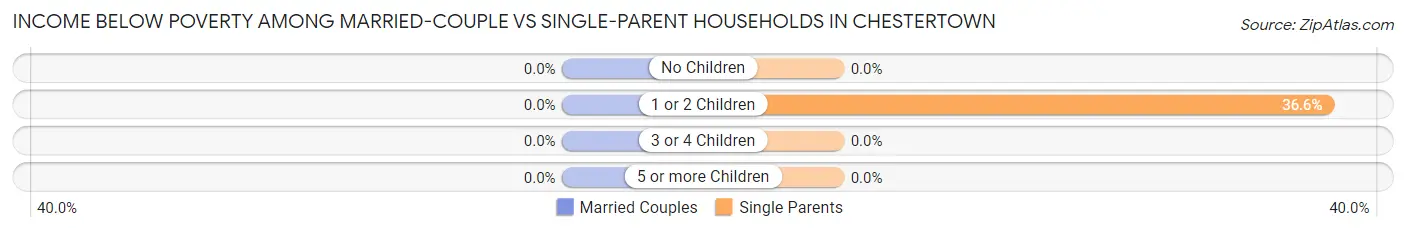
| Children | Married-Couple Families | Single-Parent Households |
| No Children | 0 (0.0%) | 0 (0.0%) |
| 1 or 2 Children | 0 (0.0%) | 125 (36.5%) |
| 3 or 4 Children | 0 (0.0%) | 0 (0.0%) |
| 5 or more Children | 0 (0.0%) | 0 (0.0%) |
| Total | 0 (0.0%) | 125 (23.2%) |
Race in Chestertown
The most populous races in Chestertown are White / Caucasian (3,913 | 70.9%), Black / African American (1,326 | 24.0%), and Hispanic or Latino (224 | 4.1%).
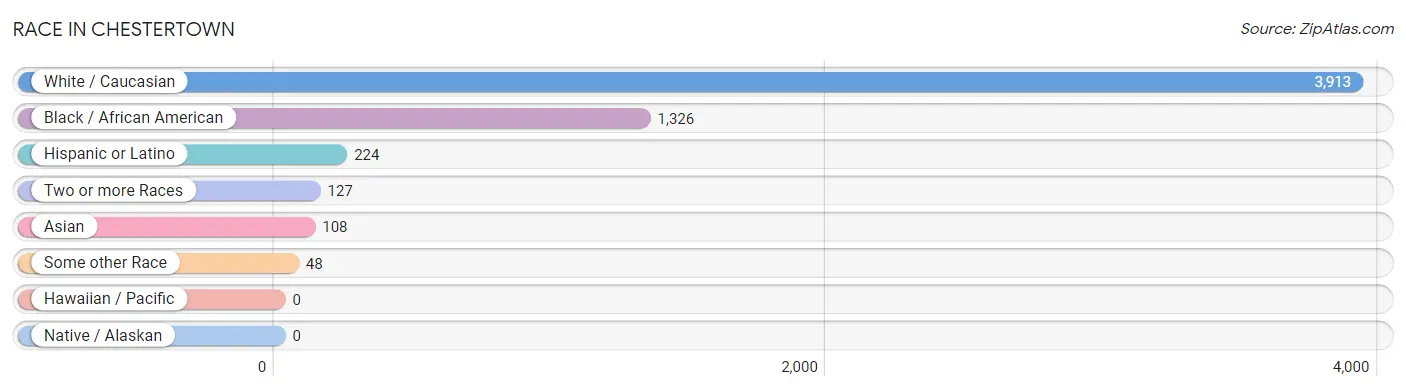
| Race | # Population | % Population |
| Asian | 108 | 2.0% |
| Black / African American | 1,326 | 24.0% |
| Hawaiian / Pacific | 0 | 0.0% |
| Hispanic or Latino | 224 | 4.1% |
| Native / Alaskan | 0 | 0.0% |
| White / Caucasian | 3,913 | 70.9% |
| Two or more Races | 127 | 2.3% |
| Some other Race | 48 | 0.9% |
| Total | 5,522 | 100.0% |
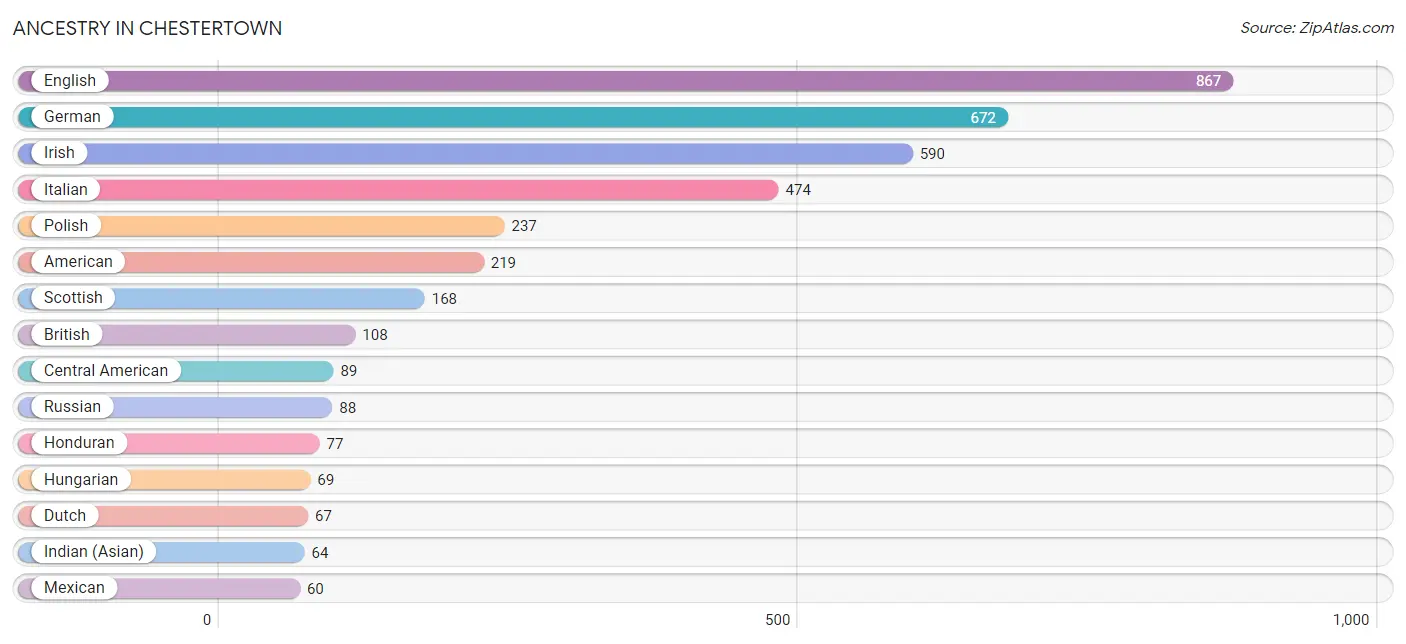
Ancestry in Chestertown
The most populous ancestries reported in Chestertown are English (867 | 15.7%), German (672 | 12.2%), Irish (590 | 10.7%), Italian (474 | 8.6%), and Polish (237 | 4.3%), together accounting for 51.4% of all Chestertown residents.
| Ancestry | # Population | % Population |
| African | 3 | 0.1% |
| American | 219 | 4.0% |
| Arab | 4 | 0.1% |
| Austrian | 42 | 0.8% |
| Bhutanese | 27 | 0.5% |
| British | 108 | 2.0% |
| Central American | 89 | 1.6% |
| Cuban | 22 | 0.4% |
| Czech | 21 | 0.4% |
| Dominican | 1 | 0.0% |
| Dutch | 67 | 1.2% |
| Eastern European | 50 | 0.9% |
| English | 867 | 15.7% |
| Ethiopian | 10 | 0.2% |
| European | 23 | 0.4% |
| French | 53 | 1.0% |
| French Canadian | 36 | 0.6% |
| German | 672 | 12.2% |
| Ghanaian | 5 | 0.1% |
| Guatemalan | 12 | 0.2% |
| Haitian | 5 | 0.1% |
| Honduran | 77 | 1.4% |
| Hungarian | 69 | 1.3% |
| Indian (Asian) | 64 | 1.2% |
| Indonesian | 28 | 0.5% |
| Iraqi | 4 | 0.1% |
| Irish | 590 | 10.7% |
| Iroquois | 10 | 0.2% |
| Italian | 474 | 8.6% |
| Korean | 10 | 0.2% |
| Lithuanian | 12 | 0.2% |
| Mexican | 60 | 1.1% |
| Native Hawaiian | 10 | 0.2% |
| Northern European | 33 | 0.6% |
| Norwegian | 17 | 0.3% |
| Polish | 237 | 4.3% |
| Puerto Rican | 11 | 0.2% |
| Russian | 88 | 1.6% |
| Scotch-Irish | 52 | 0.9% |
| Scottish | 168 | 3.0% |
| Slovak | 12 | 0.2% |
| Spaniard | 14 | 0.3% |
| Spanish | 25 | 0.4% |
| Subsaharan African | 18 | 0.3% |
| Swedish | 19 | 0.3% |
| Thai | 28 | 0.5% |
| Trinidadian and Tobagonian | 10 | 0.2% |
| Ugandan | 2 | 0.0% |
| Welsh | 50 | 0.9% |
| West Indian | 10 | 0.2% | View All 50 Rows |
Immigrants in Chestertown
The most numerous immigrant groups reported in Chestertown came from Latin America (109 | 2.0%), Asia (91 | 1.7%), Central America (87 | 1.6%), Europe (80 | 1.5%), and Honduras (77 | 1.4%), together accounting for 8.0% of all Chestertown residents.
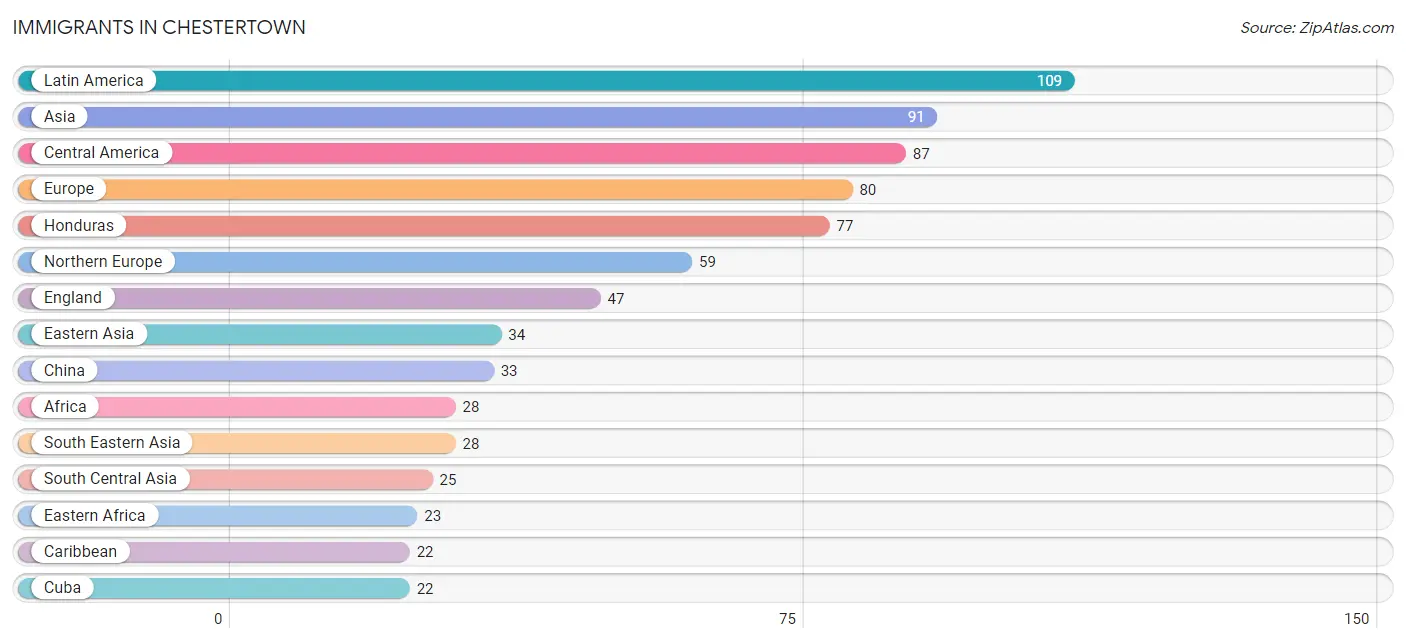
| Immigration Origin | # Population | % Population |
| Africa | 28 | 0.5% |
| Asia | 91 | 1.7% |
| Bangladesh | 16 | 0.3% |
| Caribbean | 22 | 0.4% |
| Central America | 87 | 1.6% |
| China | 33 | 0.6% |
| Cuba | 22 | 0.4% |
| Eastern Africa | 23 | 0.4% |
| Eastern Asia | 34 | 0.6% |
| England | 47 | 0.9% |
| Ethiopia | 10 | 0.2% |
| Europe | 80 | 1.5% |
| France | 4 | 0.1% |
| Germany | 3 | 0.1% |
| Ghana | 5 | 0.1% |
| Honduras | 77 | 1.4% |
| Hong Kong | 19 | 0.3% |
| India | 9 | 0.2% |
| Iraq | 4 | 0.1% |
| Korea | 1 | 0.0% |
| Latin America | 109 | 2.0% |
| Mexico | 10 | 0.2% |
| Netherlands | 14 | 0.3% |
| Northern Europe | 59 | 1.1% |
| South Central Asia | 25 | 0.4% |
| South Eastern Asia | 28 | 0.5% |
| Uganda | 2 | 0.0% |
| Western Africa | 5 | 0.1% |
| Western Asia | 4 | 0.1% |
| Western Europe | 21 | 0.4% | View All 30 Rows |
Sex and Age in Chestertown
Sex and Age in Chestertown
The most populous age groups in Chestertown are 20 to 24 Years (449 | 18.5%) for men and 15 to 19 Years (535 | 17.3%) for women.
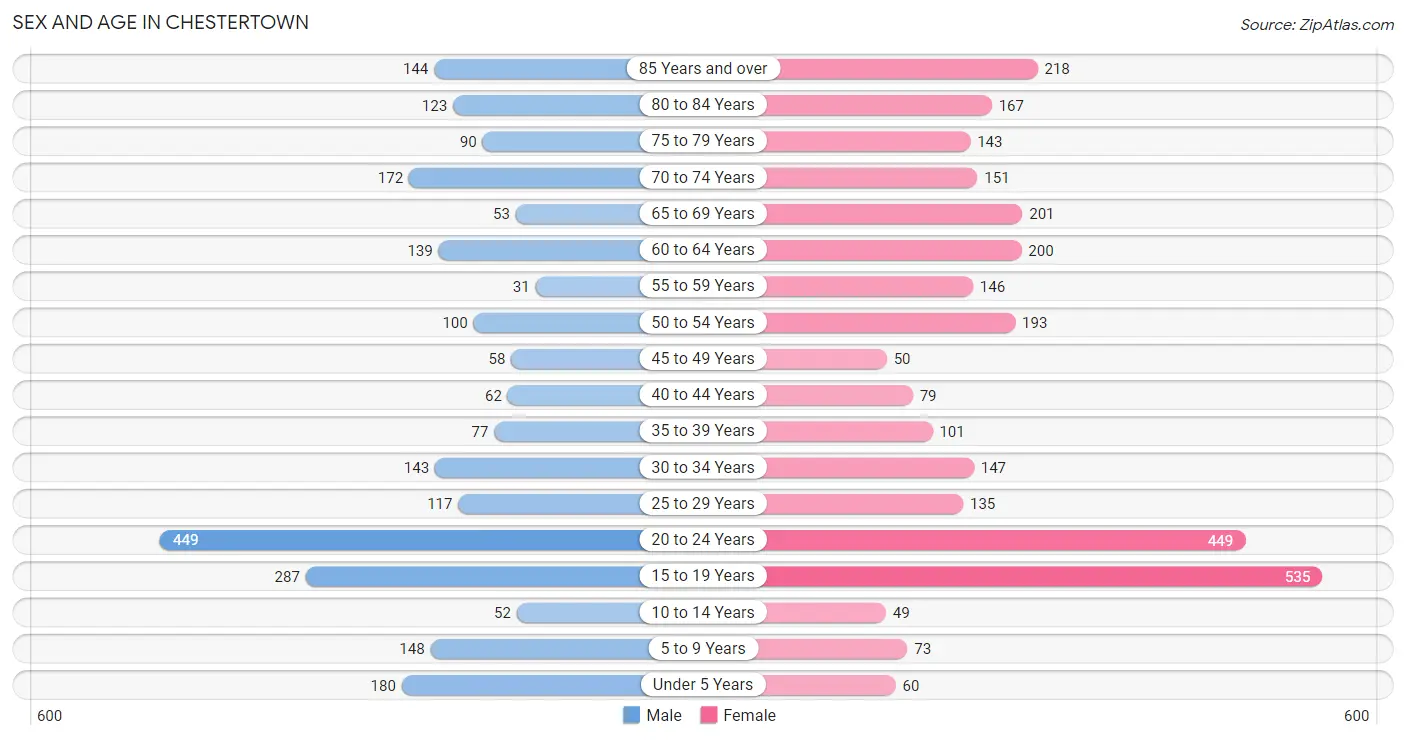
| Age Bracket | Male | Female |
| Under 5 Years | 180 (7.4%) | 60 (1.9%) |
| 5 to 9 Years | 148 (6.1%) | 73 (2.4%) |
| 10 to 14 Years | 52 (2.1%) | 49 (1.6%) |
| 15 to 19 Years | 287 (11.8%) | 535 (17.3%) |
| 20 to 24 Years | 449 (18.5%) | 449 (14.5%) |
| 25 to 29 Years | 117 (4.8%) | 135 (4.4%) |
| 30 to 34 Years | 143 (5.9%) | 147 (4.8%) |
| 35 to 39 Years | 77 (3.2%) | 101 (3.3%) |
| 40 to 44 Years | 62 (2.6%) | 79 (2.5%) |
| 45 to 49 Years | 58 (2.4%) | 50 (1.6%) |
| 50 to 54 Years | 100 (4.1%) | 193 (6.2%) |
| 55 to 59 Years | 31 (1.3%) | 146 (4.7%) |
| 60 to 64 Years | 139 (5.7%) | 200 (6.5%) |
| 65 to 69 Years | 53 (2.2%) | 201 (6.5%) |
| 70 to 74 Years | 172 (7.1%) | 151 (4.9%) |
| 75 to 79 Years | 90 (3.7%) | 143 (4.6%) |
| 80 to 84 Years | 123 (5.1%) | 167 (5.4%) |
| 85 Years and over | 144 (5.9%) | 218 (7.0%) |
| Total | 2,425 (100.0%) | 3,097 (100.0%) |
Families and Households in Chestertown
Median Family Size in Chestertown
The median family size in Chestertown is 2.40 persons per family, with married-couple families (562 | 51.1%) accounting for the largest median family size of 2.43 persons per family. On the other hand, single male/father families (60 | 5.4%) represent the smallest median family size with 2.23 persons per family.
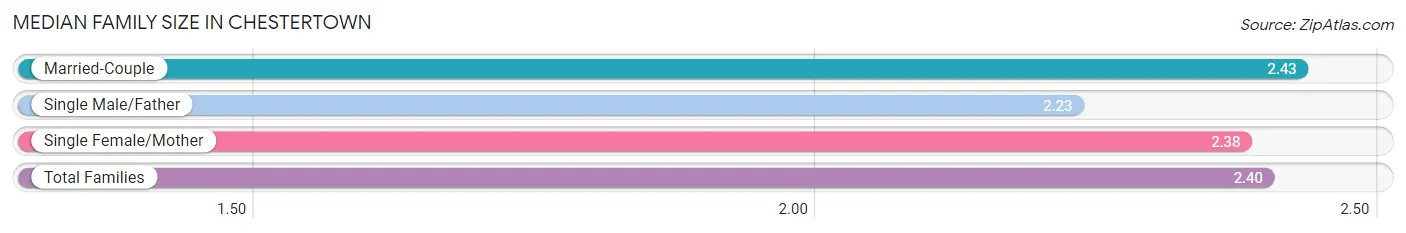
| Family Type | # Families | Family Size |
| Married-Couple | 562 (51.1%) | 2.43 |
| Single Male/Father | 60 (5.4%) | 2.23 |
| Single Female/Mother | 478 (43.4%) | 2.38 |
| Total Families | 1,100 (100.0%) | 2.40 |
Median Household Size in Chestertown
The median household size in Chestertown is 1.78 persons per household, with married-couple households (562 | 24.4%) accounting for the largest median household size of 2.43 persons per household. non-family households (1,206 | 52.3%) represent the smallest median household size with 1.22 persons per household.
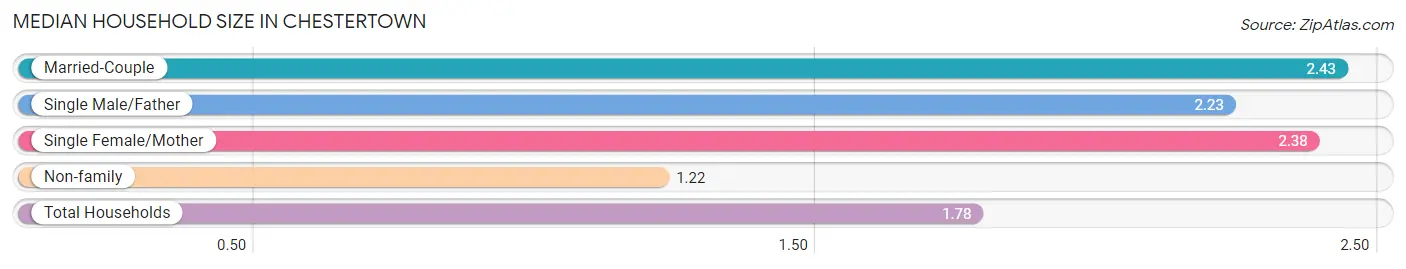
| Household Type | # Households | Household Size |
| Married-Couple | 562 (24.4%) | 2.43 |
| Single Male/Father | 60 (2.6%) | 2.23 |
| Single Female/Mother | 478 (20.7%) | 2.38 |
| Non-family | 1,206 (52.3%) | 1.22 |
| Total Households | 2,306 (100.0%) | 1.78 |
Household Size by Marriage Status in Chestertown
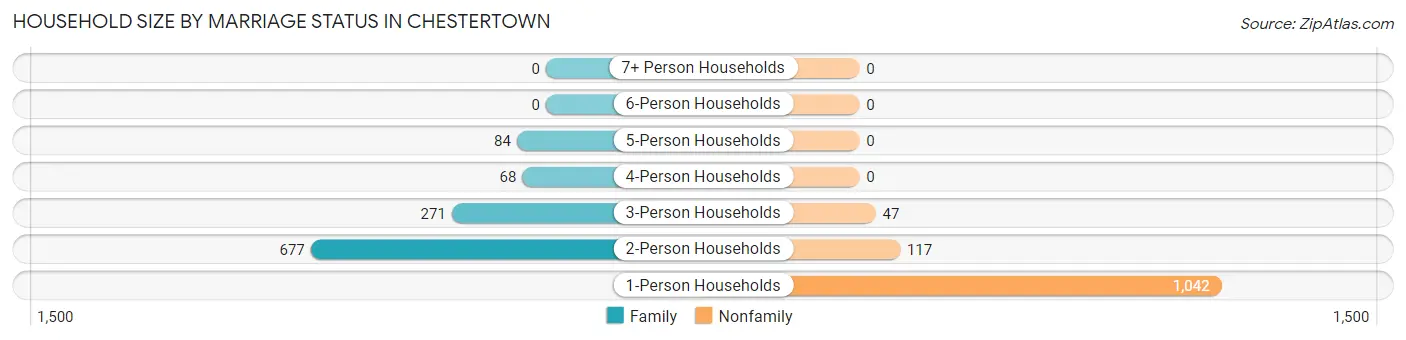
Out of a total of 2,306 households in Chestertown, 1,100 (47.7%) are family households, while 1,206 (52.3%) are nonfamily households. The most numerous type of family households are 2-person households, comprising 677, and the most common type of nonfamily households are 1-person households, comprising 1,042.
| Household Size | Family Households | Nonfamily Households |
| 1-Person Households | - | 1,042 (45.2%) |
| 2-Person Households | 677 (29.4%) | 117 (5.1%) |
| 3-Person Households | 271 (11.7%) | 47 (2.0%) |
| 4-Person Households | 68 (2.9%) | 0 (0.0%) |
| 5-Person Households | 84 (3.6%) | 0 (0.0%) |
| 6-Person Households | 0 (0.0%) | 0 (0.0%) |
| 7+ Person Households | 0 (0.0%) | 0 (0.0%) |
| Total | 1,100 (47.7%) | 1,206 (52.3%) |
Female Fertility in Chestertown
Fertility by Age in Chestertown
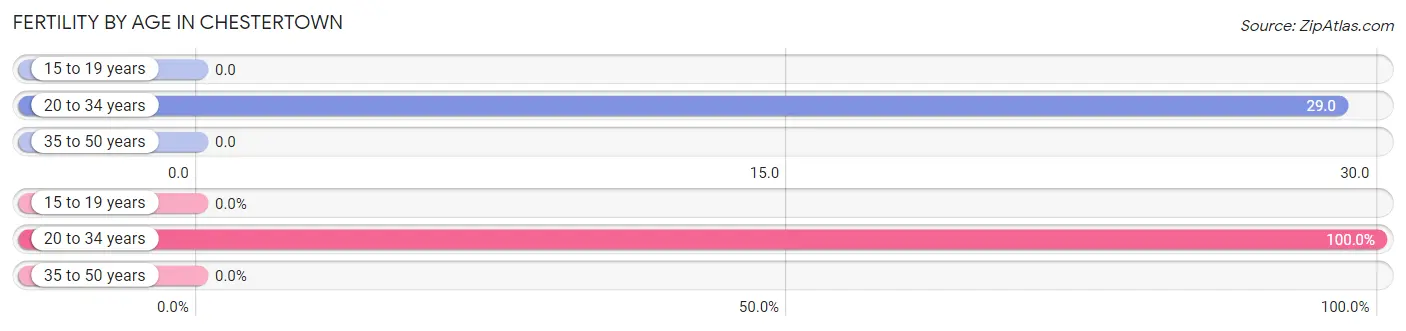
Average fertility rate in Chestertown is 14.0 births per 1,000 women. Women in the age bracket of 20 to 34 years have the highest fertility rate with 29.0 births per 1,000 women. Women in the age bracket of 20 to 34 years acount for 100.0% of all women with births.
| Age Bracket | Women with Births | Births / 1,000 Women |
| 15 to 19 years | 0 (0.0%) | 0.0 |
| 20 to 34 years | 21 (100.0%) | 29.0 |
| 35 to 50 years | 0 (0.0%) | 0.0 |
| Total | 21 (100.0%) | 14.0 |
Fertility by Age by Marriage Status in Chestertown
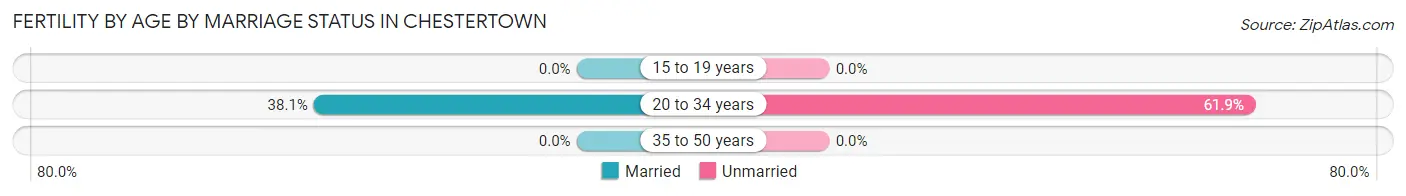
38.1% of women with births (21) in Chestertown are married. The highest percentage of unmarried women with births falls into 20 to 34 years age bracket with 61.9% of them unmarried at the time of birth, while the lowest percentage of unmarried women with births belong to 20 to 34 years age bracket with 61.9% of them unmarried.
| Age Bracket | Married | Unmarried |
| 15 to 19 years | 0 (0.0%) | 0 (0.0%) |
| 20 to 34 years | 8 (38.1%) | 13 (61.9%) |
| 35 to 50 years | 0 (0.0%) | 0 (0.0%) |
| Total | 8 (38.1%) | 13 (61.9%) |
Fertility by Education in Chestertown
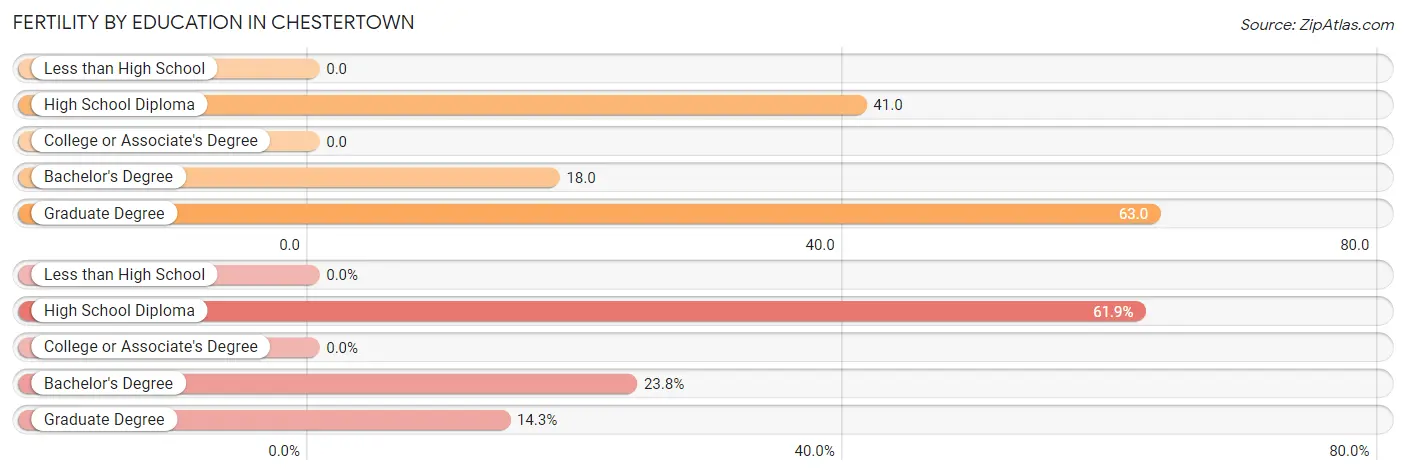
| Educational Attainment | Women with Births | Births / 1,000 Women |
| Less than High School | 0 (0.0%) | 0.0 |
| High School Diploma | 13 (61.9%) | 41.0 |
| College or Associate's Degree | 0 (0.0%) | 0.0 |
| Bachelor's Degree | 5 (23.8%) | 18.0 |
| Graduate Degree | 3 (14.3%) | 63.0 |
| Total | 21 (100.0%) | 14.0 |
Fertility by Education by Marriage Status in Chestertown
61.9% of women with births in Chestertown are unmarried. Women with the educational attainment of bachelor's degree are most likely to be married with 100.0% of them married at childbirth, while women with the educational attainment of high school diploma are least likely to be married with 100.0% of them unmarried at childbirth.
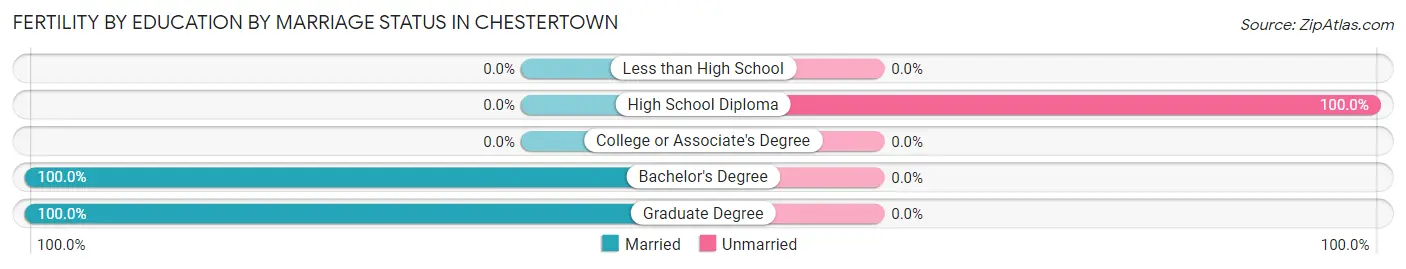
| Educational Attainment | Married | Unmarried |
| Less than High School | 0 (0.0%) | 0 (0.0%) |
| High School Diploma | 0 (0.0%) | 13 (100.0%) |
| College or Associate's Degree | 0 (0.0%) | 0 (0.0%) |
| Bachelor's Degree | 5 (100.0%) | 0 (0.0%) |
| Graduate Degree | 3 (100.0%) | 0 (0.0%) |
| Total | 8 (38.1%) | 13 (61.9%) |
Employment Characteristics in Chestertown
Employment by Class of Employer in Chestertown
Among the 2,276 employed individuals in Chestertown, private company employees (1,283 | 56.4%), not-for-profit organizations (419 | 18.4%), and state government employees (191 | 8.4%) make up the most common classes of employment.
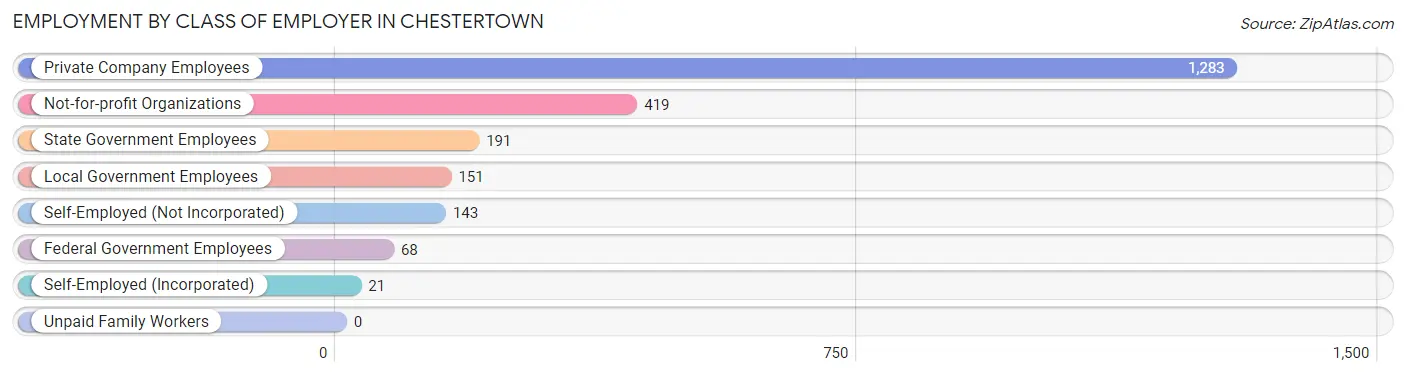
| Employer Class | # Employees | % Employees |
| Private Company Employees | 1,283 | 56.4% |
| Self-Employed (Incorporated) | 21 | 0.9% |
| Self-Employed (Not Incorporated) | 143 | 6.3% |
| Not-for-profit Organizations | 419 | 18.4% |
| Local Government Employees | 151 | 6.6% |
| State Government Employees | 191 | 8.4% |
| Federal Government Employees | 68 | 3.0% |
| Unpaid Family Workers | 0 | 0.0% |
| Total | 2,276 | 100.0% |
Employment Status by Age in Chestertown
According to the labor force statistics for Chestertown, out of the total population over 16 years of age (4,905), 48.3% or 2,369 individuals are in the labor force, with 3.9% or 92 of them unemployed. The age group with the highest labor force participation rate is 25 to 29 years, with 94.8% or 239 individuals in the labor force. Within the labor force, the 45 to 54 years age range has the highest percentage of unemployed individuals, with 14.6% or 52 of them being unemployed.
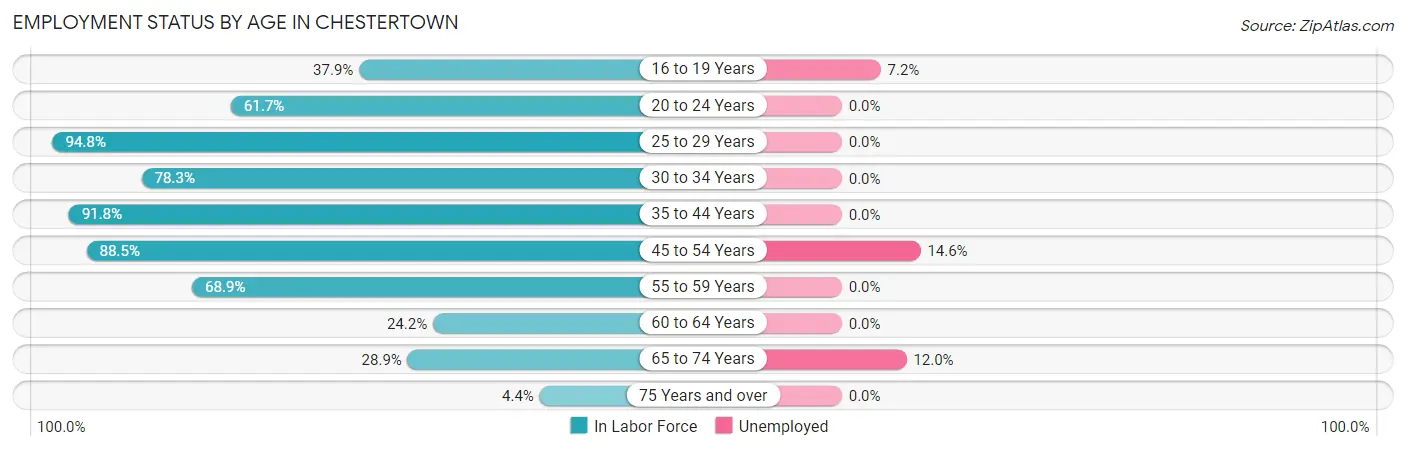
| Age Bracket | In Labor Force | Unemployed |
| 16 to 19 Years | 291 (37.9%) | 21 (7.2%) |
| 20 to 24 Years | 554 (61.7%) | 0 (0.0%) |
| 25 to 29 Years | 239 (94.8%) | 0 (0.0%) |
| 30 to 34 Years | 227 (78.3%) | 0 (0.0%) |
| 35 to 44 Years | 293 (91.8%) | 0 (0.0%) |
| 45 to 54 Years | 355 (88.5%) | 52 (14.6%) |
| 55 to 59 Years | 122 (68.9%) | 0 (0.0%) |
| 60 to 64 Years | 82 (24.2%) | 0 (0.0%) |
| 65 to 74 Years | 167 (28.9%) | 20 (12.0%) |
| 75 Years and over | 39 (4.4%) | 0 (0.0%) |
| Total | 2,369 (48.3%) | 92 (3.9%) |
Employment Status by Educational Attainment in Chestertown
According to labor force statistics for Chestertown, 74.1% of individuals (1,317) out of the total population between 25 and 64 years of age (1,778) are in the labor force, with 3.9% or 51 of them being unemployed. The group with the highest labor force participation rate are those with the educational attainment of high school diploma, with 87.0% or 383 individuals in the labor force. Within the labor force, individuals with college / associate degree education have the highest percentage of unemployment, with 18.3% or 52 of them being unemployed.
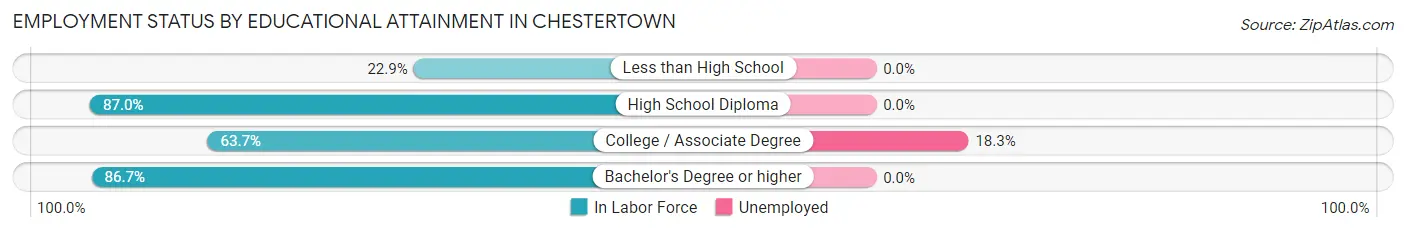
| Educational Attainment | In Labor Force | Unemployed |
| Less than High School | 44 (22.9%) | 0 (0.0%) |
| High School Diploma | 383 (87.0%) | 0 (0.0%) |
| College / Associate Degree | 284 (63.7%) | 82 (18.3%) |
| Bachelor's Degree or higher | 607 (86.7%) | 0 (0.0%) |
| Total | 1,317 (74.1%) | 69 (3.9%) |
Employment Occupations by Sex in Chestertown
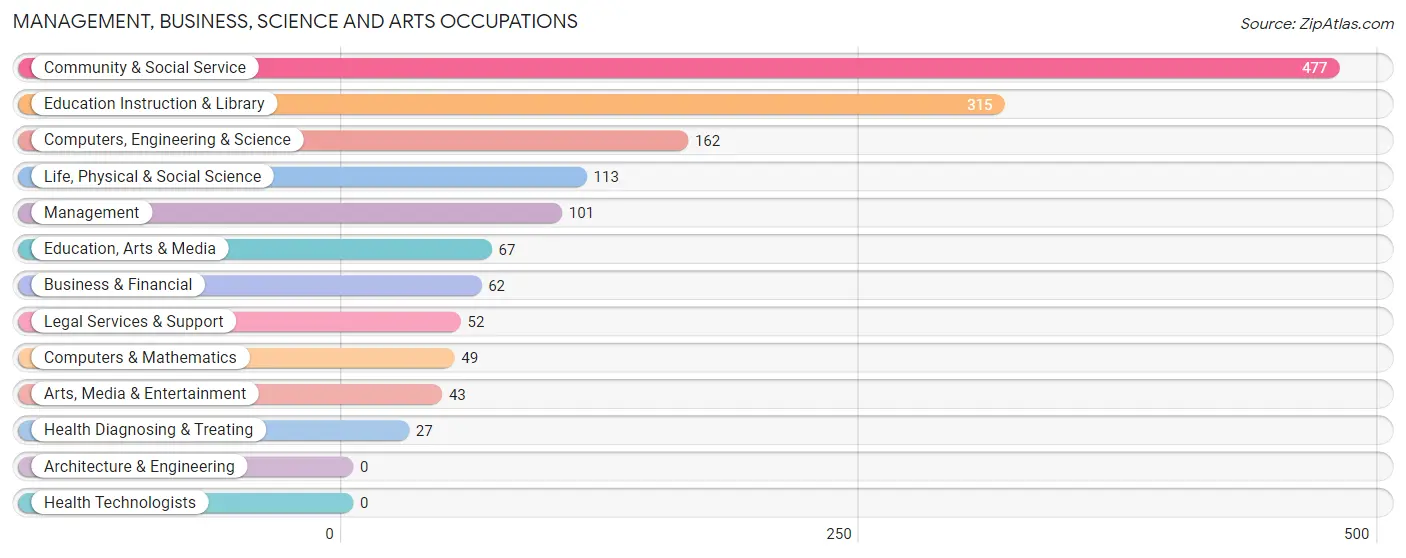
Management, Business, Science and Arts Occupations
The most common Management, Business, Science and Arts occupations in Chestertown are Community & Social Service (477 | 21.0%), Education Instruction & Library (315 | 13.8%), Computers, Engineering & Science (162 | 7.1%), Life, Physical & Social Science (113 | 5.0%), and Management (101 | 4.4%).
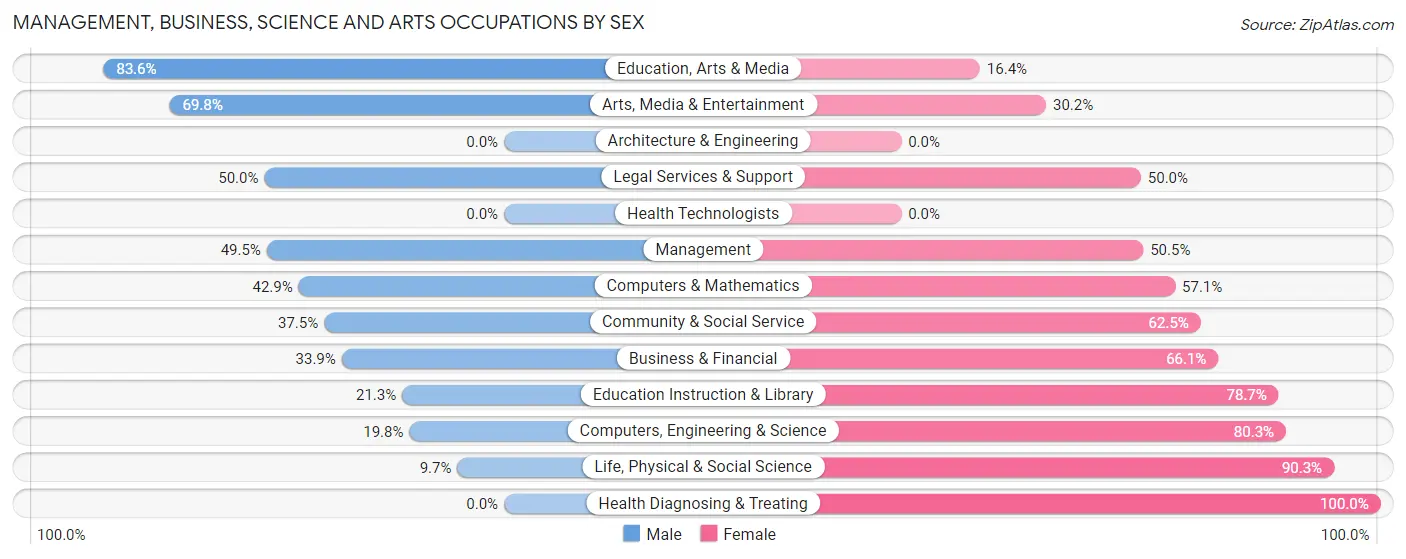
Management, Business, Science and Arts Occupations by Sex
Within the Management, Business, Science and Arts occupations in Chestertown, the most male-oriented occupations are Education, Arts & Media (83.6%), Arts, Media & Entertainment (69.8%), and Legal Services & Support (50.0%), while the most female-oriented occupations are Health Diagnosing & Treating (100.0%), Life, Physical & Social Science (90.3%), and Computers, Engineering & Science (80.2%).
| Occupation | Male | Female |
| Management | 50 (49.5%) | 51 (50.5%) |
| Business & Financial | 21 (33.9%) | 41 (66.1%) |
| Computers, Engineering & Science | 32 (19.8%) | 130 (80.2%) |
| Computers & Mathematics | 21 (42.9%) | 28 (57.1%) |
| Architecture & Engineering | 0 (0.0%) | 0 (0.0%) |
| Life, Physical & Social Science | 11 (9.7%) | 102 (90.3%) |
| Community & Social Service | 179 (37.5%) | 298 (62.5%) |
| Education, Arts & Media | 56 (83.6%) | 11 (16.4%) |
| Legal Services & Support | 26 (50.0%) | 26 (50.0%) |
| Education Instruction & Library | 67 (21.3%) | 248 (78.7%) |
| Arts, Media & Entertainment | 30 (69.8%) | 13 (30.2%) |
| Health Diagnosing & Treating | 0 (0.0%) | 27 (100.0%) |
| Health Technologists | 0 (0.0%) | 0 (0.0%) |
| Total (Category) | 282 (34.0%) | 547 (66.0%) |
| Total (Overall) | 908 (39.9%) | 1,368 (60.1%) |
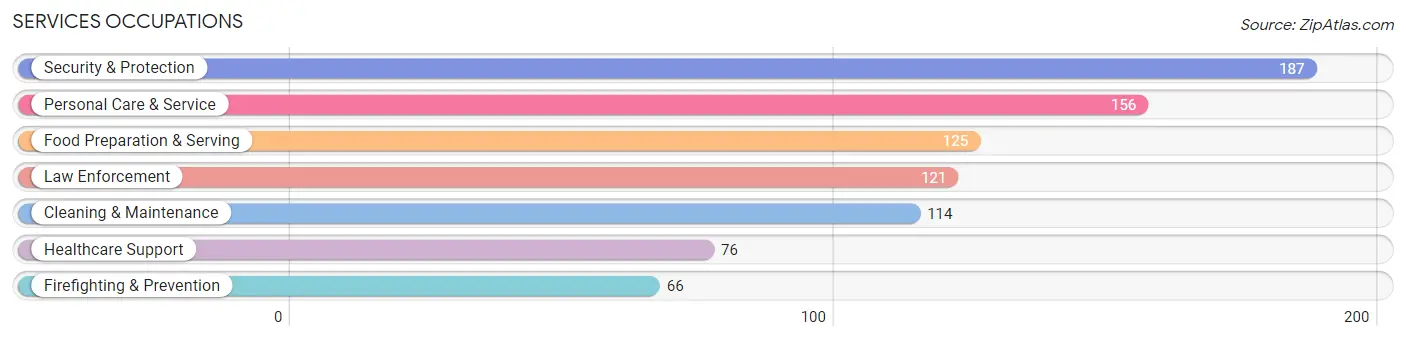
Services Occupations
The most common Services occupations in Chestertown are Security & Protection (187 | 8.2%), Personal Care & Service (156 | 6.9%), Food Preparation & Serving (125 | 5.5%), Law Enforcement (121 | 5.3%), and Cleaning & Maintenance (114 | 5.0%).
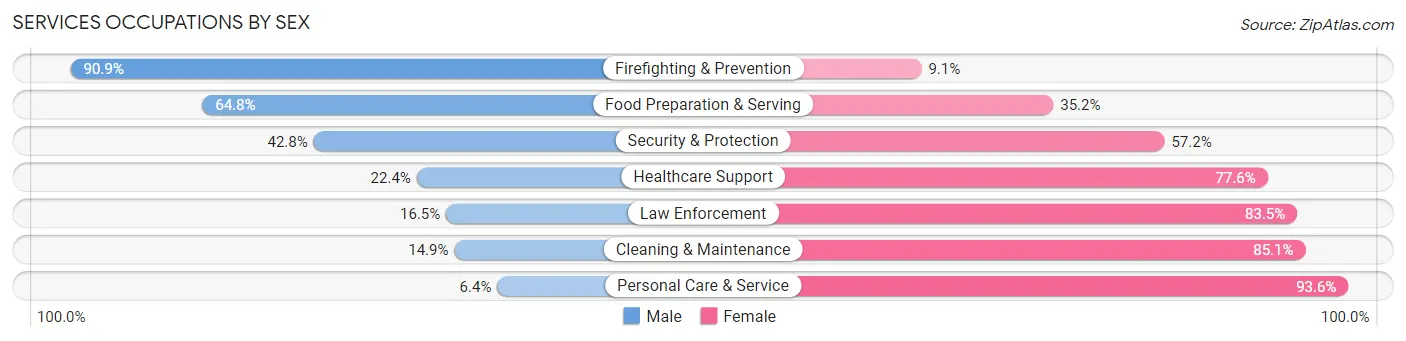
Services Occupations by Sex
Within the Services occupations in Chestertown, the most male-oriented occupations are Firefighting & Prevention (90.9%), Food Preparation & Serving (64.8%), and Security & Protection (42.8%), while the most female-oriented occupations are Personal Care & Service (93.6%), Cleaning & Maintenance (85.1%), and Law Enforcement (83.5%).
| Occupation | Male | Female |
| Healthcare Support | 17 (22.4%) | 59 (77.6%) |
| Security & Protection | 80 (42.8%) | 107 (57.2%) |
| Firefighting & Prevention | 60 (90.9%) | 6 (9.1%) |
| Law Enforcement | 20 (16.5%) | 101 (83.5%) |
| Food Preparation & Serving | 81 (64.8%) | 44 (35.2%) |
| Cleaning & Maintenance | 17 (14.9%) | 97 (85.1%) |
| Personal Care & Service | 10 (6.4%) | 146 (93.6%) |
| Total (Category) | 205 (31.2%) | 453 (68.8%) |
| Total (Overall) | 908 (39.9%) | 1,368 (60.1%) |
Sales and Office Occupations
The most common Sales and Office occupations in Chestertown are Sales & Related (230 | 10.1%), and Office & Administration (218 | 9.6%).
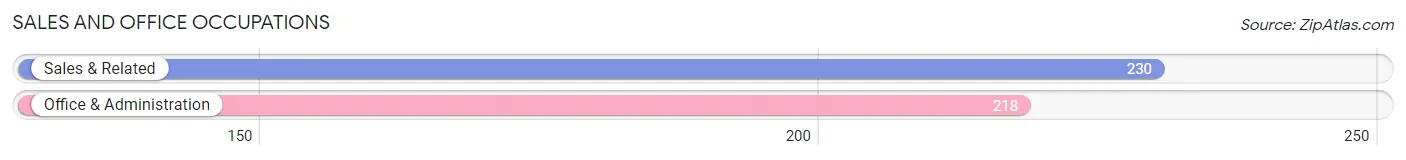
Sales and Office Occupations by Sex
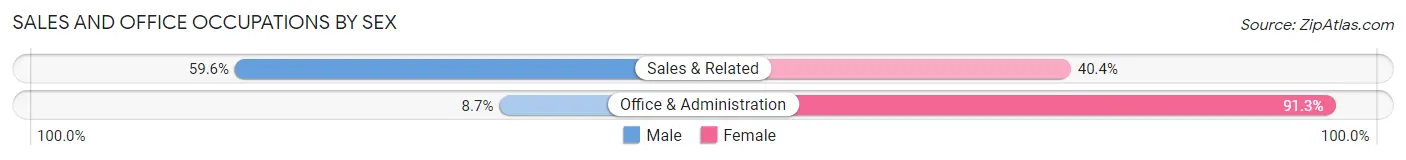
| Occupation | Male | Female |
| Sales & Related | 137 (59.6%) | 93 (40.4%) |
| Office & Administration | 19 (8.7%) | 199 (91.3%) |
| Total (Category) | 156 (34.8%) | 292 (65.2%) |
| Total (Overall) | 908 (39.9%) | 1,368 (60.1%) |
Natural Resources, Construction and Maintenance Occupations
The most common Natural Resources, Construction and Maintenance occupations in Chestertown are Installation, Maintenance & Repair (27 | 1.2%), and Construction & Extraction (19 | 0.8%).
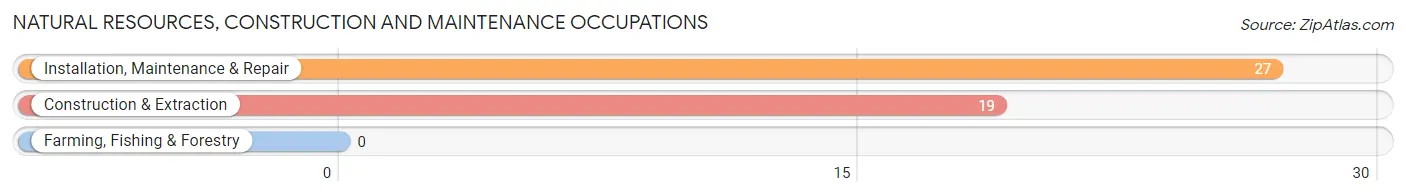
Natural Resources, Construction and Maintenance Occupations by Sex
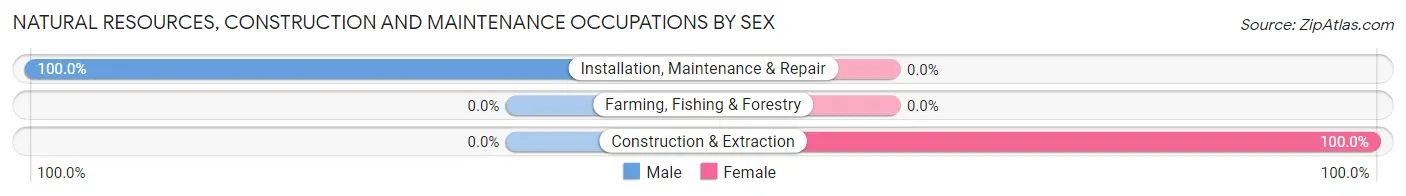
| Occupation | Male | Female |
| Farming, Fishing & Forestry | 0 (0.0%) | 0 (0.0%) |
| Construction & Extraction | 0 (0.0%) | 19 (100.0%) |
| Installation, Maintenance & Repair | 27 (100.0%) | 0 (0.0%) |
| Total (Category) | 27 (58.7%) | 19 (41.3%) |
| Total (Overall) | 908 (39.9%) | 1,368 (60.1%) |
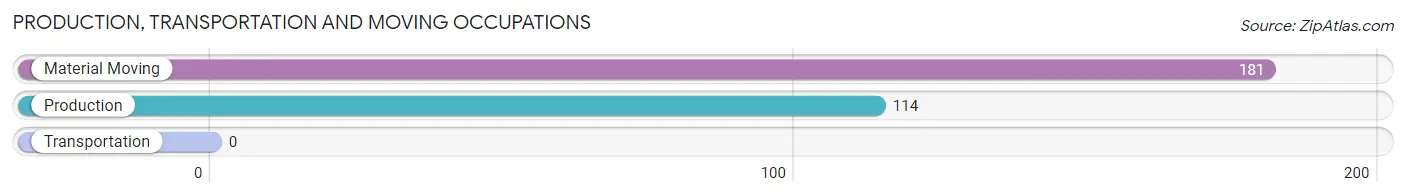
Production, Transportation and Moving Occupations
The most common Production, Transportation and Moving occupations in Chestertown are Material Moving (181 | 8.0%), and Production (114 | 5.0%).
Production, Transportation and Moving Occupations by Sex
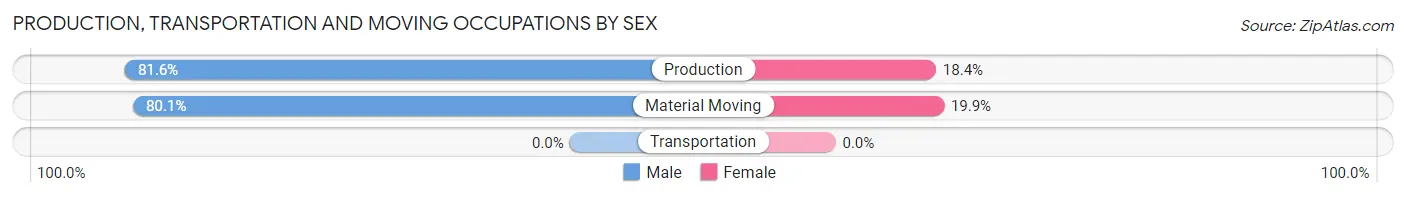
| Occupation | Male | Female |
| Production | 93 (81.6%) | 21 (18.4%) |
| Transportation | 0 (0.0%) | 0 (0.0%) |
| Material Moving | 145 (80.1%) | 36 (19.9%) |
| Total (Category) | 238 (80.7%) | 57 (19.3%) |
| Total (Overall) | 908 (39.9%) | 1,368 (60.1%) |
Employment Industries by Sex in Chestertown
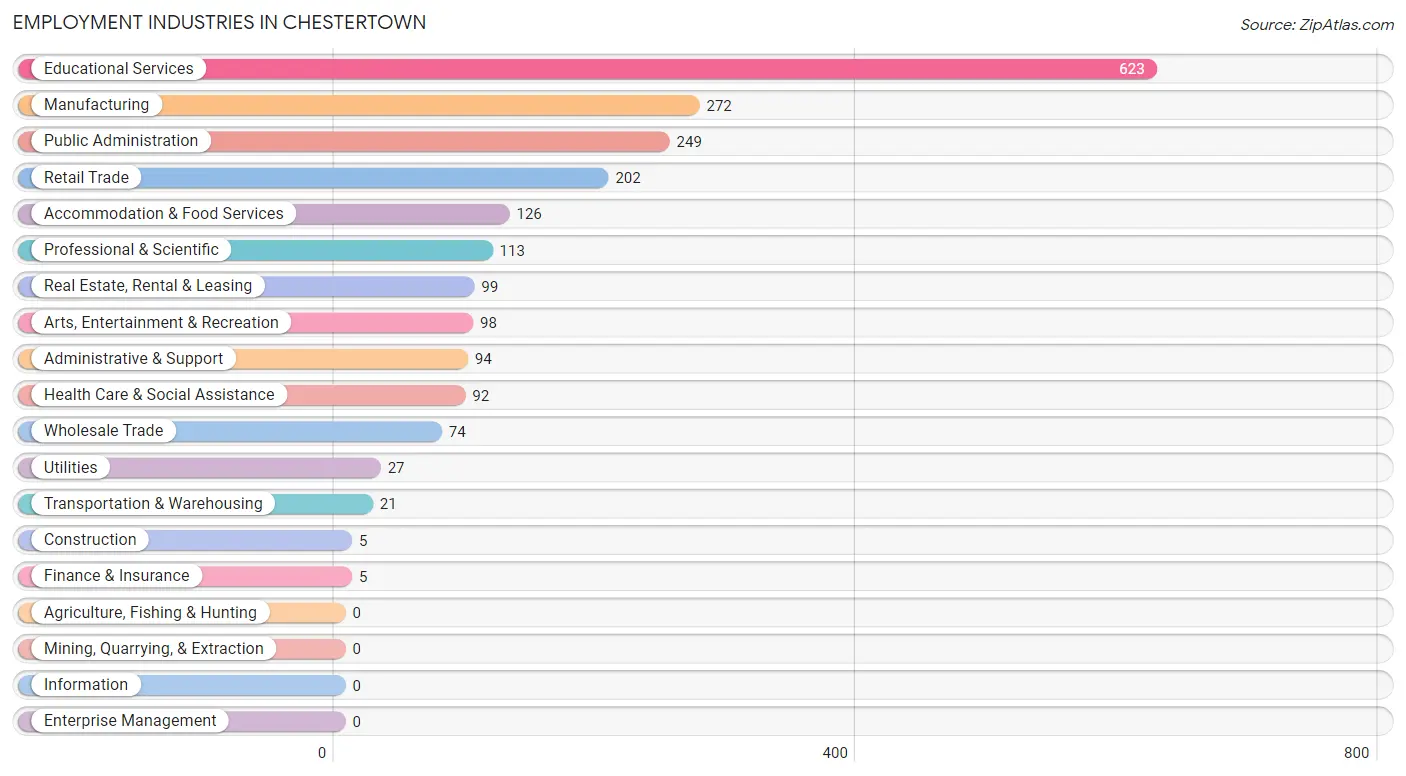
Employment Industries in Chestertown
The major employment industries in Chestertown include Educational Services (623 | 27.4%), Manufacturing (272 | 11.9%), Public Administration (249 | 10.9%), Retail Trade (202 | 8.9%), and Accommodation & Food Services (126 | 5.5%).
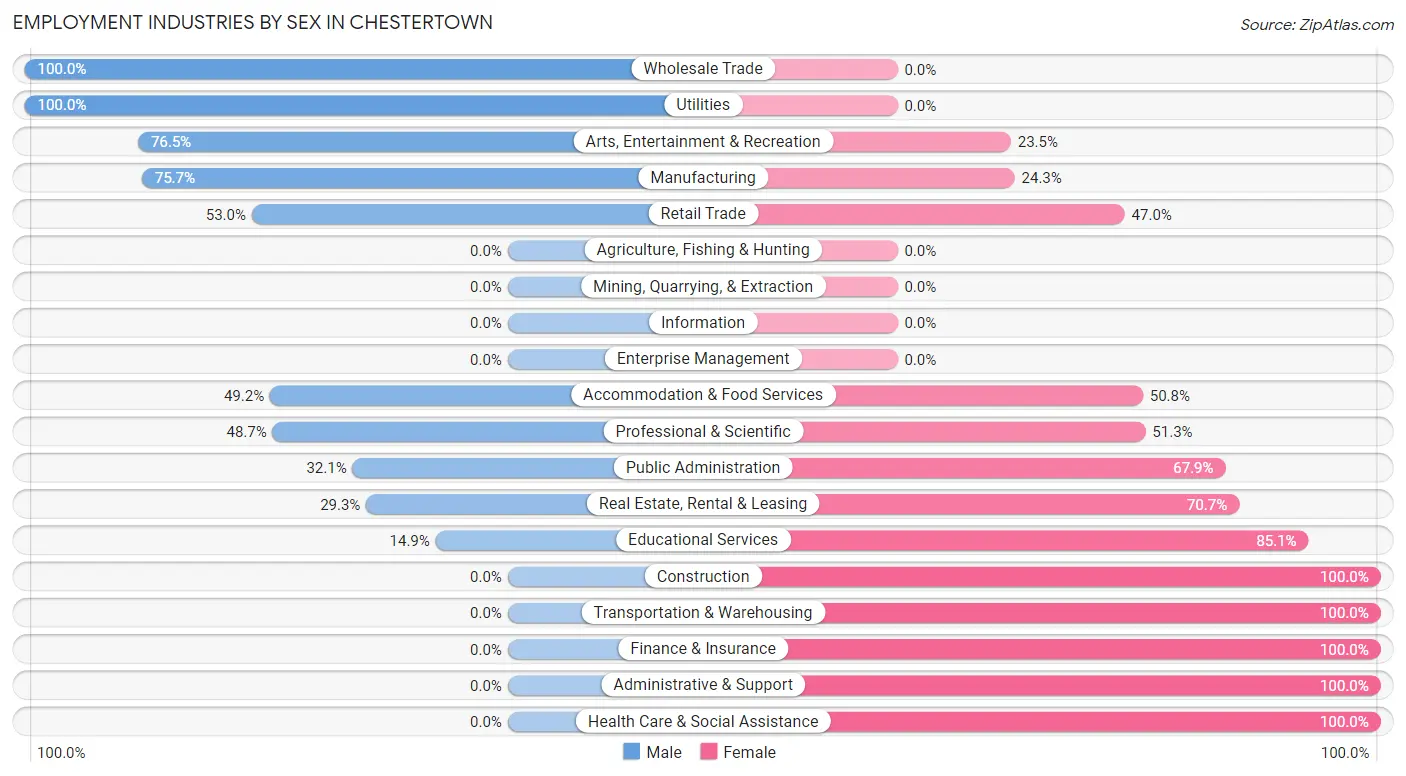
Employment Industries by Sex in Chestertown
The Chestertown industries that see more men than women are Wholesale Trade (100.0%), Utilities (100.0%), and Arts, Entertainment & Recreation (76.5%), whereas the industries that tend to have a higher number of women are Construction (100.0%), Transportation & Warehousing (100.0%), and Finance & Insurance (100.0%).
| Industry | Male | Female |
| Agriculture, Fishing & Hunting | 0 (0.0%) | 0 (0.0%) |
| Mining, Quarrying, & Extraction | 0 (0.0%) | 0 (0.0%) |
| Construction | 0 (0.0%) | 5 (100.0%) |
| Manufacturing | 206 (75.7%) | 66 (24.3%) |
| Wholesale Trade | 74 (100.0%) | 0 (0.0%) |
| Retail Trade | 107 (53.0%) | 95 (47.0%) |
| Transportation & Warehousing | 0 (0.0%) | 21 (100.0%) |
| Utilities | 27 (100.0%) | 0 (0.0%) |
| Information | 0 (0.0%) | 0 (0.0%) |
| Finance & Insurance | 0 (0.0%) | 5 (100.0%) |
| Real Estate, Rental & Leasing | 29 (29.3%) | 70 (70.7%) |
| Professional & Scientific | 55 (48.7%) | 58 (51.3%) |
| Enterprise Management | 0 (0.0%) | 0 (0.0%) |
| Administrative & Support | 0 (0.0%) | 94 (100.0%) |
| Educational Services | 93 (14.9%) | 530 (85.1%) |
| Health Care & Social Assistance | 0 (0.0%) | 92 (100.0%) |
| Arts, Entertainment & Recreation | 75 (76.5%) | 23 (23.5%) |
| Accommodation & Food Services | 62 (49.2%) | 64 (50.8%) |
| Public Administration | 80 (32.1%) | 169 (67.9%) |
| Total | 908 (39.9%) | 1,368 (60.1%) |
Education in Chestertown
School Enrollment in Chestertown
The most common levels of schooling among the 1,992 students in Chestertown are college / undergraduate (1,275 | 64.0%), high school (201 | 10.1%), and nursery / preschool (167 | 8.4%).
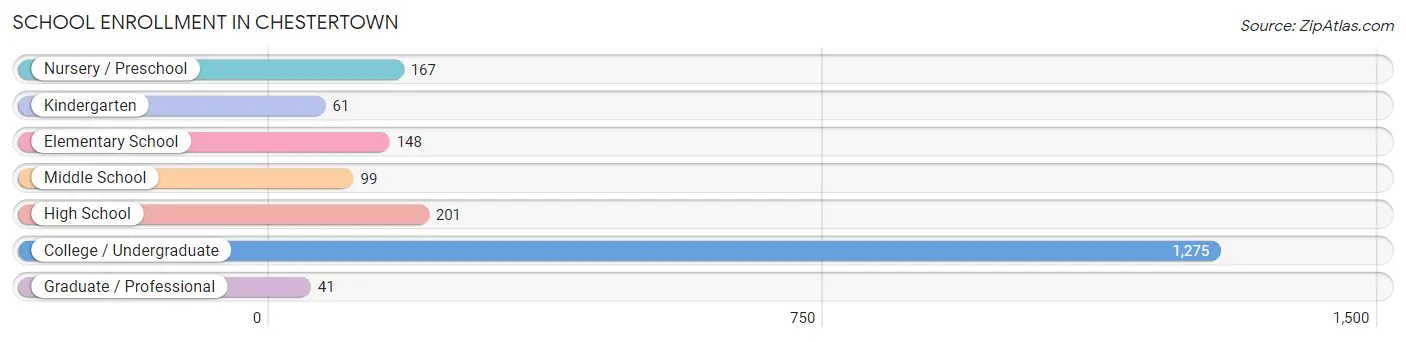
| School Level | # Students | % Students |
| Nursery / Preschool | 167 | 8.4% |
| Kindergarten | 61 | 3.1% |
| Elementary School | 148 | 7.4% |
| Middle School | 99 | 5.0% |
| High School | 201 | 10.1% |
| College / Undergraduate | 1,275 | 64.0% |
| Graduate / Professional | 41 | 2.1% |
| Total | 1,992 | 100.0% |
School Enrollment by Age by Funding Source in Chestertown
Out of a total of 1,992 students who are enrolled in schools in Chestertown, 1,048 (52.6%) attend a private institution, while the remaining 944 (47.4%) are enrolled in public schools. The age group of 25 to 34 year olds has the highest likelihood of being enrolled in private schools, with 41 (100.0% in the age bracket) enrolled. Conversely, the age group of 10 to 14 year olds has the lowest likelihood of being enrolled in a private school, with 101 (100.0% in the age bracket) attending a public institution.
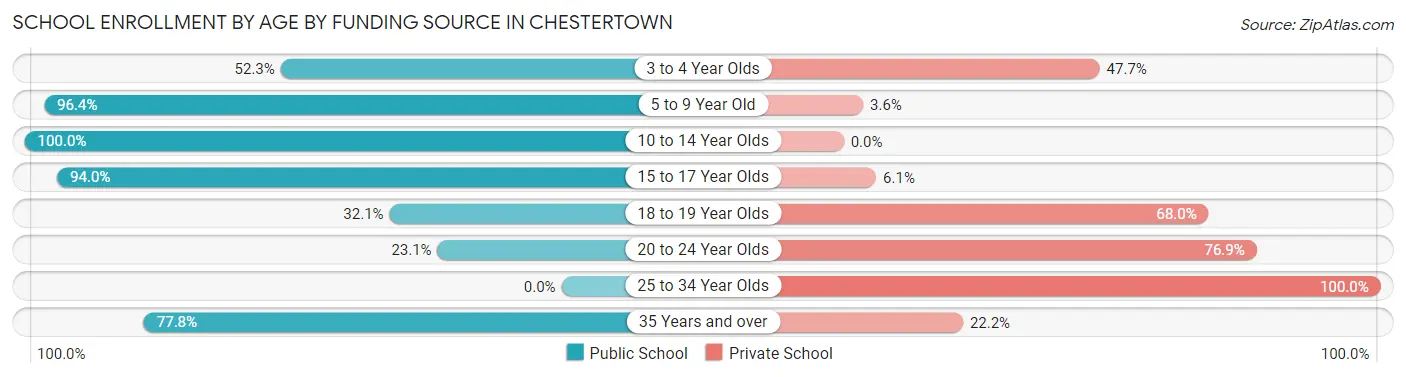
| Age Bracket | Public School | Private School |
| 3 to 4 Year Olds | 79 (52.3%) | 72 (47.7%) |
| 5 to 9 Year Old | 213 (96.4%) | 8 (3.6%) |
| 10 to 14 Year Olds | 101 (100.0%) | 0 (0.0%) |
| 15 to 17 Year Olds | 202 (94.0%) | 13 (6.0%) |
| 18 to 19 Year Olds | 191 (32.1%) | 405 (67.9%) |
| 20 to 24 Year Olds | 152 (23.1%) | 506 (76.9%) |
| 25 to 34 Year Olds | 0 (0.0%) | 41 (100.0%) |
| 35 Years and over | 7 (77.8%) | 2 (22.2%) |
| Total | 944 (47.4%) | 1,048 (52.6%) |
Educational Attainment by Field of Study in Chestertown
Social sciences (269 | 18.2%), business (215 | 14.6%), education (190 | 12.9%), science & technology (121 | 8.2%), and literature & languages (117 | 7.9%) are the most common fields of study among 1,474 individuals in Chestertown who have obtained a bachelor's degree or higher.
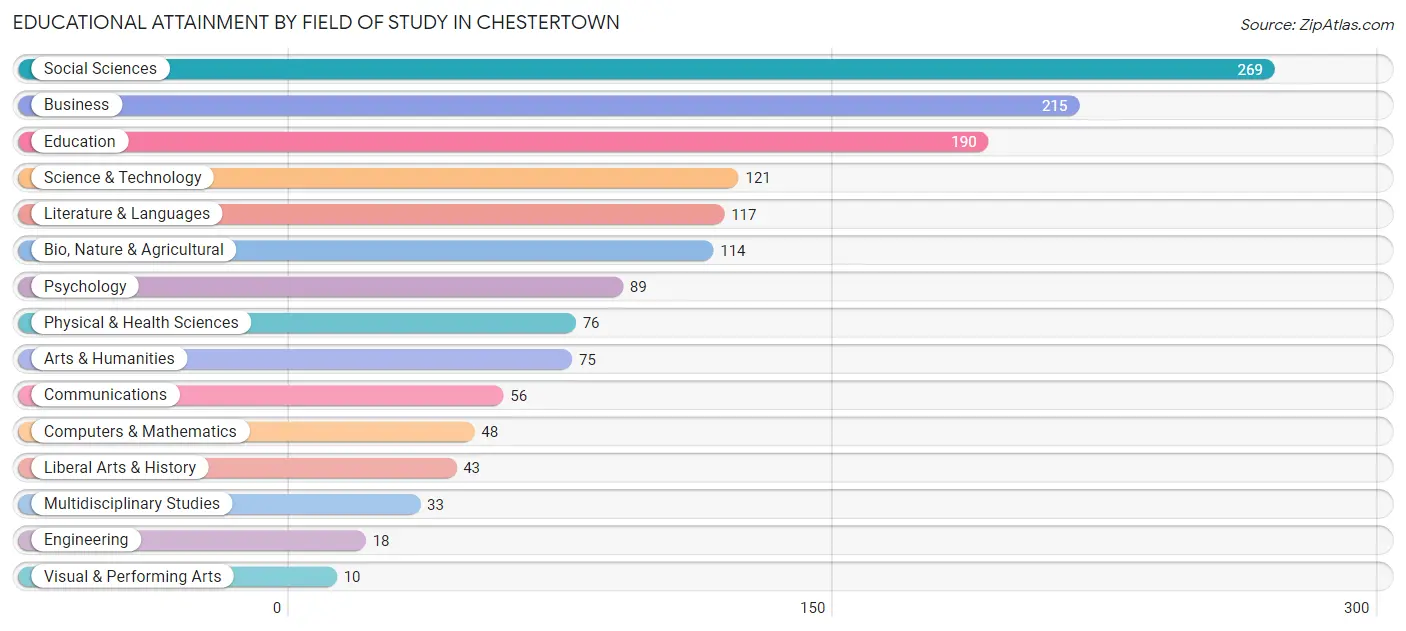
| Field of Study | # Graduates | % Graduates |
| Computers & Mathematics | 48 | 3.3% |
| Bio, Nature & Agricultural | 114 | 7.7% |
| Physical & Health Sciences | 76 | 5.2% |
| Psychology | 89 | 6.0% |
| Social Sciences | 269 | 18.2% |
| Engineering | 18 | 1.2% |
| Multidisciplinary Studies | 33 | 2.2% |
| Science & Technology | 121 | 8.2% |
| Business | 215 | 14.6% |
| Education | 190 | 12.9% |
| Literature & Languages | 117 | 7.9% |
| Liberal Arts & History | 43 | 2.9% |
| Visual & Performing Arts | 10 | 0.7% |
| Communications | 56 | 3.8% |
| Arts & Humanities | 75 | 5.1% |
| Total | 1,474 | 100.0% |
Transportation & Commute in Chestertown
Vehicle Availability by Sex in Chestertown
The most prevalent vehicle ownership categories in Chestertown are males with 1 vehicle (346, accounting for 40.8%) and females with 1 vehicle (358, making up 36.8%).
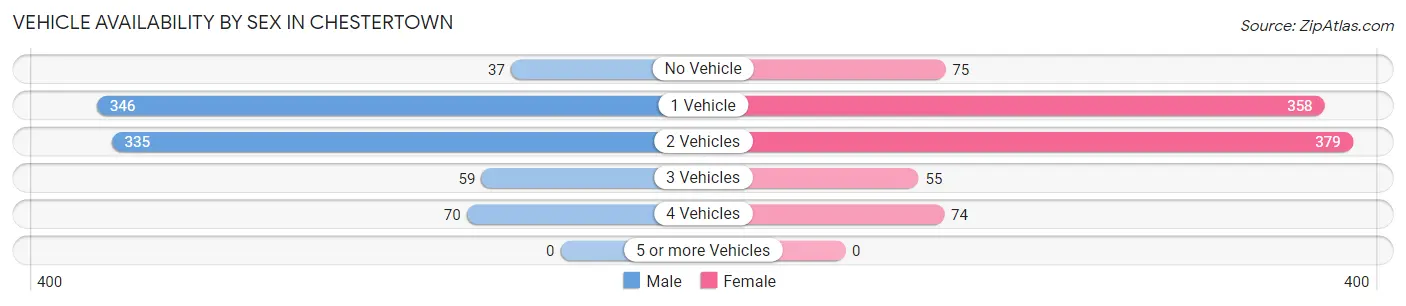
| Vehicles Available | Male | Female |
| No Vehicle | 37 (4.4%) | 75 (8.0%) |
| 1 Vehicle | 346 (40.8%) | 358 (38.0%) |
| 2 Vehicles | 335 (39.6%) | 379 (40.3%) |
| 3 Vehicles | 59 (7.0%) | 55 (5.8%) |
| 4 Vehicles | 70 (8.3%) | 74 (7.9%) |
| 5 or more Vehicles | 0 (0.0%) | 0 (0.0%) |
| Total | 847 (100.0%) | 941 (100.0%) |
Commute Time in Chestertown
The most frequently occuring commute durations in Chestertown are 5 to 9 minutes (833 commuters, 40.4%), 10 to 14 minutes (270 commuters, 13.1%), and 15 to 19 minutes (235 commuters, 11.4%).
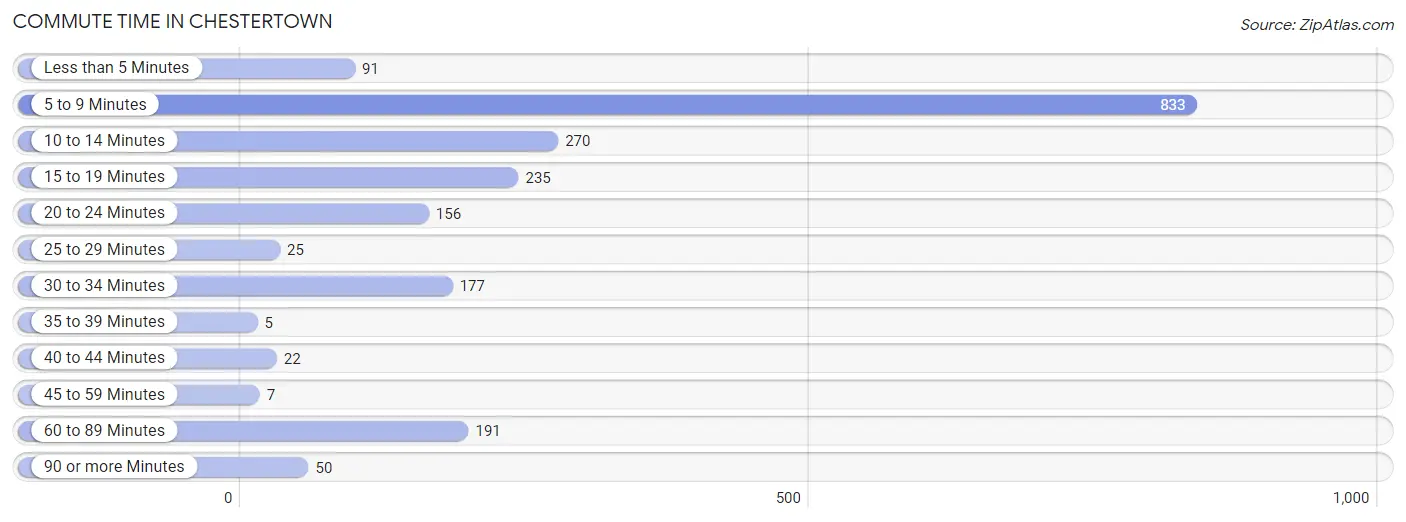
| Commute Time | # Commuters | % Commuters |
| Less than 5 Minutes | 91 | 4.4% |
| 5 to 9 Minutes | 833 | 40.4% |
| 10 to 14 Minutes | 270 | 13.1% |
| 15 to 19 Minutes | 235 | 11.4% |
| 20 to 24 Minutes | 156 | 7.6% |
| 25 to 29 Minutes | 25 | 1.2% |
| 30 to 34 Minutes | 177 | 8.6% |
| 35 to 39 Minutes | 5 | 0.2% |
| 40 to 44 Minutes | 22 | 1.1% |
| 45 to 59 Minutes | 7 | 0.3% |
| 60 to 89 Minutes | 191 | 9.3% |
| 90 or more Minutes | 50 | 2.4% |
Commute Time by Sex in Chestertown
The most common commute times in Chestertown are 5 to 9 minutes (237 commuters, 29.6%) for males and 5 to 9 minutes (596 commuters, 47.2%) for females.
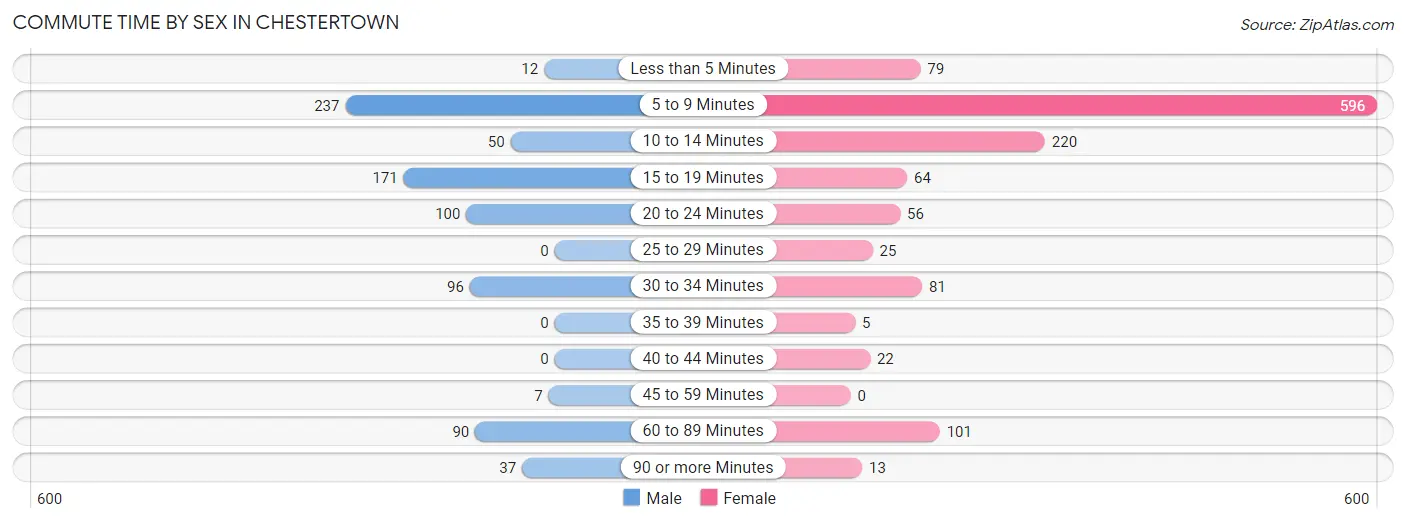
| Commute Time | Male | Female |
| Less than 5 Minutes | 12 (1.5%) | 79 (6.3%) |
| 5 to 9 Minutes | 237 (29.6%) | 596 (47.2%) |
| 10 to 14 Minutes | 50 (6.2%) | 220 (17.4%) |
| 15 to 19 Minutes | 171 (21.4%) | 64 (5.1%) |
| 20 to 24 Minutes | 100 (12.5%) | 56 (4.4%) |
| 25 to 29 Minutes | 0 (0.0%) | 25 (2.0%) |
| 30 to 34 Minutes | 96 (12.0%) | 81 (6.4%) |
| 35 to 39 Minutes | 0 (0.0%) | 5 (0.4%) |
| 40 to 44 Minutes | 0 (0.0%) | 22 (1.7%) |
| 45 to 59 Minutes | 7 (0.9%) | 0 (0.0%) |
| 60 to 89 Minutes | 90 (11.3%) | 101 (8.0%) |
| 90 or more Minutes | 37 (4.6%) | 13 (1.0%) |
Time of Departure to Work by Sex in Chestertown
The most frequent times of departure to work in Chestertown are 12:00 PM to 3:59 PM (161, 20.1%) for males and 12:00 PM to 3:59 PM (233, 18.5%) for females.
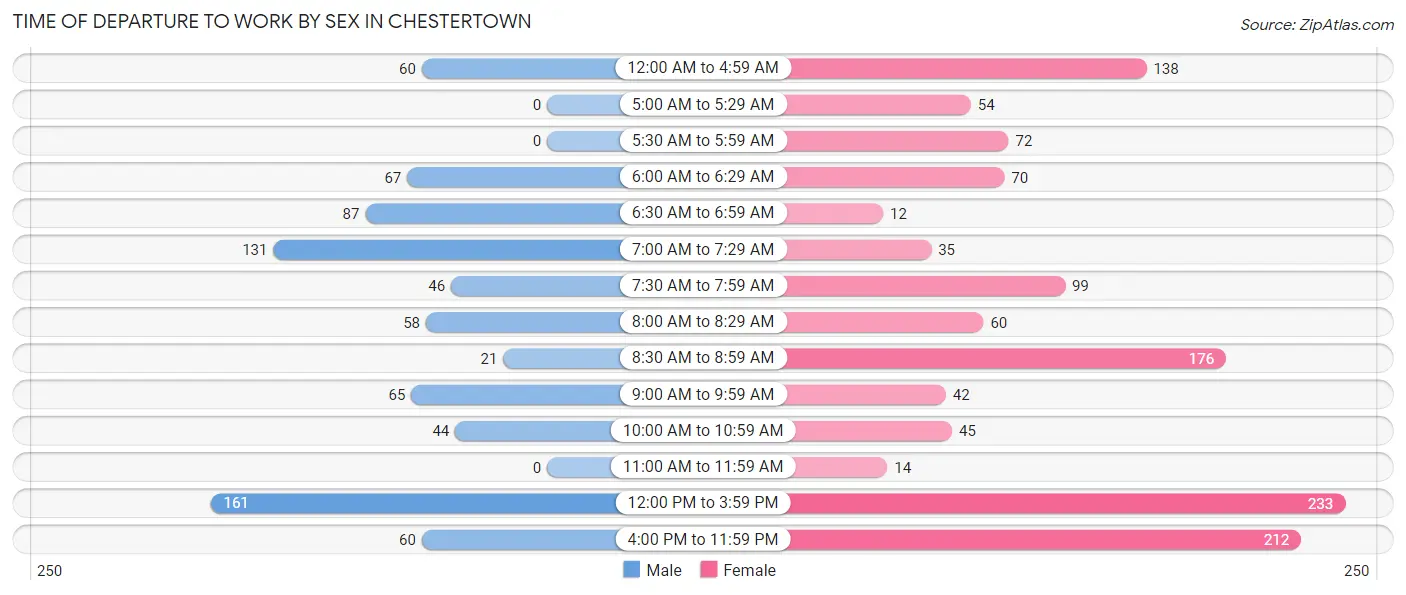
| Time of Departure | Male | Female |
| 12:00 AM to 4:59 AM | 60 (7.5%) | 138 (10.9%) |
| 5:00 AM to 5:29 AM | 0 (0.0%) | 54 (4.3%) |
| 5:30 AM to 5:59 AM | 0 (0.0%) | 72 (5.7%) |
| 6:00 AM to 6:29 AM | 67 (8.4%) | 70 (5.6%) |
| 6:30 AM to 6:59 AM | 87 (10.9%) | 12 (0.9%) |
| 7:00 AM to 7:29 AM | 131 (16.4%) | 35 (2.8%) |
| 7:30 AM to 7:59 AM | 46 (5.8%) | 99 (7.8%) |
| 8:00 AM to 8:29 AM | 58 (7.2%) | 60 (4.8%) |
| 8:30 AM to 8:59 AM | 21 (2.6%) | 176 (14.0%) |
| 9:00 AM to 9:59 AM | 65 (8.1%) | 42 (3.3%) |
| 10:00 AM to 10:59 AM | 44 (5.5%) | 45 (3.6%) |
| 11:00 AM to 11:59 AM | 0 (0.0%) | 14 (1.1%) |
| 12:00 PM to 3:59 PM | 161 (20.1%) | 233 (18.5%) |
| 4:00 PM to 11:59 PM | 60 (7.5%) | 212 (16.8%) |
| Total | 800 (100.0%) | 1,262 (100.0%) |
Housing Occupancy in Chestertown
Occupancy by Ownership in Chestertown
Of the total 2,306 dwellings in Chestertown, owner-occupied units account for 1,087 (47.1%), while renter-occupied units make up 1,219 (52.9%).
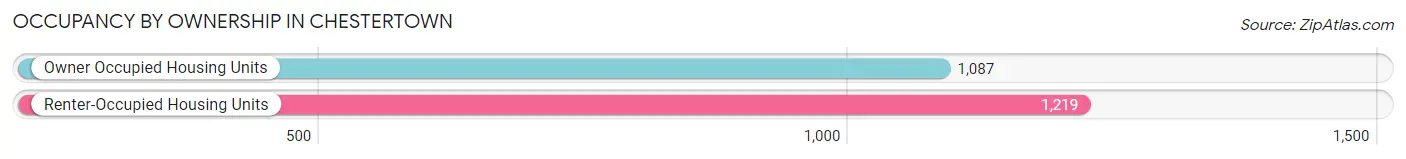
| Occupancy | # Housing Units | % Housing Units |
| Owner Occupied Housing Units | 1,087 | 47.1% |
| Renter-Occupied Housing Units | 1,219 | 52.9% |
| Total Occupied Housing Units | 2,306 | 100.0% |
Occupancy by Household Size in Chestertown
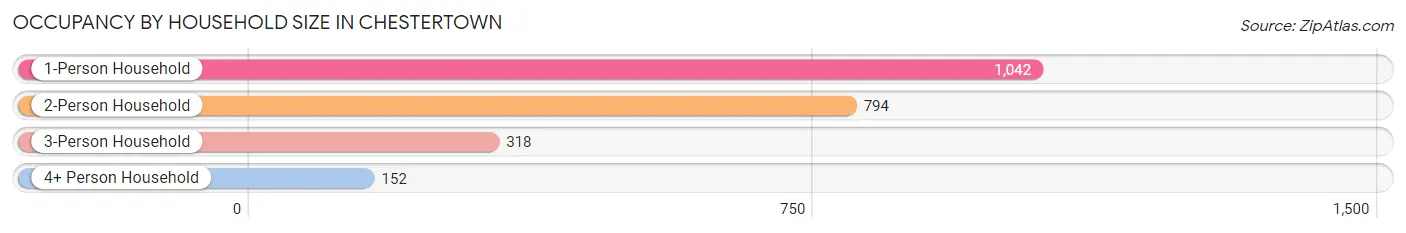
| Household Size | # Housing Units | % Housing Units |
| 1-Person Household | 1,042 | 45.2% |
| 2-Person Household | 794 | 34.4% |
| 3-Person Household | 318 | 13.8% |
| 4+ Person Household | 152 | 6.6% |
| Total Housing Units | 2,306 | 100.0% |
Occupancy by Ownership by Household Size in Chestertown
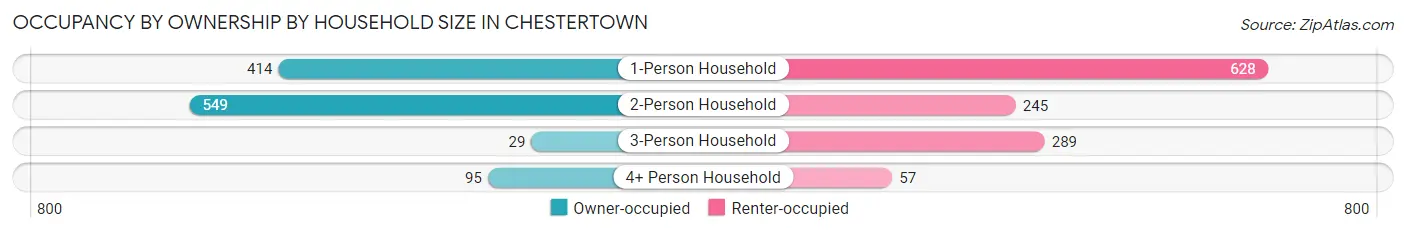
| Household Size | Owner-occupied | Renter-occupied |
| 1-Person Household | 414 (39.7%) | 628 (60.3%) |
| 2-Person Household | 549 (69.1%) | 245 (30.9%) |
| 3-Person Household | 29 (9.1%) | 289 (90.9%) |
| 4+ Person Household | 95 (62.5%) | 57 (37.5%) |
| Total Housing Units | 1,087 (47.1%) | 1,219 (52.9%) |
Occupancy by Educational Attainment in Chestertown
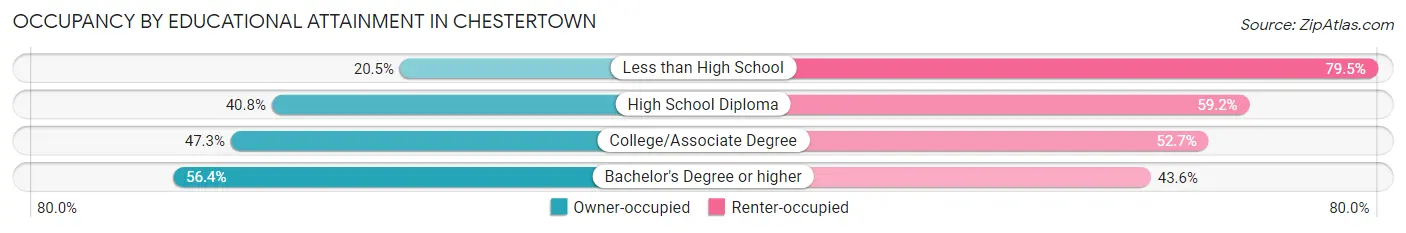
| Household Size | Owner-occupied | Renter-occupied |
| Less than High School | 42 (20.5%) | 163 (79.5%) |
| High School Diploma | 235 (40.8%) | 341 (59.2%) |
| College/Associate Degree | 262 (47.3%) | 292 (52.7%) |
| Bachelor's Degree or higher | 548 (56.4%) | 423 (43.6%) |
Occupancy by Age of Householder in Chestertown
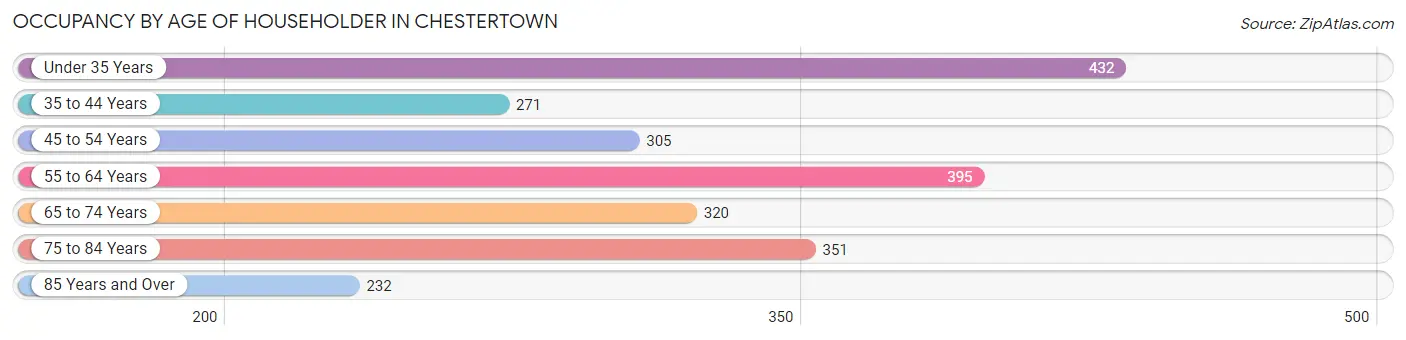
| Age Bracket | # Households | % Households |
| Under 35 Years | 432 | 18.7% |
| 35 to 44 Years | 271 | 11.7% |
| 45 to 54 Years | 305 | 13.2% |
| 55 to 64 Years | 395 | 17.1% |
| 65 to 74 Years | 320 | 13.9% |
| 75 to 84 Years | 351 | 15.2% |
| 85 Years and Over | 232 | 10.1% |
| Total | 2,306 | 100.0% |
Housing Finances in Chestertown
Median Income by Occupancy in Chestertown
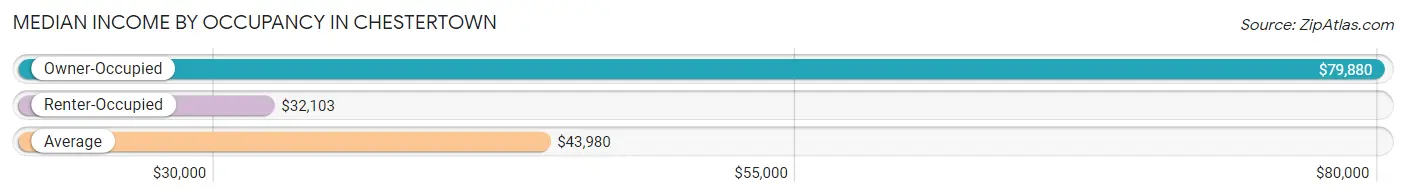
| Occupancy Type | # Households | Median Income |
| Owner-Occupied | 1,087 (47.1%) | $79,880 |
| Renter-Occupied | 1,219 (52.9%) | $32,103 |
| Average | 2,306 (100.0%) | $43,980 |
Occupancy by Householder Income Bracket in Chestertown
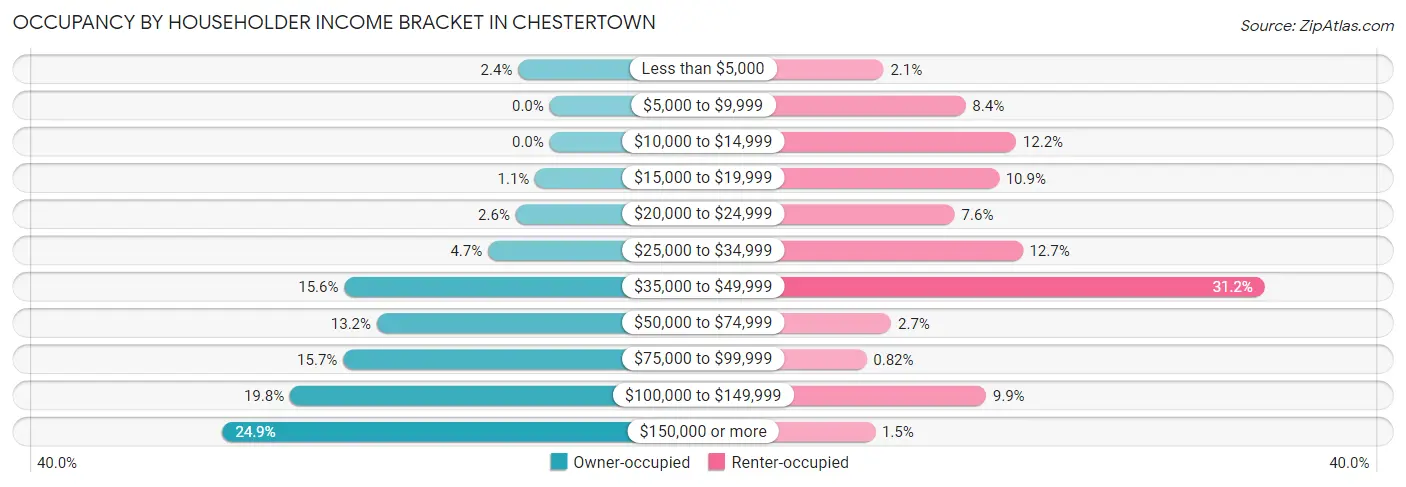
| Income Bracket | Owner-occupied | Renter-occupied |
| Less than $5,000 | 26 (2.4%) | 26 (2.1%) |
| $5,000 to $9,999 | 0 (0.0%) | 102 (8.4%) |
| $10,000 to $14,999 | 0 (0.0%) | 149 (12.2%) |
| $15,000 to $19,999 | 12 (1.1%) | 133 (10.9%) |
| $20,000 to $24,999 | 28 (2.6%) | 92 (7.5%) |
| $25,000 to $34,999 | 51 (4.7%) | 155 (12.7%) |
| $35,000 to $49,999 | 170 (15.6%) | 380 (31.2%) |
| $50,000 to $74,999 | 143 (13.2%) | 33 (2.7%) |
| $75,000 to $99,999 | 171 (15.7%) | 10 (0.8%) |
| $100,000 to $149,999 | 215 (19.8%) | 121 (9.9%) |
| $150,000 or more | 271 (24.9%) | 18 (1.5%) |
| Total | 1,087 (100.0%) | 1,219 (100.0%) |
Monthly Housing Cost Tiers in Chestertown
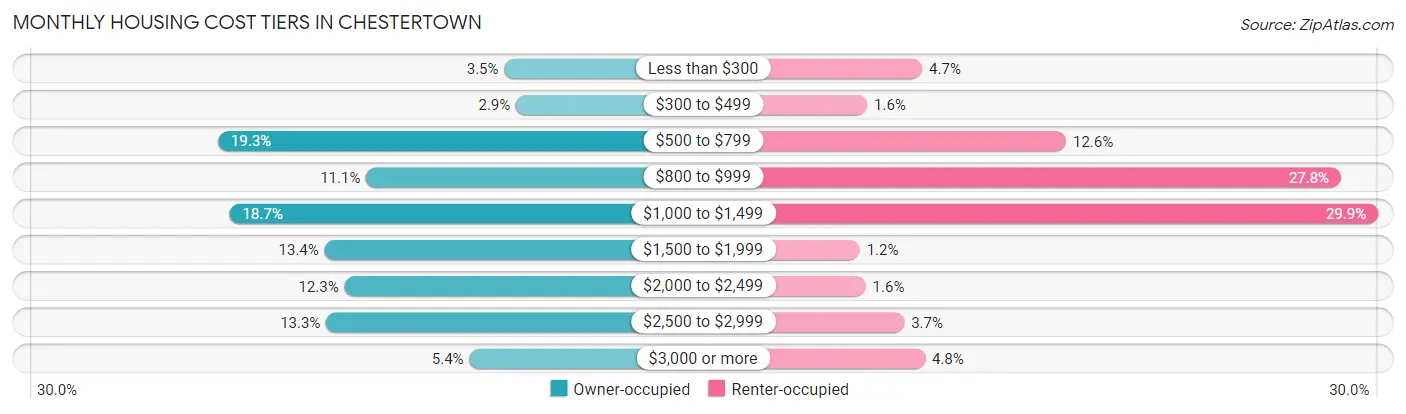
| Monthly Cost | Owner-occupied | Renter-occupied |
| Less than $300 | 38 (3.5%) | 57 (4.7%) |
| $300 to $499 | 31 (2.9%) | 20 (1.6%) |
| $500 to $799 | 210 (19.3%) | 154 (12.6%) |
| $800 to $999 | 121 (11.1%) | 339 (27.8%) |
| $1,000 to $1,499 | 203 (18.7%) | 364 (29.9%) |
| $1,500 to $1,999 | 146 (13.4%) | 15 (1.2%) |
| $2,000 to $2,499 | 134 (12.3%) | 19 (1.6%) |
| $2,500 to $2,999 | 145 (13.3%) | 45 (3.7%) |
| $3,000 or more | 59 (5.4%) | 59 (4.8%) |
| Total | 1,087 (100.0%) | 1,219 (100.0%) |
Physical Housing Characteristics in Chestertown
Housing Structures in Chestertown
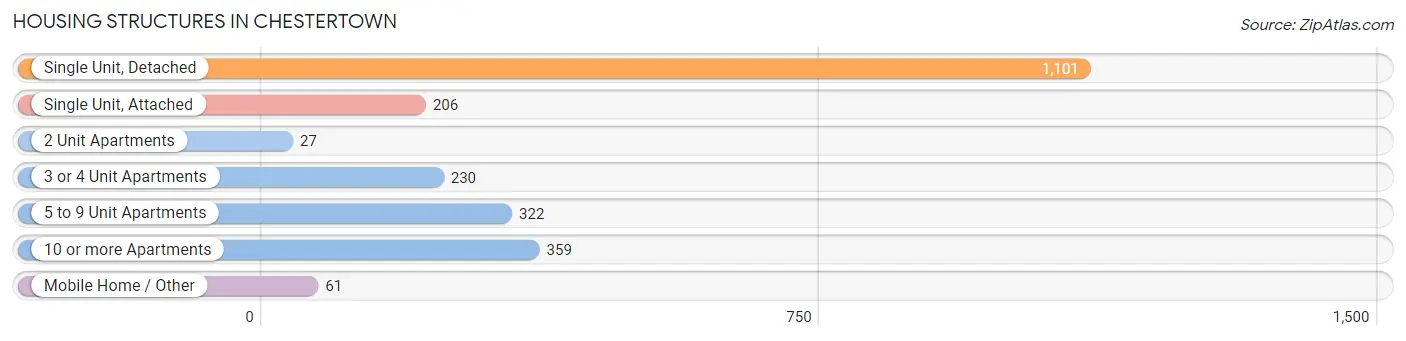
| Structure Type | # Housing Units | % Housing Units |
| Single Unit, Detached | 1,101 | 47.7% |
| Single Unit, Attached | 206 | 8.9% |
| 2 Unit Apartments | 27 | 1.2% |
| 3 or 4 Unit Apartments | 230 | 10.0% |
| 5 to 9 Unit Apartments | 322 | 14.0% |
| 10 or more Apartments | 359 | 15.6% |
| Mobile Home / Other | 61 | 2.6% |
| Total | 2,306 | 100.0% |
Housing Structures by Occupancy in Chestertown
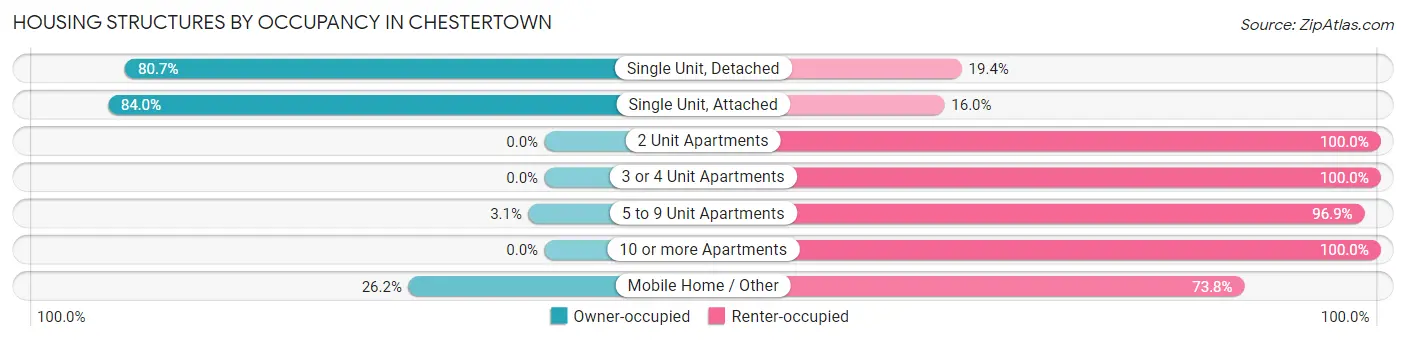
| Structure Type | Owner-occupied | Renter-occupied |
| Single Unit, Detached | 888 (80.6%) | 213 (19.4%) |
| Single Unit, Attached | 173 (84.0%) | 33 (16.0%) |
| 2 Unit Apartments | 0 (0.0%) | 27 (100.0%) |
| 3 or 4 Unit Apartments | 0 (0.0%) | 230 (100.0%) |
| 5 to 9 Unit Apartments | 10 (3.1%) | 312 (96.9%) |
| 10 or more Apartments | 0 (0.0%) | 359 (100.0%) |
| Mobile Home / Other | 16 (26.2%) | 45 (73.8%) |
| Total | 1,087 (47.1%) | 1,219 (52.9%) |
Housing Structures by Number of Rooms in Chestertown
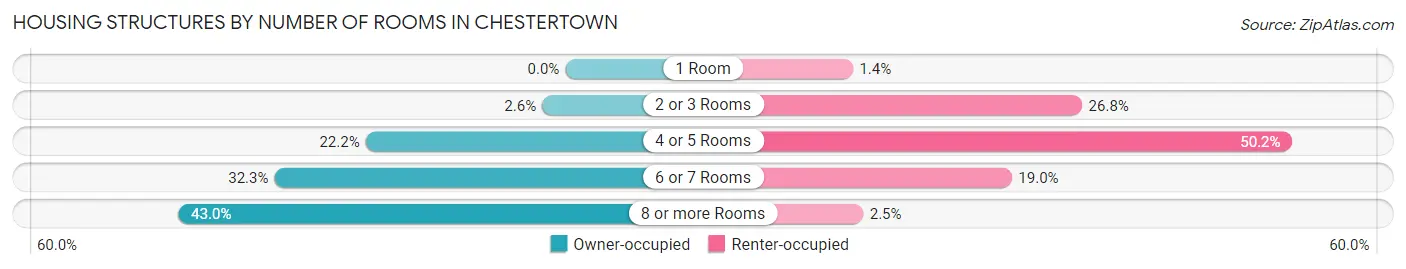
| Number of Rooms | Owner-occupied | Renter-occupied |
| 1 Room | 0 (0.0%) | 17 (1.4%) |
| 2 or 3 Rooms | 28 (2.6%) | 327 (26.8%) |
| 4 or 5 Rooms | 241 (22.2%) | 612 (50.2%) |
| 6 or 7 Rooms | 351 (32.3%) | 232 (19.0%) |
| 8 or more Rooms | 467 (43.0%) | 31 (2.5%) |
| Total | 1,087 (100.0%) | 1,219 (100.0%) |
Housing Structure by Heating Type in Chestertown
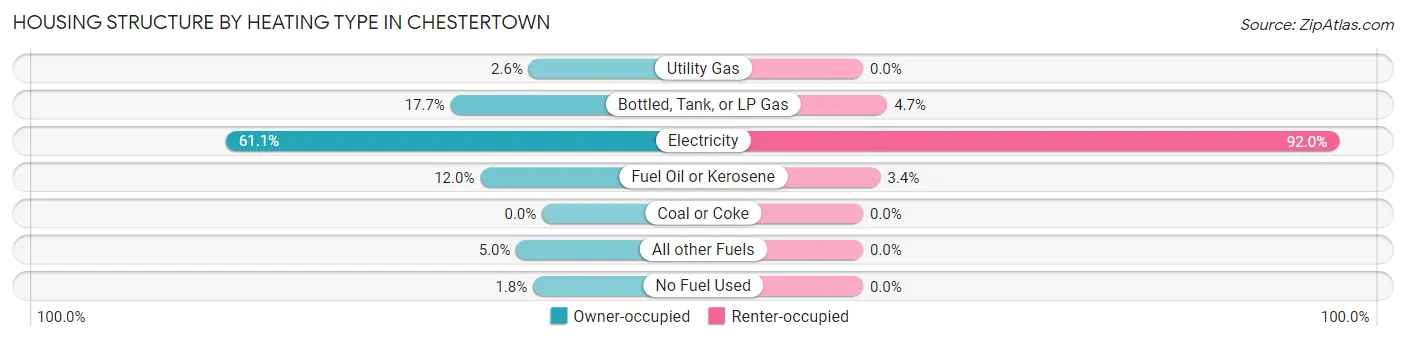
| Heating Type | Owner-occupied | Renter-occupied |
| Utility Gas | 28 (2.6%) | 0 (0.0%) |
| Bottled, Tank, or LP Gas | 192 (17.7%) | 57 (4.7%) |
| Electricity | 664 (61.1%) | 1,121 (92.0%) |
| Fuel Oil or Kerosene | 130 (12.0%) | 41 (3.4%) |
| Coal or Coke | 0 (0.0%) | 0 (0.0%) |
| All other Fuels | 54 (5.0%) | 0 (0.0%) |
| No Fuel Used | 19 (1.8%) | 0 (0.0%) |
| Total | 1,087 (100.0%) | 1,219 (100.0%) |
Household Vehicle Usage in Chestertown
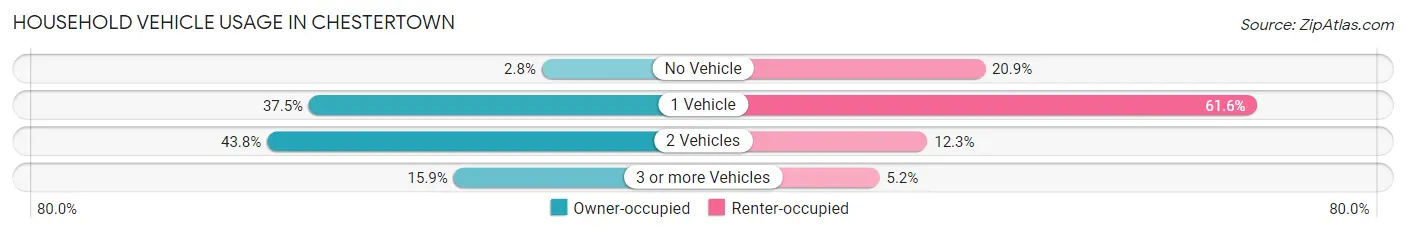
| Vehicles per Household | Owner-occupied | Renter-occupied |
| No Vehicle | 30 (2.8%) | 255 (20.9%) |
| 1 Vehicle | 408 (37.5%) | 751 (61.6%) |
| 2 Vehicles | 476 (43.8%) | 150 (12.3%) |
| 3 or more Vehicles | 173 (15.9%) | 63 (5.2%) |
| Total | 1,087 (100.0%) | 1,219 (100.0%) |
Real Estate & Mortgages in Chestertown
Real Estate and Mortgage Overview in Chestertown
| Characteristic | Without Mortgage | With Mortgage |
| Housing Units | 374 | 713 |
| Median Property Value | $285,400 | $314,800 |
| Median Household Income | $83,088 | $202 |
| Monthly Housing Costs | $708 | $59 |
| Real Estate Taxes | $3,759 | $0 |
Property Value by Mortgage Status in Chestertown
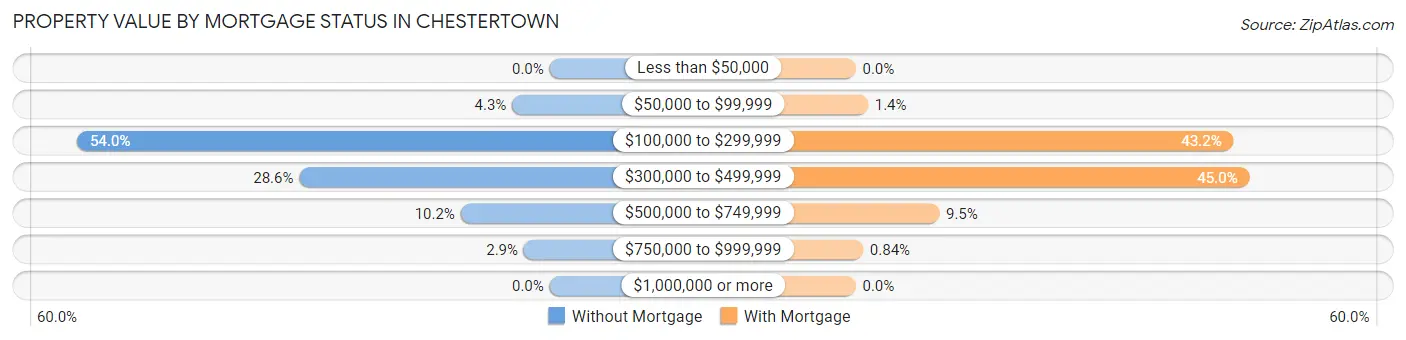
| Property Value | Without Mortgage | With Mortgage |
| Less than $50,000 | 0 (0.0%) | 0 (0.0%) |
| $50,000 to $99,999 | 16 (4.3%) | 10 (1.4%) |
| $100,000 to $299,999 | 202 (54.0%) | 308 (43.2%) |
| $300,000 to $499,999 | 107 (28.6%) | 321 (45.0%) |
| $500,000 to $749,999 | 38 (10.2%) | 68 (9.5%) |
| $750,000 to $999,999 | 11 (2.9%) | 6 (0.8%) |
| $1,000,000 or more | 0 (0.0%) | 0 (0.0%) |
| Total | 374 (100.0%) | 713 (100.0%) |
Household Income by Mortgage Status in Chestertown
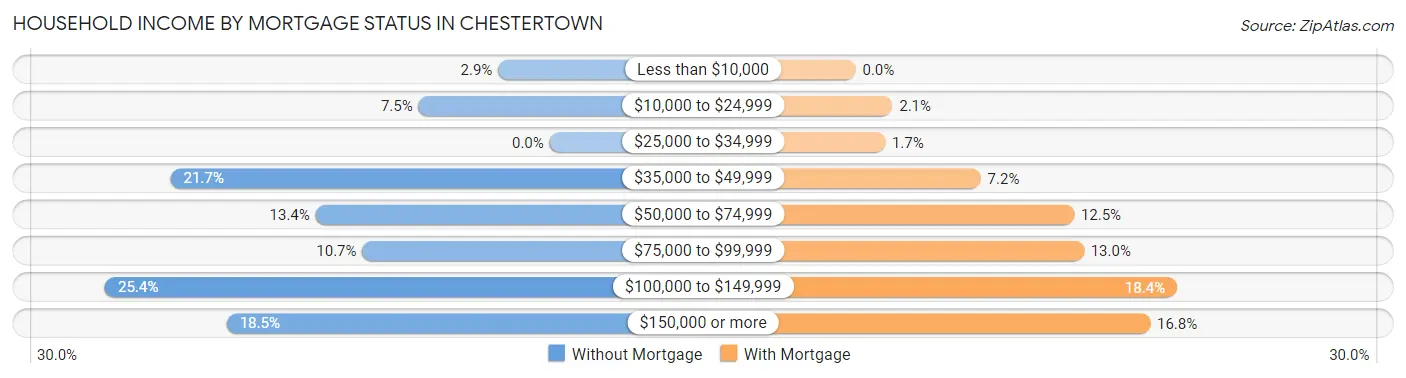
| Household Income | Without Mortgage | With Mortgage |
| Less than $10,000 | 11 (2.9%) | 0 (0.0%) |
| $10,000 to $24,999 | 28 (7.5%) | 15 (2.1%) |
| $25,000 to $34,999 | 0 (0.0%) | 12 (1.7%) |
| $35,000 to $49,999 | 81 (21.7%) | 51 (7.1%) |
| $50,000 to $74,999 | 50 (13.4%) | 89 (12.5%) |
| $75,000 to $99,999 | 40 (10.7%) | 93 (13.0%) |
| $100,000 to $149,999 | 95 (25.4%) | 131 (18.4%) |
| $150,000 or more | 69 (18.4%) | 120 (16.8%) |
| Total | 374 (100.0%) | 713 (100.0%) |
Property Value to Household Income Ratio in Chestertown
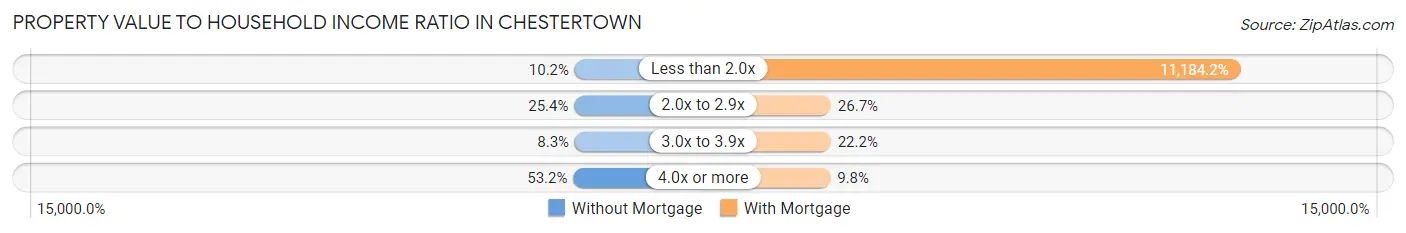
| Value-to-Income Ratio | Without Mortgage | With Mortgage |
| Less than 2.0x | 38 (10.2%) | 79,743 (11,184.1%) |
| 2.0x to 2.9x | 95 (25.4%) | 190 (26.7%) |
| 3.0x to 3.9x | 31 (8.3%) | 158 (22.2%) |
| 4.0x or more | 199 (53.2%) | 70 (9.8%) |
| Total | 374 (100.0%) | 713 (100.0%) |
Real Estate Taxes by Mortgage Status in Chestertown
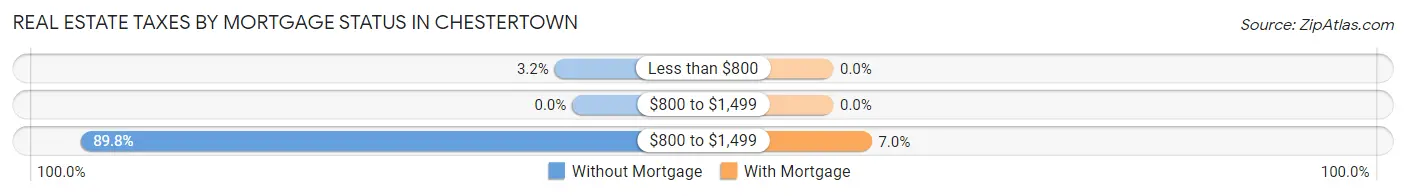
| Property Taxes | Without Mortgage | With Mortgage |
| Less than $800 | 12 (3.2%) | 0 (0.0%) |
| $800 to $1,499 | 0 (0.0%) | 0 (0.0%) |
| $800 to $1,499 | 336 (89.8%) | 50 (7.0%) |
| Total | 374 (100.0%) | 713 (100.0%) |
Health & Disability in Chestertown
Health Insurance Coverage by Age in Chestertown
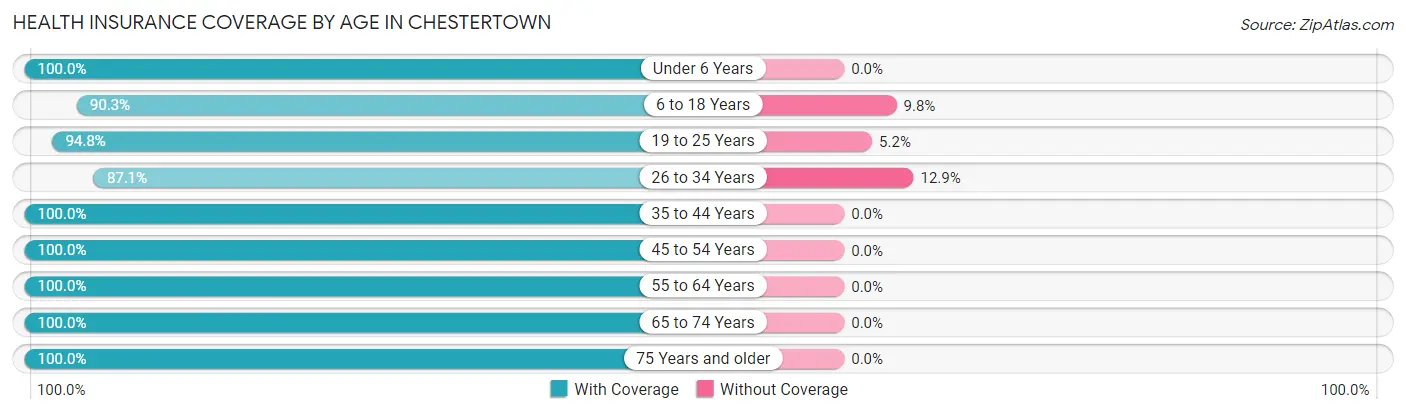
| Age Bracket | With Coverage | Without Coverage |
| Under 6 Years | 317 (100.0%) | 0 (0.0%) |
| 6 to 18 Years | 611 (90.2%) | 66 (9.8%) |
| 19 to 25 Years | 1,277 (94.8%) | 70 (5.2%) |
| 26 to 34 Years | 391 (87.1%) | 58 (12.9%) |
| 35 to 44 Years | 295 (100.0%) | 0 (0.0%) |
| 45 to 54 Years | 396 (100.0%) | 0 (0.0%) |
| 55 to 64 Years | 503 (100.0%) | 0 (0.0%) |
| 65 to 74 Years | 506 (100.0%) | 0 (0.0%) |
| 75 Years and older | 772 (100.0%) | 0 (0.0%) |
| Total | 5,068 (96.3%) | 194 (3.7%) |
Health Insurance Coverage by Citizenship Status in Chestertown
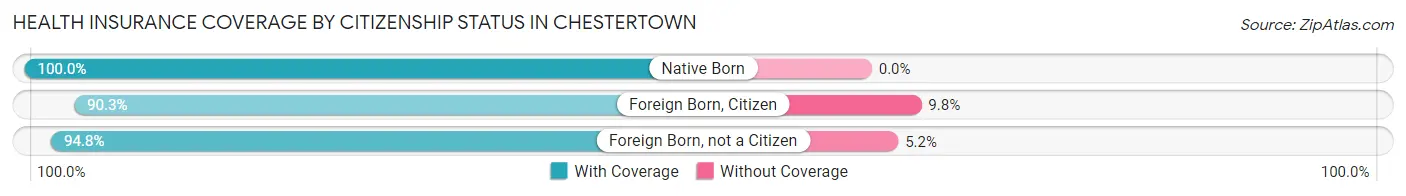
| Citizenship Status | With Coverage | Without Coverage |
| Native Born | 317 (100.0%) | 0 (0.0%) |
| Foreign Born, Citizen | 611 (90.2%) | 66 (9.8%) |
| Foreign Born, not a Citizen | 1,277 (94.8%) | 70 (5.2%) |
Health Insurance Coverage by Household Income in Chestertown
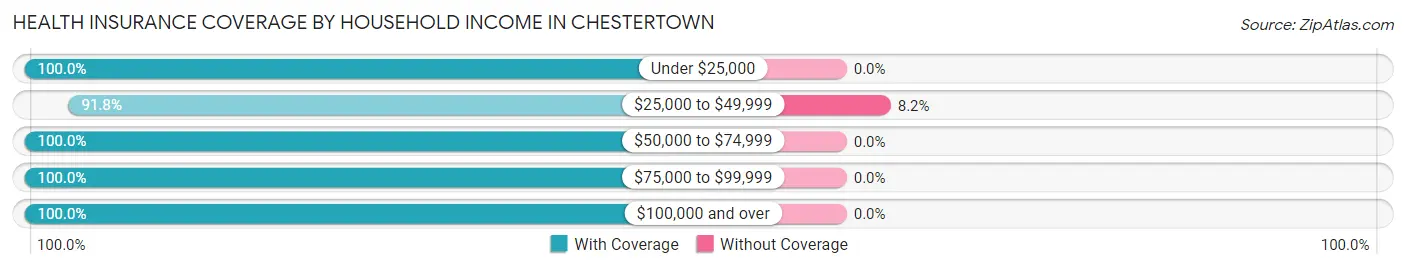
| Household Income | With Coverage | Without Coverage |
| Under $25,000 | 928 (100.0%) | 0 (0.0%) |
| $25,000 to $49,999 | 1,036 (91.8%) | 93 (8.2%) |
| $50,000 to $74,999 | 359 (100.0%) | 0 (0.0%) |
| $75,000 to $99,999 | 336 (100.0%) | 0 (0.0%) |
| $100,000 and over | 1,352 (100.0%) | 0 (0.0%) |
Public vs Private Health Insurance Coverage by Age in Chestertown
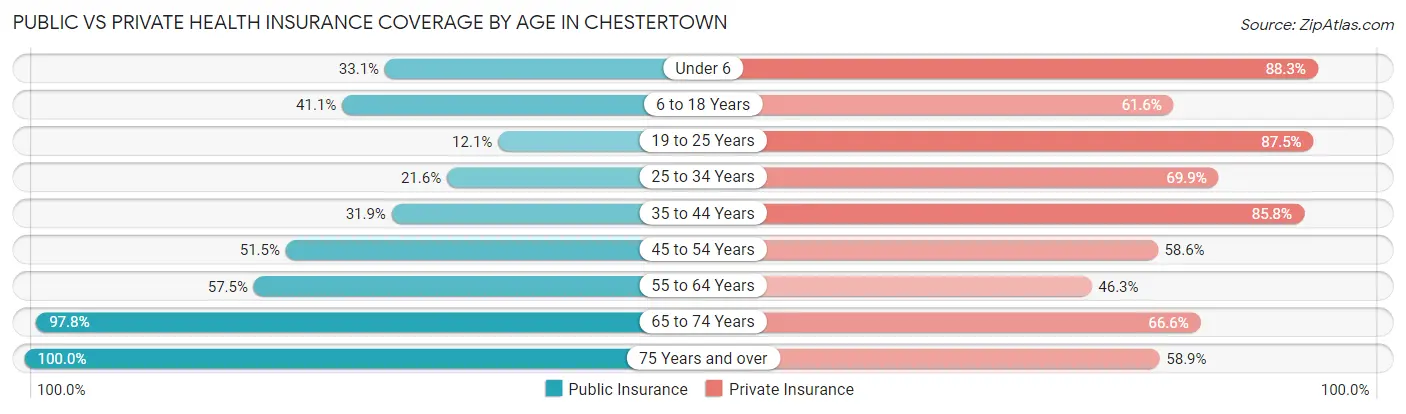
| Age Bracket | Public Insurance | Private Insurance |
| Under 6 | 105 (33.1%) | 280 (88.3%) |
| 6 to 18 Years | 278 (41.1%) | 417 (61.6%) |
| 19 to 25 Years | 163 (12.1%) | 1,179 (87.5%) |
| 25 to 34 Years | 97 (21.6%) | 314 (69.9%) |
| 35 to 44 Years | 94 (31.9%) | 253 (85.8%) |
| 45 to 54 Years | 204 (51.5%) | 232 (58.6%) |
| 55 to 64 Years | 289 (57.5%) | 233 (46.3%) |
| 65 to 74 Years | 495 (97.8%) | 337 (66.6%) |
| 75 Years and over | 772 (100.0%) | 455 (58.9%) |
| Total | 2,497 (47.4%) | 3,700 (70.3%) |
Disability Status by Sex by Age in Chestertown
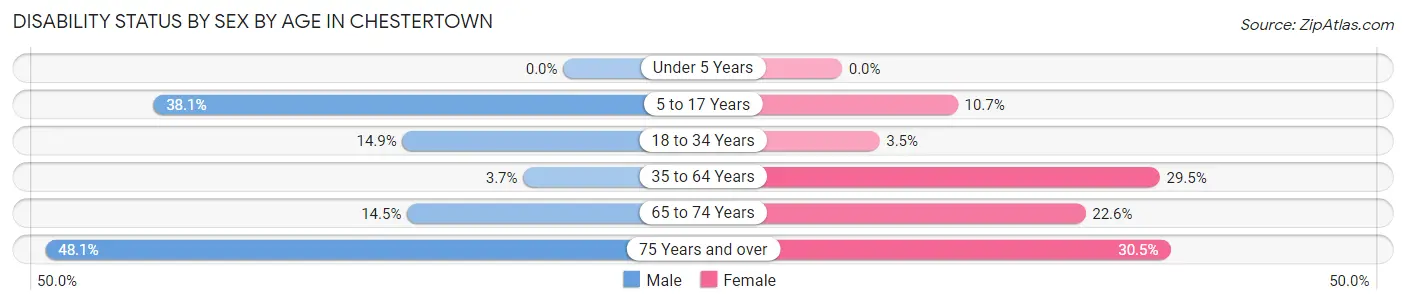
| Age Bracket | Male | Female |
| Under 5 Years | 0 (0.0%) | 0 (0.0%) |
| 5 to 17 Years | 145 (38.1%) | 16 (10.7%) |
| 18 to 34 Years | 117 (14.9%) | 43 (3.5%) |
| 35 to 64 Years | 16 (3.7%) | 225 (29.5%) |
| 65 to 74 Years | 31 (14.5%) | 66 (22.6%) |
| 75 Years and over | 163 (48.1%) | 132 (30.5%) |
Disability Class by Sex by Age in Chestertown
Disability Class: Hearing Difficulty
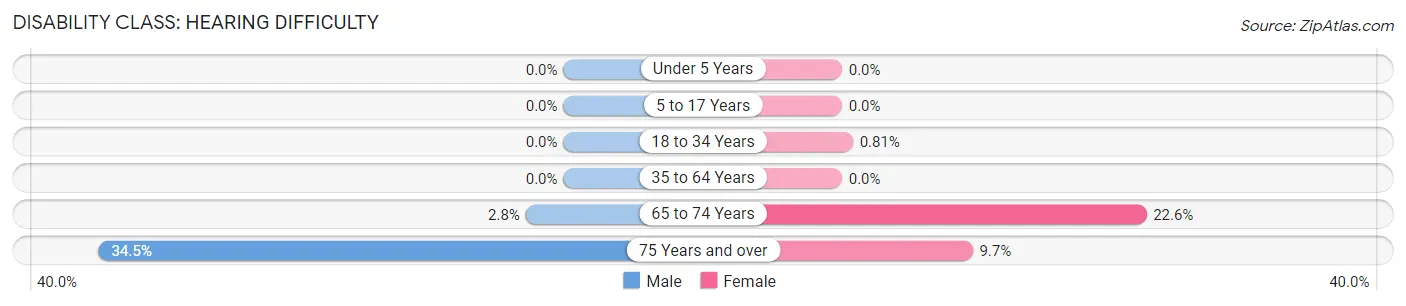
| Age Bracket | Male | Female |
| Under 5 Years | 0 (0.0%) | 0 (0.0%) |
| 5 to 17 Years | 0 (0.0%) | 0 (0.0%) |
| 18 to 34 Years | 0 (0.0%) | 10 (0.8%) |
| 35 to 64 Years | 0 (0.0%) | 0 (0.0%) |
| 65 to 74 Years | 6 (2.8%) | 66 (22.6%) |
| 75 Years and over | 117 (34.5%) | 42 (9.7%) |
Disability Class: Vision Difficulty
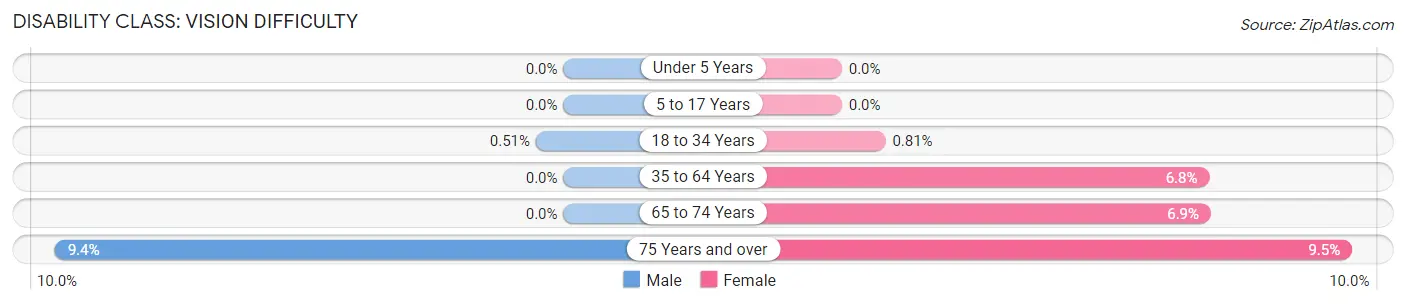
| Age Bracket | Male | Female |
| Under 5 Years | 0 (0.0%) | 0 (0.0%) |
| 5 to 17 Years | 0 (0.0%) | 0 (0.0%) |
| 18 to 34 Years | 4 (0.5%) | 10 (0.8%) |
| 35 to 64 Years | 0 (0.0%) | 52 (6.8%) |
| 65 to 74 Years | 0 (0.0%) | 20 (6.9%) |
| 75 Years and over | 32 (9.4%) | 41 (9.5%) |
Disability Class: Cognitive Difficulty
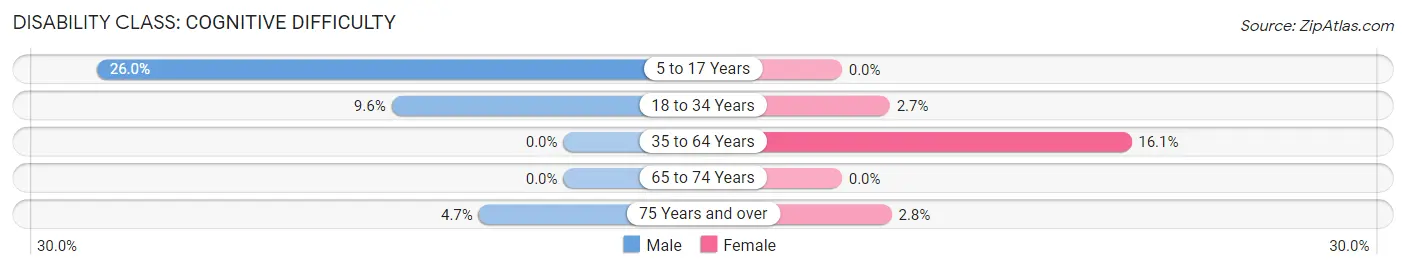
| Age Bracket | Male | Female |
| 5 to 17 Years | 99 (26.0%) | 0 (0.0%) |
| 18 to 34 Years | 75 (9.6%) | 33 (2.7%) |
| 35 to 64 Years | 0 (0.0%) | 123 (16.1%) |
| 65 to 74 Years | 0 (0.0%) | 0 (0.0%) |
| 75 Years and over | 16 (4.7%) | 12 (2.8%) |
Disability Class: Ambulatory Difficulty
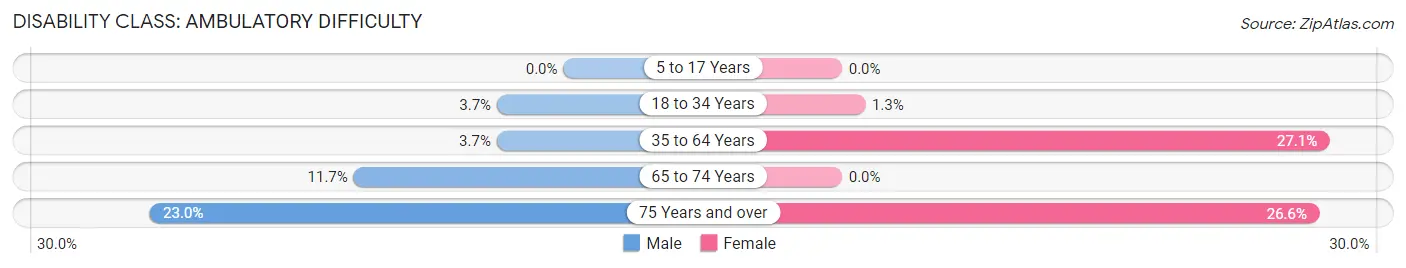
| Age Bracket | Male | Female |
| 5 to 17 Years | 0 (0.0%) | 0 (0.0%) |
| 18 to 34 Years | 29 (3.7%) | 16 (1.3%) |
| 35 to 64 Years | 16 (3.7%) | 207 (27.1%) |
| 65 to 74 Years | 25 (11.7%) | 0 (0.0%) |
| 75 Years and over | 78 (23.0%) | 115 (26.6%) |
Disability Class: Self-Care Difficulty
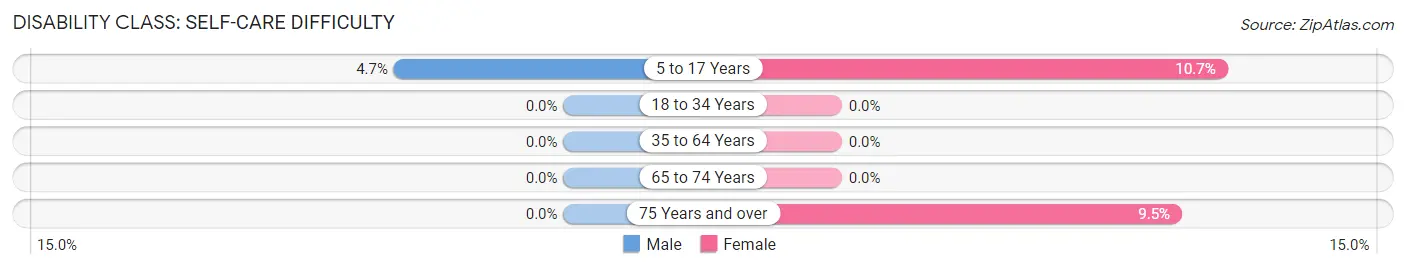
| Age Bracket | Male | Female |
| 5 to 17 Years | 18 (4.7%) | 16 (10.7%) |
| 18 to 34 Years | 0 (0.0%) | 0 (0.0%) |
| 35 to 64 Years | 0 (0.0%) | 0 (0.0%) |
| 65 to 74 Years | 0 (0.0%) | 0 (0.0%) |
| 75 Years and over | 0 (0.0%) | 41 (9.5%) |
Technology Access in Chestertown
Computing Device Access in Chestertown
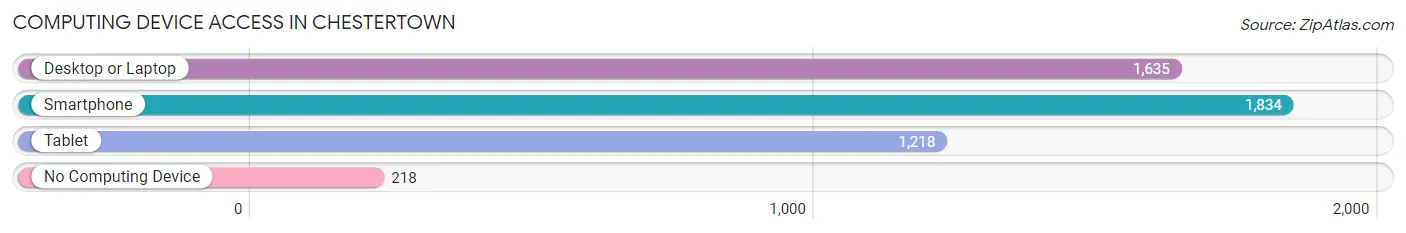
| Device Type | # Households | % Households |
| Desktop or Laptop | 1,635 | 70.9% |
| Smartphone | 1,834 | 79.5% |
| Tablet | 1,218 | 52.8% |
| No Computing Device | 218 | 9.5% |
| Total | 2,306 | 100.0% |
Internet Access in Chestertown
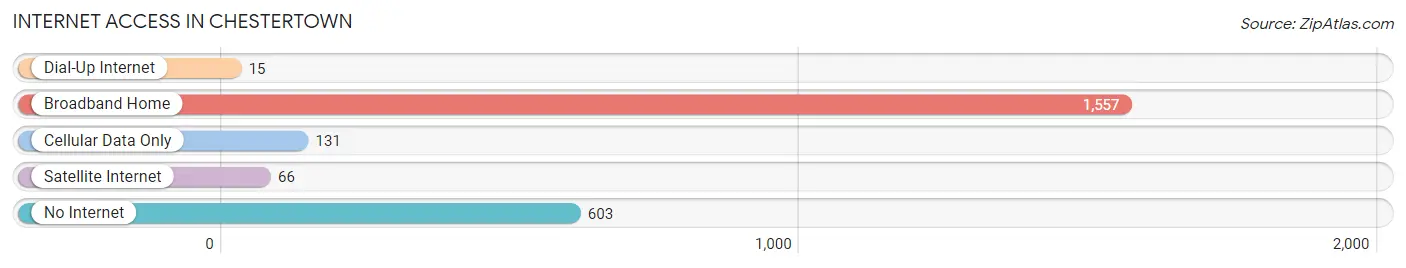
| Internet Type | # Households | % Households |
| Dial-Up Internet | 15 | 0.6% |
| Broadband Home | 1,557 | 67.5% |
| Cellular Data Only | 131 | 5.7% |
| Satellite Internet | 66 | 2.9% |
| No Internet | 603 | 26.2% |
| Total | 2,306 | 100.0% |
Chestertown Summary
Chestertown, Maryland is a small town located in Kent County on the Eastern Shore of the Chesapeake Bay. It is the county seat of Kent County and is home to Washington College, a private liberal arts college. The town has a population of 5,252 as of the 2010 census and is part of the larger Salisbury, Maryland-Delaware Metropolitan Statistical Area.
History
The area that is now Chestertown was first settled by Europeans in 1661 when the Englishman John Smith established a trading post on the Chester River. The town was officially founded in 1706 and named after the Earl of Chester, Thomas West. The town quickly became a major port and trading center for the region, and by the mid-18th century it was the largest town in Maryland.
During the Revolutionary War, Chestertown was a major center of activity. In 1777, the town was the site of the first naval battle of the war, when the British warship HMS DeBraak was sunk by the Americans. The town was also the site of the first public reading of the Declaration of Independence in Maryland.
In the 19th century, Chestertown became a center of education, with the founding of Washington College in 1782 and the opening of the Chestertown Female Seminary in 1839. The town also became a center of industry, with the opening of several mills and factories.
Geography
Chestertown is located in Kent County on the Eastern Shore of the Chesapeake Bay. It is situated at the confluence of the Chester River and the Sassafras River. The town is located about 25 miles south of the state capital of Annapolis and about 50 miles east of Baltimore.
The town has a total area of 2.2 square miles, all of which is land. The terrain is mostly flat, with some rolling hills. The climate is humid subtropical, with hot, humid summers and mild winters.
Economy
The economy of Chestertown is largely based on tourism, education, and manufacturing. Washington College is the largest employer in the town, with over 1,000 employees. Other major employers include the Chestertown Marina, the Chestertown Tea Party Festival, and the Chestertown Historic District.
The town is also home to several manufacturing companies, including the Chesapeake Bay Candle Company, the Chestertown Woodworking Company, and the Chestertown Boatworks.
Demographics
As of the 2010 census, Chestertown had a population of 5,252. The racial makeup of the town was 79.2% White, 14.3% African American, 0.5% Native American, 1.7% Asian, 0.1% Pacific Islander, 1.2% from other races, and 2.9% from two or more races. Hispanic or Latino of any race were 4.2% of the population.
The median income for a household in Chestertown was $45,938, and the median income for a family was $60,938. The per capita income for the town was $25,938. About 11.2% of families and 16.2% of the population were below the poverty line, including 22.2% of those under age 18 and 8.2% of those age 65 or over.
Common Questions
What is Per Capita Income in Chestertown?
Per Capita income in Chestertown is $30,459.
What is the Median Family Income in Chestertown?
Median Family Income in Chestertown is $75,976.
What is the Median Household income in Chestertown?
Median Household Income in Chestertown is $43,980.
What is Income or Wage Gap in Chestertown?
Income or Wage Gap in Chestertown is 57.9%.
Women in Chestertown earn 42.1 cents for every dollar earned by a man.
What is Inequality or Gini Index in Chestertown?
Inequality or Gini Index in Chestertown is 0.46.
What is the Total Population of Chestertown?
Total Population of Chestertown is 5,522.
What is the Total Male Population of Chestertown?
Total Male Population of Chestertown is 2,425.
What is the Total Female Population of Chestertown?
Total Female Population of Chestertown is 3,097.
What is the Ratio of Males per 100 Females in Chestertown?
There are 78.30 Males per 100 Females in Chestertown.
What is the Ratio of Females per 100 Males in Chestertown?
There are 127.71 Females per 100 Males in Chestertown.
What is the Median Population Age in Chestertown?
Median Population Age in Chestertown is 32.9 Years.
What is the Average Family Size in Chestertown
Average Family Size in Chestertown is 2.4 People.
What is the Average Household Size in Chestertown
Average Household Size in Chestertown is 1.8 People.
How Large is the Labor Force in Chestertown?
There are 2,369 People in the Labor Forcein in Chestertown.
What is the Percentage of People in the Labor Force in Chestertown?
48.3% of People are in the Labor Force in Chestertown.
What is the Unemployment Rate in Chestertown?
Unemployment Rate in Chestertown is 3.9%.