Cockeysville, MD Map & Demographics
Cockeysville Map
Cockeysville Overview
$51,180
PER CAPITA INCOME
$109,719
AVG FAMILY INCOME
$81,966
AVG HOUSEHOLD INCOME
17.0%
WAGE / INCOME GAP [ % ]
83.0¢/ $1
WAGE / INCOME GAP [ $ ]
$7,937
FAMILY INCOME DEFICIT
0.44
INEQUALITY / GINI INDEX
23,246
TOTAL POPULATION
12,066
MALE POPULATION
11,180
FEMALE POPULATION
107.92
MALES / 100 FEMALES
92.66
FEMALES / 100 MALES
35.3
MEDIAN AGE
2.9
AVG FAMILY SIZE
2.2
AVG HOUSEHOLD SIZE
14,194
LABOR FORCE [ PEOPLE ]
72.9%
PERCENT IN LABOR FORCE
5.0%
UNEMPLOYMENT RATE
Cockeysville Zip Codes
Income in Cockeysville
Income Overview in Cockeysville
Per Capita Income in Cockeysville is $51,180, while median incomes of families and households are $109,719 and $81,966 respectively.
| Characteristic | Number | Measure |
| Per Capita Income | 23,246 | $51,180 |
| Median Family Income | 5,396 | $109,719 |
| Mean Family Income | 5,396 | $140,053 |
| Median Household Income | 10,305 | $81,966 |
| Mean Household Income | 10,305 | $112,656 |
| Income Deficit | 5,396 | $7,937 |
| Wage / Income Gap (%) | 23,246 | 17.03% |
| Wage / Income Gap ($) | 23,246 | 82.97¢ per $1 |
| Gini / Inequality Index | 23,246 | 0.44 |
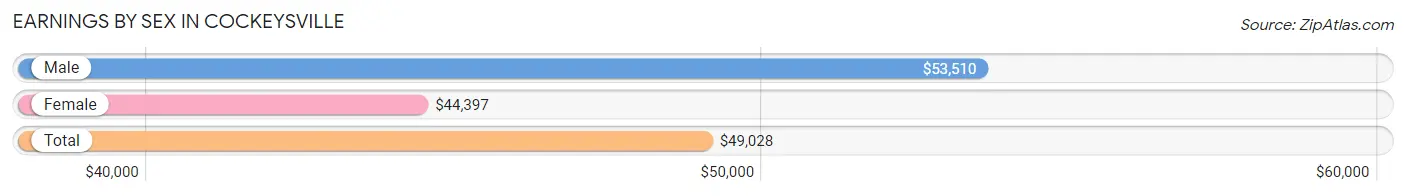
Earnings by Sex in Cockeysville
Average Earnings in Cockeysville are $49,028, $53,510 for men and $44,397 for women, a difference of 17.0%.
| Sex | Number | Average Earnings |
| Male | 7,854 (54.6%) | $53,510 |
| Female | 6,531 (45.4%) | $44,397 |
| Total | 14,385 (100.0%) | $49,028 |
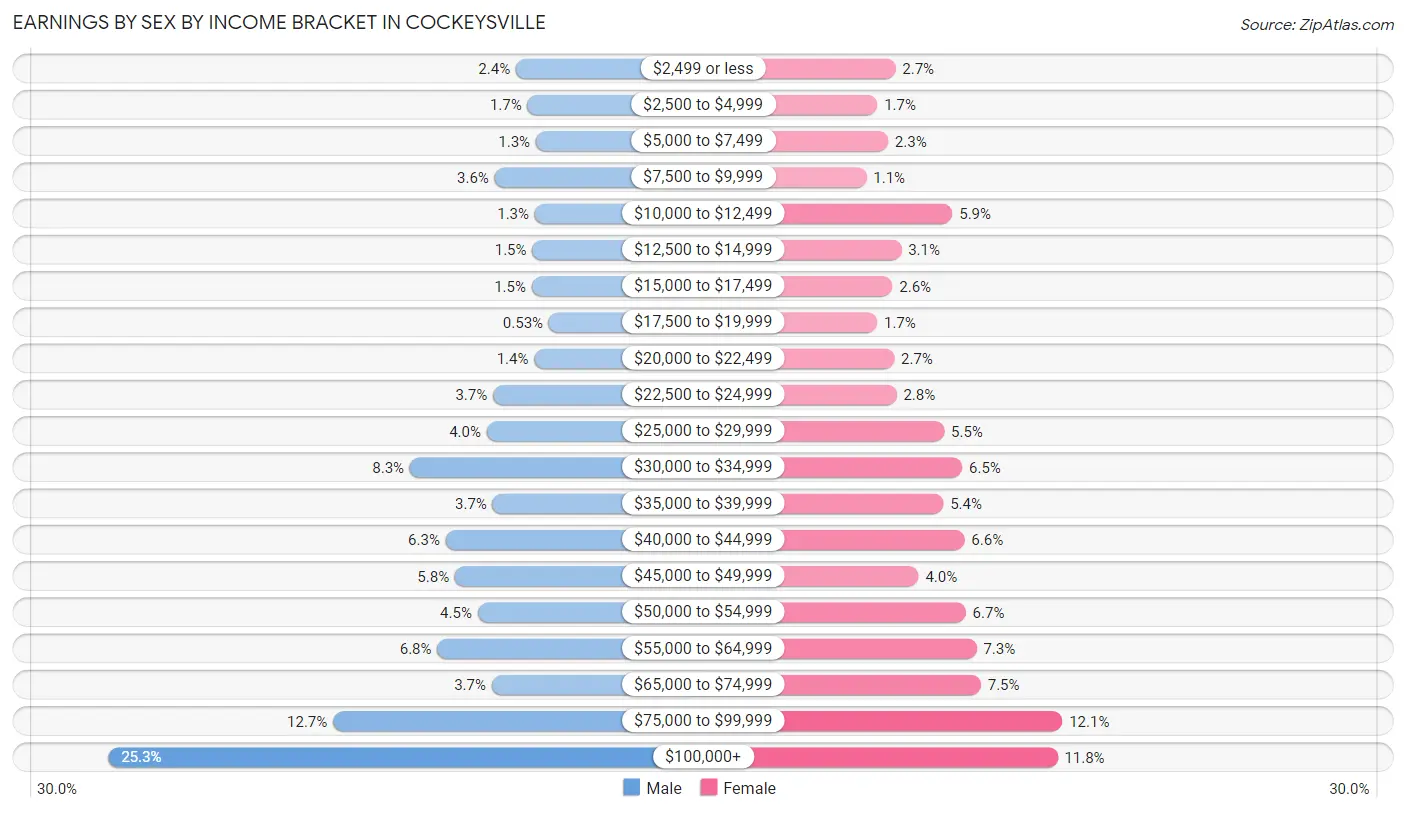
Earnings by Sex by Income Bracket in Cockeysville
The most common earnings brackets in Cockeysville are $100,000+ for men (1,987 | 25.3%) and $75,000 to $99,999 for women (791 | 12.1%).
| Income | Male | Female |
| $2,499 or less | 187 (2.4%) | 178 (2.7%) |
| $2,500 to $4,999 | 136 (1.7%) | 112 (1.7%) |
| $5,000 to $7,499 | 99 (1.3%) | 151 (2.3%) |
| $7,500 to $9,999 | 281 (3.6%) | 72 (1.1%) |
| $10,000 to $12,499 | 104 (1.3%) | 387 (5.9%) |
| $12,500 to $14,999 | 115 (1.5%) | 200 (3.1%) |
| $15,000 to $17,499 | 117 (1.5%) | 167 (2.6%) |
| $17,500 to $19,999 | 42 (0.5%) | 111 (1.7%) |
| $20,000 to $22,499 | 106 (1.3%) | 174 (2.7%) |
| $22,500 to $24,999 | 288 (3.7%) | 182 (2.8%) |
| $25,000 to $29,999 | 316 (4.0%) | 357 (5.5%) |
| $30,000 to $34,999 | 655 (8.3%) | 423 (6.5%) |
| $35,000 to $39,999 | 290 (3.7%) | 354 (5.4%) |
| $40,000 to $44,999 | 497 (6.3%) | 432 (6.6%) |
| $45,000 to $49,999 | 456 (5.8%) | 263 (4.0%) |
| $50,000 to $54,999 | 356 (4.5%) | 436 (6.7%) |
| $55,000 to $64,999 | 534 (6.8%) | 476 (7.3%) |
| $65,000 to $74,999 | 294 (3.7%) | 492 (7.5%) |
| $75,000 to $99,999 | 994 (12.7%) | 791 (12.1%) |
| $100,000+ | 1,987 (25.3%) | 773 (11.8%) |
| Total | 7,854 (100.0%) | 6,531 (100.0%) |
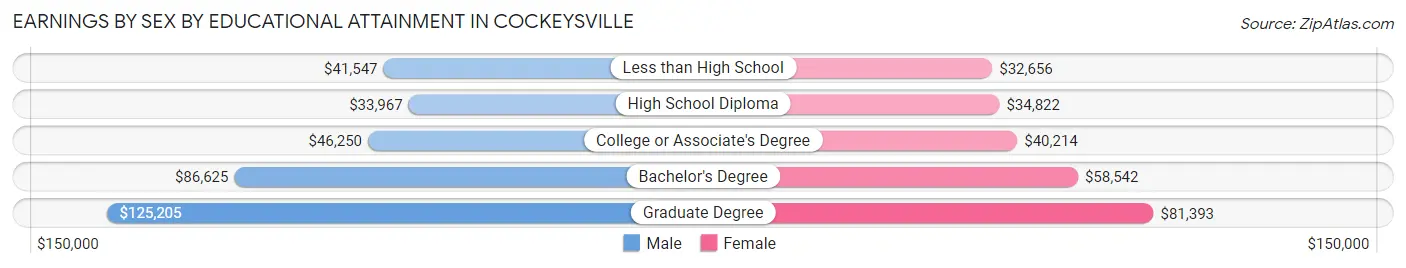
Earnings by Sex by Educational Attainment in Cockeysville
Average earnings in Cockeysville are $59,793 for men and $51,206 for women, a difference of 14.4%. Men with an educational attainment of graduate degree enjoy the highest average annual earnings of $125,205, while those with high school diploma education earn the least with $33,967. Women with an educational attainment of graduate degree earn the most with the average annual earnings of $81,393, while those with less than high school education have the smallest earnings of $32,656.
| Educational Attainment | Male Income | Female Income |
| Less than High School | $41,547 | $32,656 |
| High School Diploma | $33,967 | $34,822 |
| College or Associate's Degree | $46,250 | $40,214 |
| Bachelor's Degree | $86,625 | $58,542 |
| Graduate Degree | $125,205 | $81,393 |
| Total | $59,793 | $51,206 |
Family Income in Cockeysville
Family Income Brackets in Cockeysville
According to the Cockeysville family income data, there are 1,095 families falling into the $200,000+ income range, which is the most common income bracket and makes up 20.3% of all families. Conversely, the $10,000 to $14,999 income bracket is the least frequent group with only 65 families (1.2%) belonging to this category.
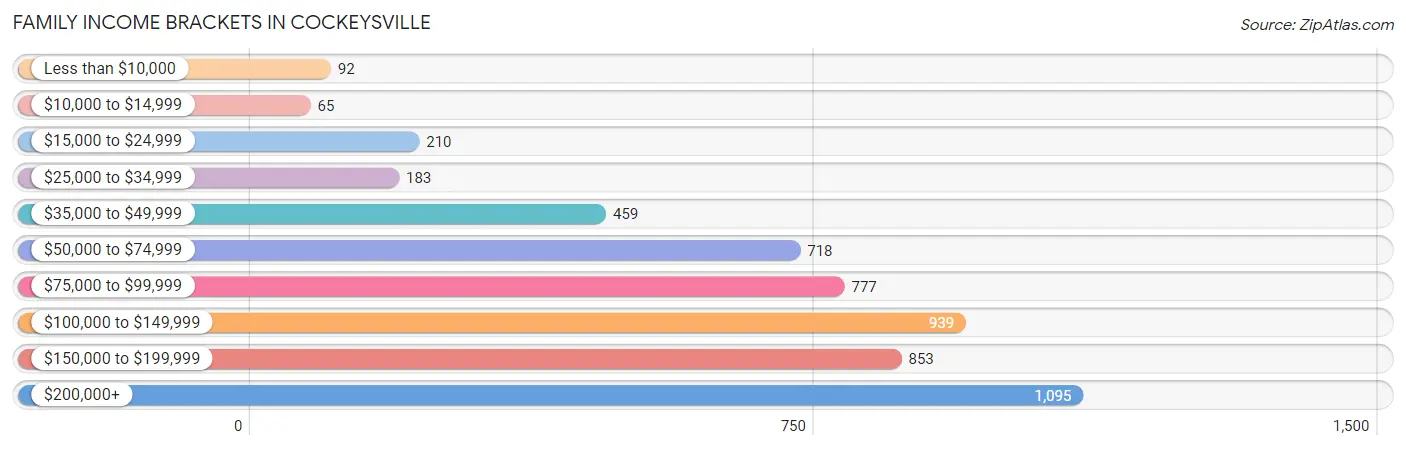
| Income Bracket | # Families | % Families |
| Less than $10,000 | 92 | 1.7% |
| $10,000 to $14,999 | 65 | 1.2% |
| $15,000 to $24,999 | 210 | 3.9% |
| $25,000 to $34,999 | 183 | 3.4% |
| $35,000 to $49,999 | 459 | 8.5% |
| $50,000 to $74,999 | 718 | 13.3% |
| $75,000 to $99,999 | 777 | 14.4% |
| $100,000 to $149,999 | 939 | 17.4% |
| $150,000 to $199,999 | 853 | 15.8% |
| $200,000+ | 1,095 | 20.3% |
Family Income by Famaliy Size in Cockeysville
4-person families (943 | 17.5%) account for the highest median family income in Cockeysville with $141,283 per family, while 2-person families (2,852 | 52.8%) have the highest median income of $50,312 per family member.
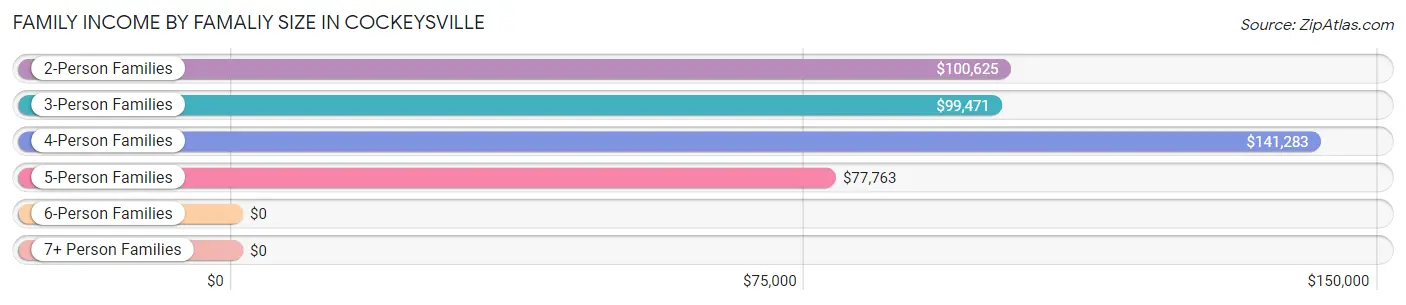
| Income Bracket | # Families | Median Income |
| 2-Person Families | 2,852 (52.8%) | $100,625 |
| 3-Person Families | 1,207 (22.4%) | $99,471 |
| 4-Person Families | 943 (17.5%) | $141,283 |
| 5-Person Families | 298 (5.5%) | $77,763 |
| 6-Person Families | 54 (1.0%) | $0 |
| 7+ Person Families | 42 (0.8%) | $0 |
| Total | 5,396 (100.0%) | $109,719 |
Family Income by Number of Earners in Cockeysville
The median family income in Cockeysville is $109,719, with families comprising 2 earners (2,155) having the highest median family income of $141,550, while families with no earners (526) have the lowest median family income of $67,132, accounting for 39.9% and 9.8% of families, respectively.
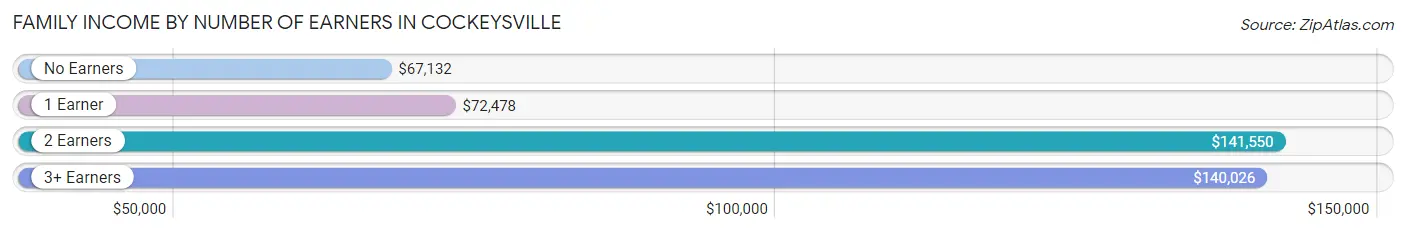
| Number of Earners | # Families | Median Income |
| No Earners | 526 (9.8%) | $67,132 |
| 1 Earner | 2,123 (39.3%) | $72,478 |
| 2 Earners | 2,155 (39.9%) | $141,550 |
| 3+ Earners | 592 (11.0%) | $140,026 |
| Total | 5,396 (100.0%) | $109,719 |
Household Income in Cockeysville
Household Income Brackets in Cockeysville
With 1,618 households falling in the category, the $100,000 to $149,999 income range is the most frequent in Cockeysville, accounting for 15.7% of all households. In contrast, only 185 households (1.8%) fall into the $10,000 to $14,999 income bracket, making it the least populous group.
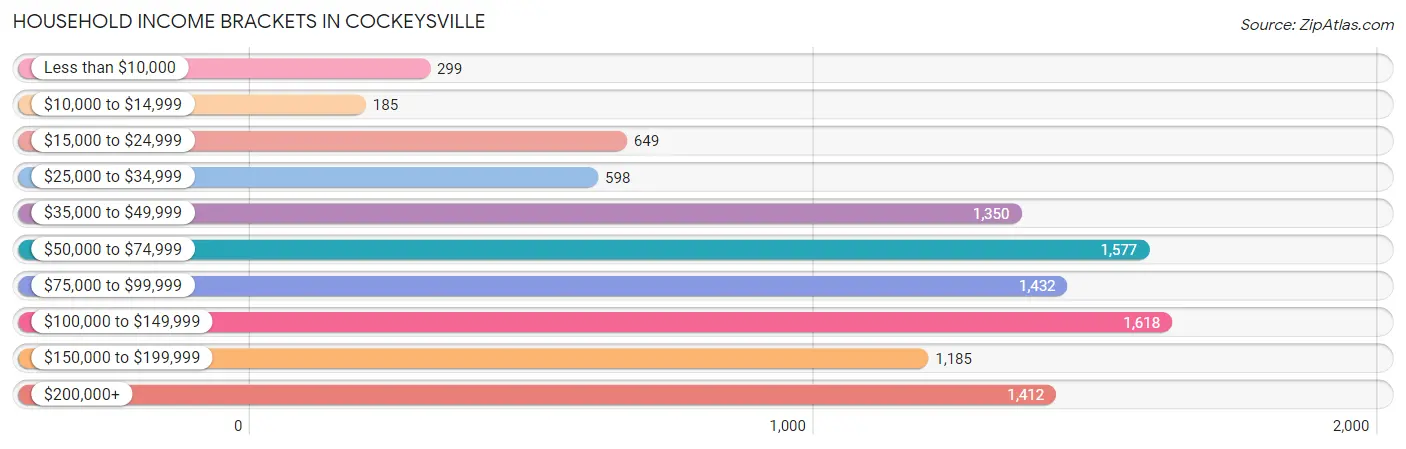
| Income Bracket | # Households | % Households |
| Less than $10,000 | 299 | 2.9% |
| $10,000 to $14,999 | 185 | 1.8% |
| $15,000 to $24,999 | 649 | 6.3% |
| $25,000 to $34,999 | 598 | 5.8% |
| $35,000 to $49,999 | 1,350 | 13.1% |
| $50,000 to $74,999 | 1,577 | 15.3% |
| $75,000 to $99,999 | 1,432 | 13.9% |
| $100,000 to $149,999 | 1,618 | 15.7% |
| $150,000 to $199,999 | 1,185 | 11.5% |
| $200,000+ | 1,412 | 13.7% |
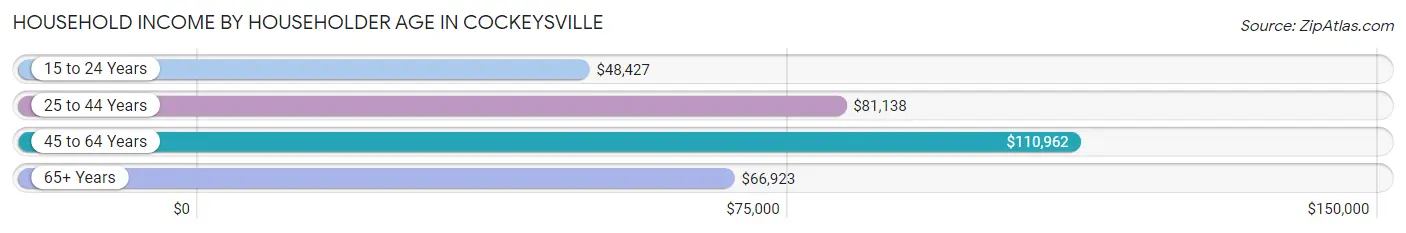
Household Income by Householder Age in Cockeysville
The median household income in Cockeysville is $81,966, with the highest median household income of $110,962 found in the 45 to 64 years age bracket for the primary householder. A total of 3,296 households (32.0%) fall into this category. Meanwhile, the 15 to 24 years age bracket for the primary householder has the lowest median household income of $48,427, with 504 households (4.9%) in this group.
| Income Bracket | # Households | Median Income |
| 15 to 24 Years | 504 (4.9%) | $48,427 |
| 25 to 44 Years | 4,575 (44.4%) | $81,138 |
| 45 to 64 Years | 3,296 (32.0%) | $110,962 |
| 65+ Years | 1,930 (18.7%) | $66,923 |
| Total | 10,305 (100.0%) | $81,966 |
Poverty in Cockeysville
Income Below Poverty by Sex and Age in Cockeysville
With 10.8% poverty level for males and 11.8% for females among the residents of Cockeysville, 18 to 24 year old males and 5 year old females are the most vulnerable to poverty, with 278 males (24.1%) and 33 females (32.7%) in their respective age groups living below the poverty level.
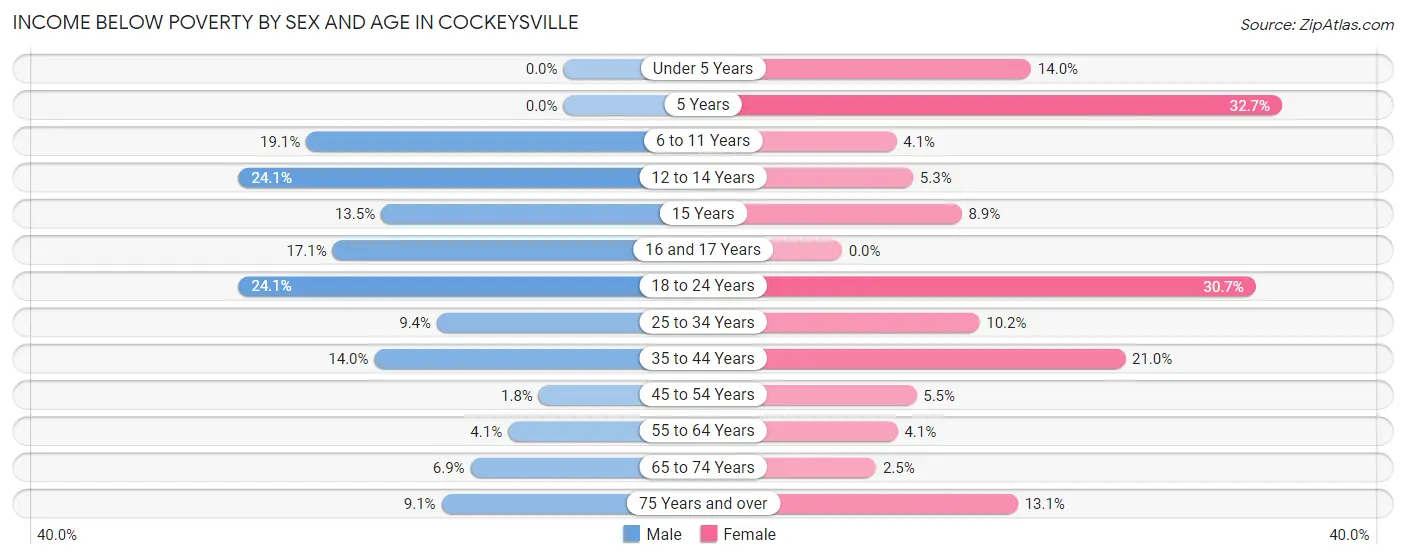
| Age Bracket | Male | Female |
| Under 5 Years | 0 (0.0%) | 75 (14.0%) |
| 5 Years | 0 (0.0%) | 33 (32.7%) |
| 6 to 11 Years | 191 (19.1%) | 14 (4.1%) |
| 12 to 14 Years | 88 (24.1%) | 16 (5.3%) |
| 15 Years | 13 (13.5%) | 8 (8.9%) |
| 16 and 17 Years | 36 (17.1%) | 0 (0.0%) |
| 18 to 24 Years | 278 (24.1%) | 321 (30.7%) |
| 25 to 34 Years | 233 (9.4%) | 269 (10.2%) |
| 35 to 44 Years | 274 (14.0%) | 290 (21.0%) |
| 45 to 54 Years | 28 (1.8%) | 69 (5.5%) |
| 55 to 64 Years | 46 (4.1%) | 47 (4.1%) |
| 65 to 74 Years | 59 (6.9%) | 22 (2.5%) |
| 75 Years and over | 38 (9.0%) | 91 (13.1%) |
| Total | 1,284 (10.8%) | 1,255 (11.8%) |
Income Above Poverty by Sex and Age in Cockeysville
According to the poverty statistics in Cockeysville, males aged under 5 years and females aged 16 and 17 years are the age groups that are most secure financially, with 100.0% of males and 100.0% of females in these age groups living above the poverty line.
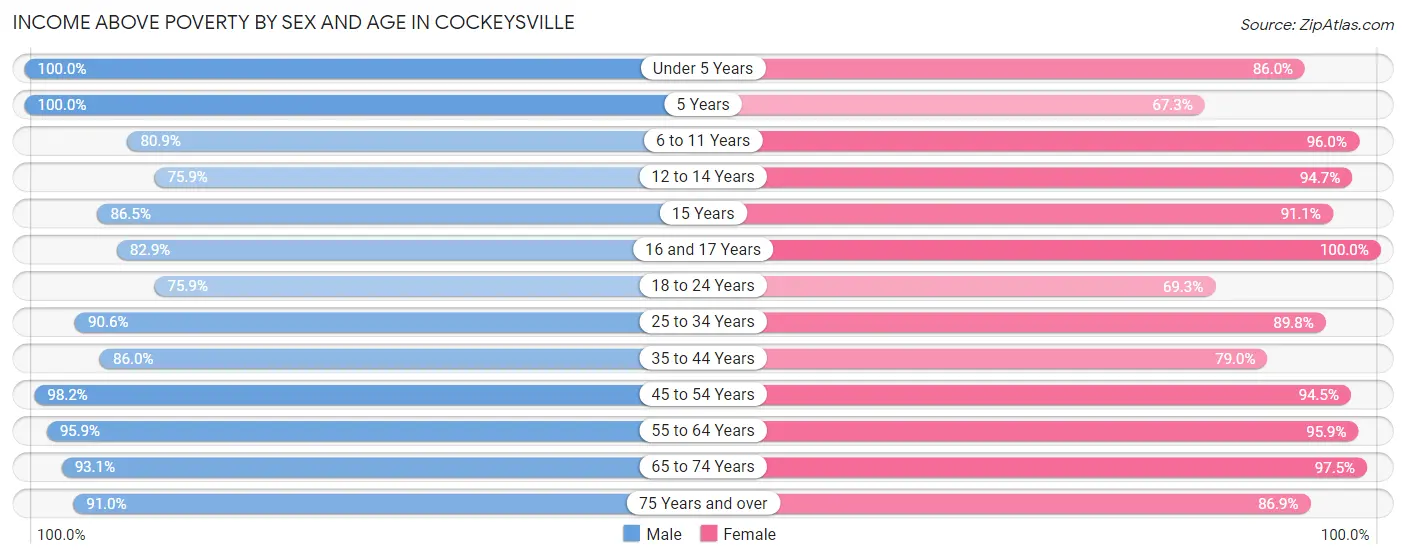
| Age Bracket | Male | Female |
| Under 5 Years | 557 (100.0%) | 459 (86.0%) |
| 5 Years | 105 (100.0%) | 68 (67.3%) |
| 6 to 11 Years | 809 (80.9%) | 332 (96.0%) |
| 12 to 14 Years | 277 (75.9%) | 287 (94.7%) |
| 15 Years | 83 (86.5%) | 82 (91.1%) |
| 16 and 17 Years | 174 (82.9%) | 254 (100.0%) |
| 18 to 24 Years | 874 (75.9%) | 724 (69.3%) |
| 25 to 34 Years | 2,248 (90.6%) | 2,365 (89.8%) |
| 35 to 44 Years | 1,679 (86.0%) | 1,089 (79.0%) |
| 45 to 54 Years | 1,499 (98.2%) | 1,178 (94.5%) |
| 55 to 64 Years | 1,072 (95.9%) | 1,090 (95.9%) |
| 65 to 74 Years | 796 (93.1%) | 845 (97.5%) |
| 75 Years and over | 382 (90.9%) | 606 (86.9%) |
| Total | 10,555 (89.1%) | 9,379 (88.2%) |
Income Below Poverty Among Married-Couple Families in Cockeysville
The poverty statistics for married-couple families in Cockeysville show that 4.2% or 151 of the total 3,632 families live below the poverty line. Families with 5 or more children have the highest poverty rate of 100.0%, comprising of 9 families. On the other hand, families with 1 or 2 children have the lowest poverty rate of 1.6%, which includes 17 families.
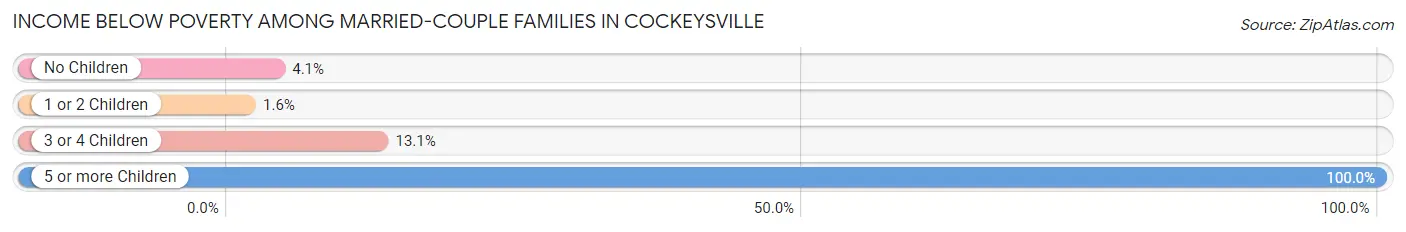
| Children | Above Poverty | Below Poverty |
| No Children | 2,215 (95.9%) | 95 (4.1%) |
| 1 or 2 Children | 1,067 (98.4%) | 17 (1.6%) |
| 3 or 4 Children | 199 (86.9%) | 30 (13.1%) |
| 5 or more Children | 0 (0.0%) | 9 (100.0%) |
| Total | 3,481 (95.8%) | 151 (4.2%) |
Income Below Poverty Among Single-Parent Households in Cockeysville
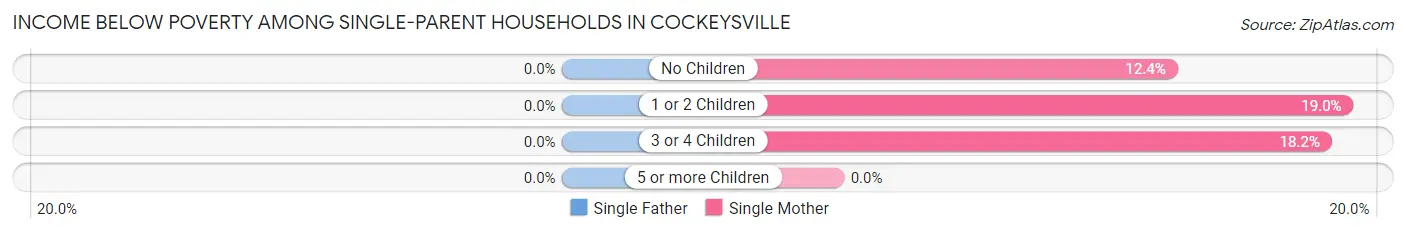
| Children | Single Father | Single Mother |
| No Children | 0 (0.0%) | 49 (12.4%) |
| 1 or 2 Children | 0 (0.0%) | 165 (19.0%) |
| 3 or 4 Children | 0 (0.0%) | 12 (18.2%) |
| 5 or more Children | 0 (0.0%) | 0 (0.0%) |
| Total | 0 (0.0%) | 226 (17.0%) |
Income Below Poverty Among Married-Couple vs Single-Parent Households in Cockeysville
The poverty data for Cockeysville shows that 151 of the married-couple family households (4.2%) and 226 of the single-parent households (12.8%) are living below the poverty level. Within the married-couple family households, those with 5 or more children have the highest poverty rate, with 9 households (100.0%) falling below the poverty line. Among the single-parent households, those with 3 or 4 children have the highest poverty rate, with 12 household (18.2%) living below poverty.
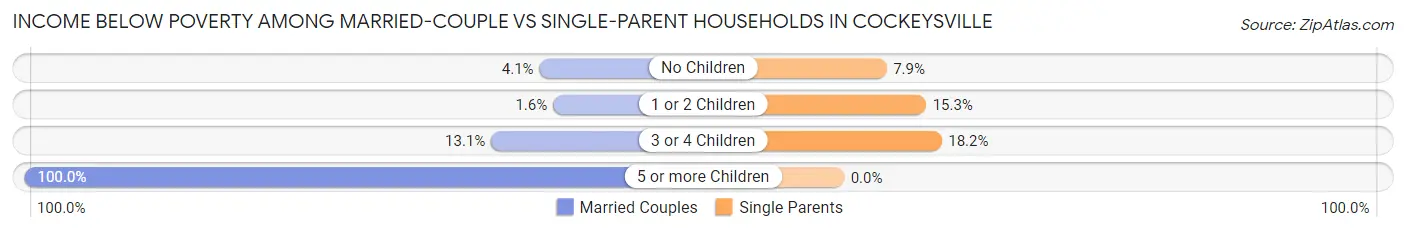
| Children | Married-Couple Families | Single-Parent Households |
| No Children | 95 (4.1%) | 49 (7.9%) |
| 1 or 2 Children | 17 (1.6%) | 165 (15.3%) |
| 3 or 4 Children | 30 (13.1%) | 12 (18.2%) |
| 5 or more Children | 9 (100.0%) | 0 (0.0%) |
| Total | 151 (4.2%) | 226 (12.8%) |
Race in Cockeysville
The most populous races in Cockeysville are White / Caucasian (13,039 | 56.1%), Black / African American (4,889 | 21.0%), and Hispanic or Latino (2,633 | 11.3%).
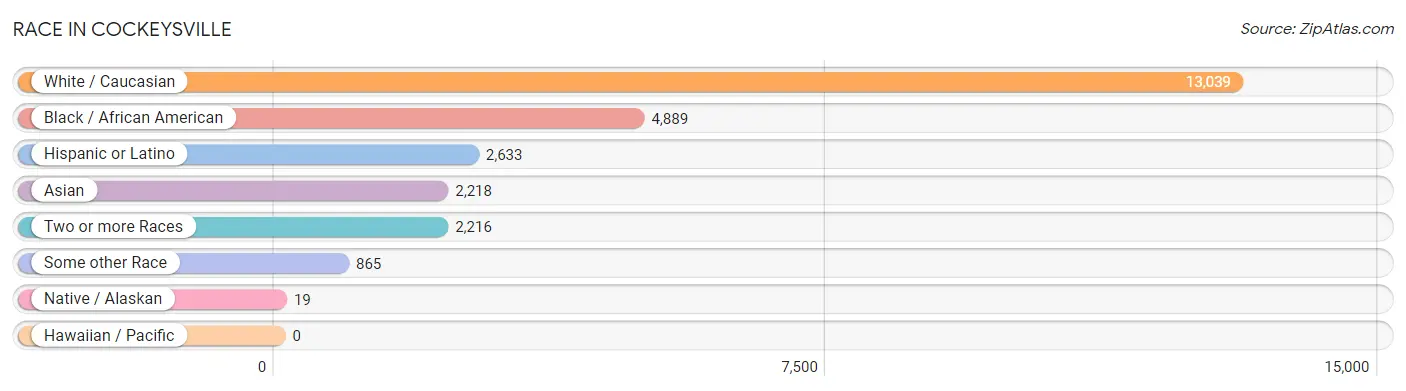
| Race | # Population | % Population |
| Asian | 2,218 | 9.5% |
| Black / African American | 4,889 | 21.0% |
| Hawaiian / Pacific | 0 | 0.0% |
| Hispanic or Latino | 2,633 | 11.3% |
| Native / Alaskan | 19 | 0.1% |
| White / Caucasian | 13,039 | 56.1% |
| Two or more Races | 2,216 | 9.5% |
| Some other Race | 865 | 3.7% |
| Total | 23,246 | 100.0% |
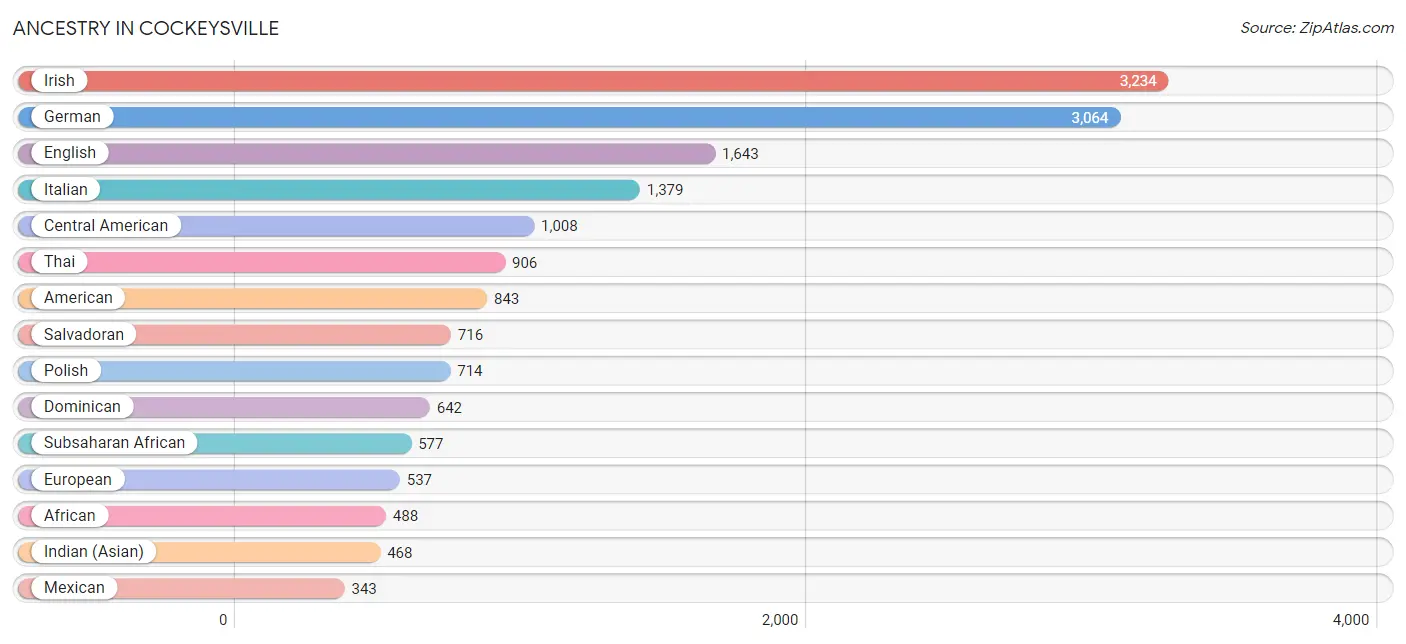
Ancestry in Cockeysville
The most populous ancestries reported in Cockeysville are Irish (3,234 | 13.9%), German (3,064 | 13.2%), English (1,643 | 7.1%), Italian (1,379 | 5.9%), and Central American (1,008 | 4.3%), together accounting for 44.4% of all Cockeysville residents.
| Ancestry | # Population | % Population |
| Afghan | 329 | 1.4% |
| African | 488 | 2.1% |
| American | 843 | 3.6% |
| Arab | 242 | 1.0% |
| Argentinean | 4 | 0.0% |
| Austrian | 5 | 0.0% |
| Barbadian | 143 | 0.6% |
| Belgian | 58 | 0.3% |
| Bhutanese | 48 | 0.2% |
| Blackfeet | 6 | 0.0% |
| Brazilian | 24 | 0.1% |
| British | 187 | 0.8% |
| Burmese | 179 | 0.8% |
| Canadian | 17 | 0.1% |
| Central American | 1,008 | 4.3% |
| Cherokee | 71 | 0.3% |
| Chippewa | 4 | 0.0% |
| Creek | 52 | 0.2% |
| Cuban | 81 | 0.4% |
| Czech | 36 | 0.2% |
| Czechoslovakian | 10 | 0.0% |
| Danish | 4 | 0.0% |
| Dominican | 642 | 2.8% |
| Dutch | 137 | 0.6% |
| Eastern European | 70 | 0.3% |
| Ecuadorian | 9 | 0.0% |
| Egyptian | 151 | 0.6% |
| English | 1,643 | 7.1% |
| European | 537 | 2.3% |
| Filipino | 27 | 0.1% |
| Finnish | 74 | 0.3% |
| French | 183 | 0.8% |
| French American Indian | 109 | 0.5% |
| French Canadian | 39 | 0.2% |
| German | 3,064 | 13.2% |
| Greek | 224 | 1.0% |
| Guatemalan | 155 | 0.7% |
| Haitian | 115 | 0.5% |
| Honduran | 137 | 0.6% |
| Houma | 14 | 0.1% |
| Hungarian | 80 | 0.3% |
| Indian (Asian) | 468 | 2.0% |
| Indonesian | 19 | 0.1% |
| Iranian | 164 | 0.7% |
| Irish | 3,234 | 13.9% |
| Italian | 1,379 | 5.9% |
| Jamaican | 95 | 0.4% |
| Jordanian | 11 | 0.1% |
| Korean | 168 | 0.7% |
| Latvian | 12 | 0.1% |
| Lithuanian | 43 | 0.2% |
| Mexican | 343 | 1.5% |
| Moroccan | 64 | 0.3% |
| Navajo | 6 | 0.0% |
| Nigerian | 89 | 0.4% |
| Northern European | 27 | 0.1% |
| Norwegian | 196 | 0.8% |
| Okinawan | 12 | 0.1% |
| Paiute | 6 | 0.0% |
| Pakistani | 39 | 0.2% |
| Palestinian | 41 | 0.2% |
| Peruvian | 100 | 0.4% |
| Polish | 714 | 3.1% |
| Portuguese | 1 | 0.0% |
| Puerto Rican | 278 | 1.2% |
| Romanian | 59 | 0.3% |
| Russian | 222 | 1.0% |
| Salvadoran | 716 | 3.1% |
| Samoan | 27 | 0.1% |
| Scandinavian | 49 | 0.2% |
| Scotch-Irish | 107 | 0.5% |
| Scottish | 264 | 1.1% |
| Serbian | 20 | 0.1% |
| Slavic | 5 | 0.0% |
| Slovak | 19 | 0.1% |
| South American | 221 | 0.9% |
| Spaniard | 19 | 0.1% |
| Spanish | 41 | 0.2% |
| Sri Lankan | 129 | 0.5% |
| Subsaharan African | 577 | 2.5% |
| Swedish | 219 | 0.9% |
| Swiss | 67 | 0.3% |
| Syrian | 7 | 0.0% |
| Thai | 906 | 3.9% |
| Trinidadian and Tobagonian | 18 | 0.1% |
| Ukrainian | 109 | 0.5% |
| Venezuelan | 108 | 0.5% |
| Vietnamese | 25 | 0.1% |
| Welsh | 114 | 0.5% |
| Yaqui | 66 | 0.3% | View All 90 Rows |
Immigrants in Cockeysville
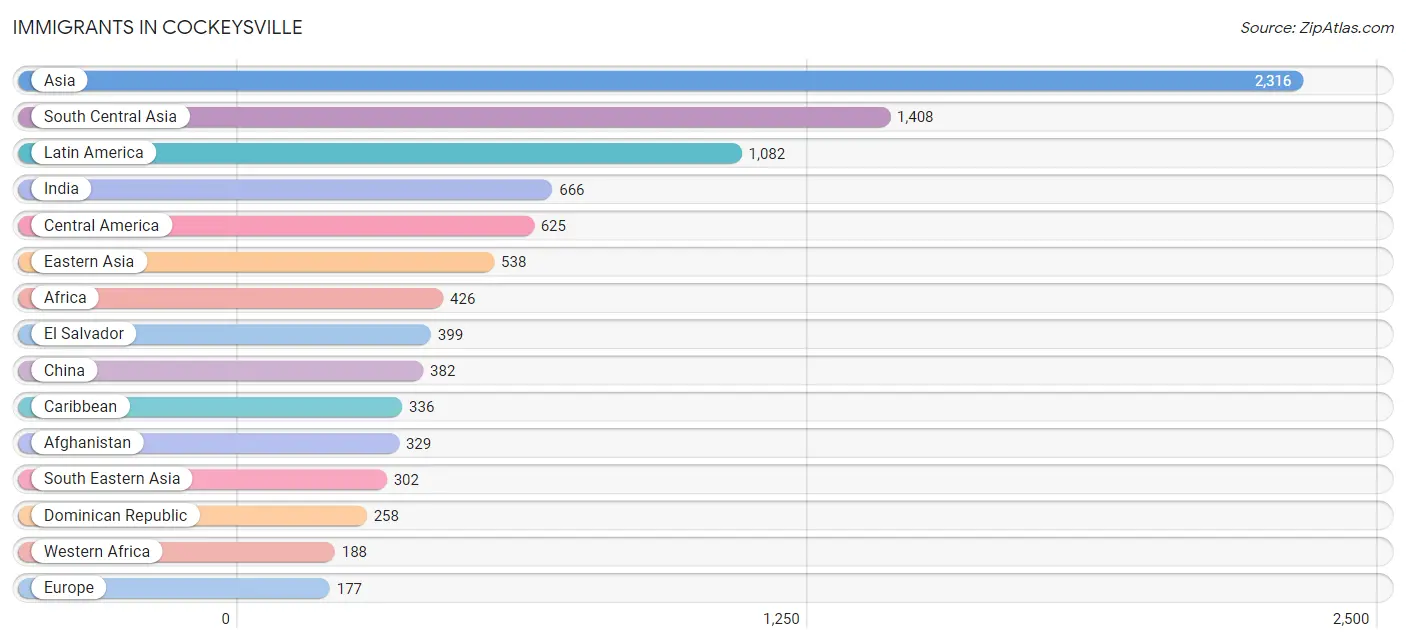
The most numerous immigrant groups reported in Cockeysville came from Asia (2,316 | 10.0%), South Central Asia (1,408 | 6.1%), Latin America (1,082 | 4.6%), India (666 | 2.9%), and Central America (625 | 2.7%), together accounting for 26.2% of all Cockeysville residents.
| Immigration Origin | # Population | % Population |
| Afghanistan | 329 | 1.4% |
| Africa | 426 | 1.8% |
| Argentina | 4 | 0.0% |
| Asia | 2,316 | 10.0% |
| Bangladesh | 25 | 0.1% |
| Barbados | 43 | 0.2% |
| Canada | 13 | 0.1% |
| Caribbean | 336 | 1.5% |
| Central America | 625 | 2.7% |
| China | 382 | 1.6% |
| Cuba | 8 | 0.0% |
| Dominican Republic | 258 | 1.1% |
| Eastern Africa | 156 | 0.7% |
| Eastern Asia | 538 | 2.3% |
| Eastern Europe | 37 | 0.2% |
| Ecuador | 9 | 0.0% |
| Egypt | 82 | 0.4% |
| El Salvador | 399 | 1.7% |
| England | 27 | 0.1% |
| Europe | 177 | 0.8% |
| France | 5 | 0.0% |
| Germany | 14 | 0.1% |
| Greece | 27 | 0.1% |
| Guatemala | 90 | 0.4% |
| Honduras | 89 | 0.4% |
| Hong Kong | 14 | 0.1% |
| India | 666 | 2.9% |
| Iran | 131 | 0.6% |
| Israel | 13 | 0.1% |
| Italy | 61 | 0.3% |
| Japan | 48 | 0.2% |
| Jordan | 9 | 0.0% |
| Kenya | 56 | 0.2% |
| Korea | 108 | 0.5% |
| Latin America | 1,082 | 4.6% |
| Malaysia | 17 | 0.1% |
| Mexico | 29 | 0.1% |
| Nepal | 88 | 0.4% |
| Nicaragua | 18 | 0.1% |
| Nigeria | 88 | 0.4% |
| Northern Africa | 82 | 0.4% |
| Northern Europe | 33 | 0.1% |
| Norway | 6 | 0.0% |
| Oceania | 5 | 0.0% |
| Pakistan | 169 | 0.7% |
| Philippines | 123 | 0.5% |
| Poland | 8 | 0.0% |
| Romania | 24 | 0.1% |
| Saudi Arabia | 10 | 0.0% |
| Singapore | 55 | 0.2% |
| South America | 121 | 0.5% |
| South Central Asia | 1,408 | 6.1% |
| South Eastern Asia | 302 | 1.3% |
| Southern Europe | 88 | 0.4% |
| Syria | 7 | 0.0% |
| Taiwan | 35 | 0.2% |
| Thailand | 16 | 0.1% |
| Trinidad and Tobago | 27 | 0.1% |
| Uganda | 72 | 0.3% |
| Venezuela | 108 | 0.5% |
| Vietnam | 72 | 0.3% |
| Western Africa | 188 | 0.8% |
| Western Asia | 68 | 0.3% |
| Western Europe | 19 | 0.1% | View All 64 Rows |
Sex and Age in Cockeysville
Sex and Age in Cockeysville
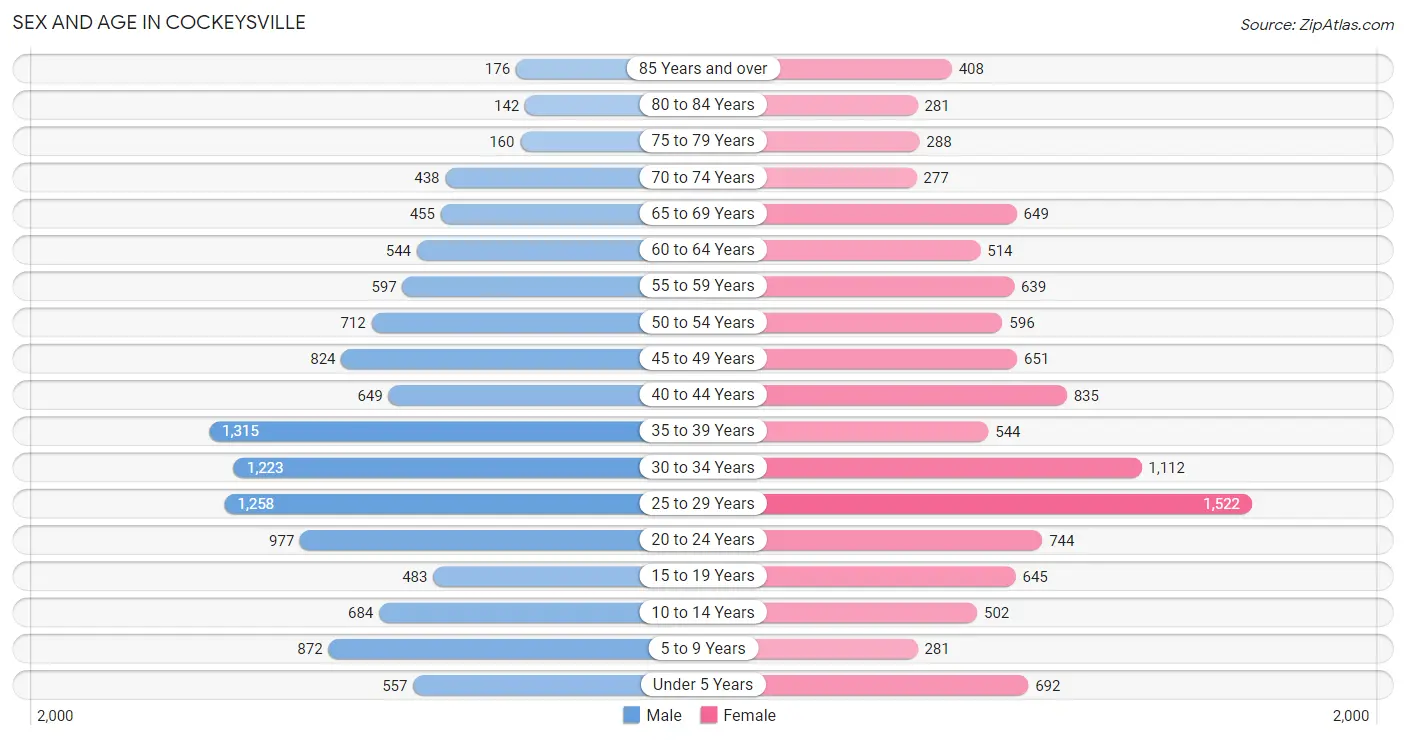
The most populous age groups in Cockeysville are 35 to 39 Years (1,315 | 10.9%) for men and 25 to 29 Years (1,522 | 13.6%) for women.
| Age Bracket | Male | Female |
| Under 5 Years | 557 (4.6%) | 692 (6.2%) |
| 5 to 9 Years | 872 (7.2%) | 281 (2.5%) |
| 10 to 14 Years | 684 (5.7%) | 502 (4.5%) |
| 15 to 19 Years | 483 (4.0%) | 645 (5.8%) |
| 20 to 24 Years | 977 (8.1%) | 744 (6.7%) |
| 25 to 29 Years | 1,258 (10.4%) | 1,522 (13.6%) |
| 30 to 34 Years | 1,223 (10.1%) | 1,112 (10.0%) |
| 35 to 39 Years | 1,315 (10.9%) | 544 (4.9%) |
| 40 to 44 Years | 649 (5.4%) | 835 (7.5%) |
| 45 to 49 Years | 824 (6.8%) | 651 (5.8%) |
| 50 to 54 Years | 712 (5.9%) | 596 (5.3%) |
| 55 to 59 Years | 597 (5.0%) | 639 (5.7%) |
| 60 to 64 Years | 544 (4.5%) | 514 (4.6%) |
| 65 to 69 Years | 455 (3.8%) | 649 (5.8%) |
| 70 to 74 Years | 438 (3.6%) | 277 (2.5%) |
| 75 to 79 Years | 160 (1.3%) | 288 (2.6%) |
| 80 to 84 Years | 142 (1.2%) | 281 (2.5%) |
| 85 Years and over | 176 (1.5%) | 408 (3.6%) |
| Total | 12,066 (100.0%) | 11,180 (100.0%) |
Families and Households in Cockeysville
Median Family Size in Cockeysville
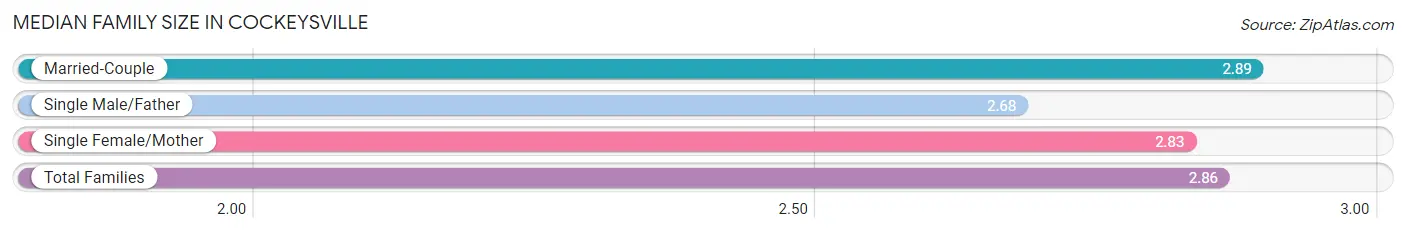
The median family size in Cockeysville is 2.86 persons per family, with married-couple families (3,632 | 67.3%) accounting for the largest median family size of 2.89 persons per family. On the other hand, single male/father families (435 | 8.1%) represent the smallest median family size with 2.68 persons per family.
| Family Type | # Families | Family Size |
| Married-Couple | 3,632 (67.3%) | 2.89 |
| Single Male/Father | 435 (8.1%) | 2.68 |
| Single Female/Mother | 1,329 (24.6%) | 2.83 |
| Total Families | 5,396 (100.0%) | 2.86 |
Median Household Size in Cockeysville
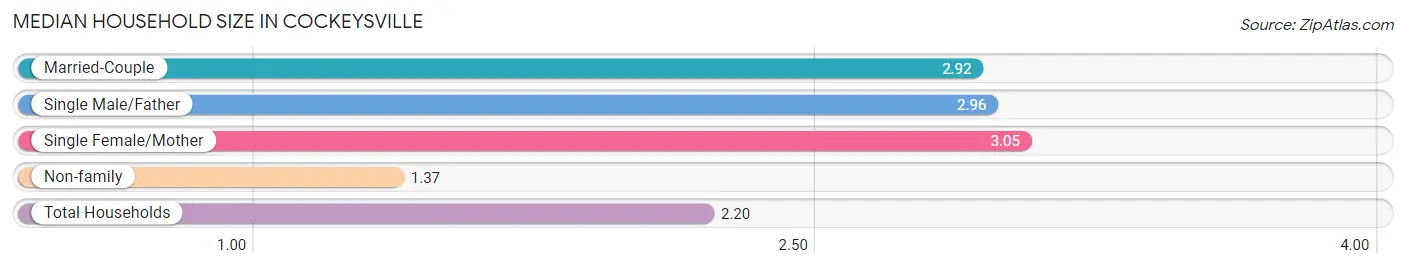
The median household size in Cockeysville is 2.20 persons per household, with single female/mother households (1,329 | 12.9%) accounting for the largest median household size of 3.05 persons per household. non-family households (4,909 | 47.6%) represent the smallest median household size with 1.37 persons per household.
| Household Type | # Households | Household Size |
| Married-Couple | 3,632 (35.2%) | 2.92 |
| Single Male/Father | 435 (4.2%) | 2.96 |
| Single Female/Mother | 1,329 (12.9%) | 3.05 |
| Non-family | 4,909 (47.6%) | 1.37 |
| Total Households | 10,305 (100.0%) | 2.20 |
Household Size by Marriage Status in Cockeysville
Out of a total of 10,305 households in Cockeysville, 5,396 (52.4%) are family households, while 4,909 (47.6%) are nonfamily households. The most numerous type of family households are 2-person households, comprising 2,598, and the most common type of nonfamily households are 1-person households, comprising 3,735.
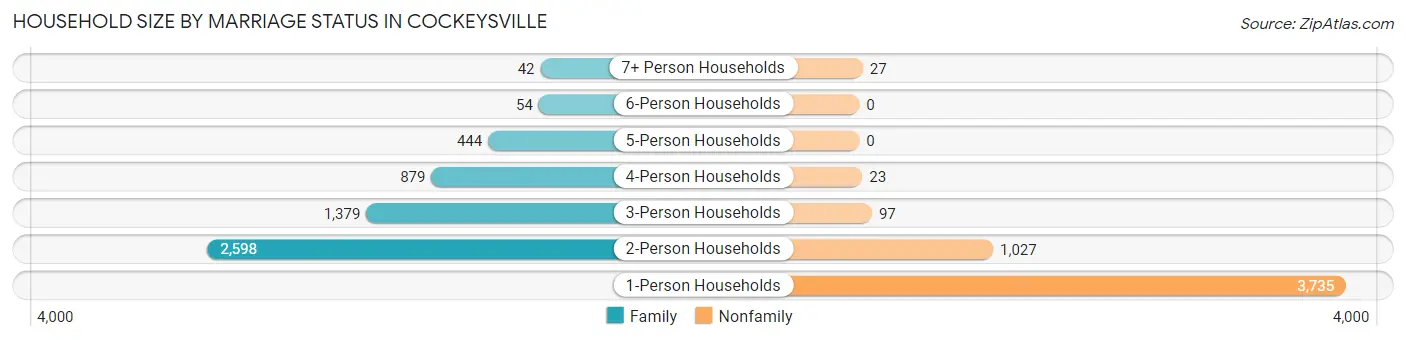
| Household Size | Family Households | Nonfamily Households |
| 1-Person Households | - | 3,735 (36.2%) |
| 2-Person Households | 2,598 (25.2%) | 1,027 (10.0%) |
| 3-Person Households | 1,379 (13.4%) | 97 (0.9%) |
| 4-Person Households | 879 (8.5%) | 23 (0.2%) |
| 5-Person Households | 444 (4.3%) | 0 (0.0%) |
| 6-Person Households | 54 (0.5%) | 0 (0.0%) |
| 7+ Person Households | 42 (0.4%) | 27 (0.3%) |
| Total | 5,396 (52.4%) | 4,909 (47.6%) |
Female Fertility in Cockeysville
Fertility by Age in Cockeysville
Average fertility rate in Cockeysville is 51.0 births per 1,000 women. Women in the age bracket of 15 to 19 years have the highest fertility rate with 109.0 births per 1,000 women. Women in the age bracket of 20 to 34 years acount for 72.2% of all women with births.
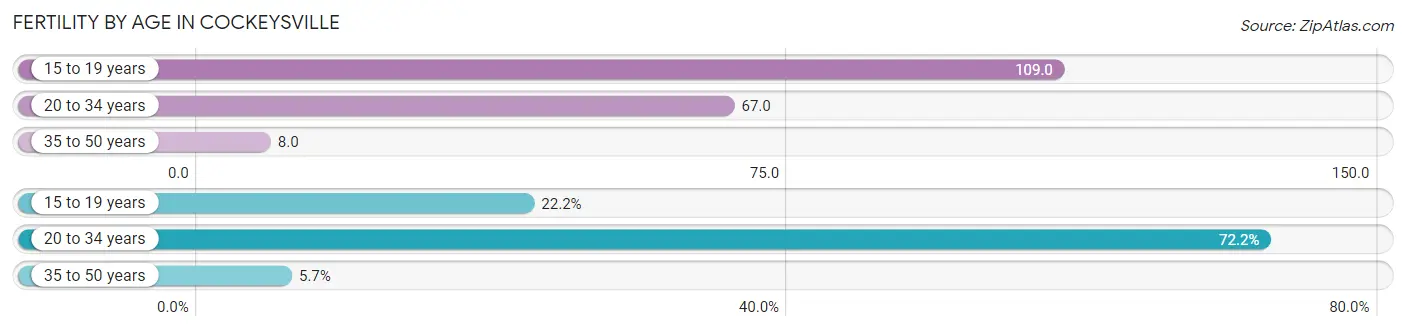
| Age Bracket | Women with Births | Births / 1,000 Women |
| 15 to 19 years | 70 (22.2%) | 109.0 |
| 20 to 34 years | 228 (72.2%) | 67.0 |
| 35 to 50 years | 18 (5.7%) | 8.0 |
| Total | 316 (100.0%) | 51.0 |
Fertility by Age by Marriage Status in Cockeysville
33.5% of women with births (316) in Cockeysville are married. The highest percentage of unmarried women with births falls into 15 to 19 years age bracket with 100.0% of them unmarried at the time of birth, while the lowest percentage of unmarried women with births belong to 35 to 50 years age bracket with 0.0% of them unmarried.
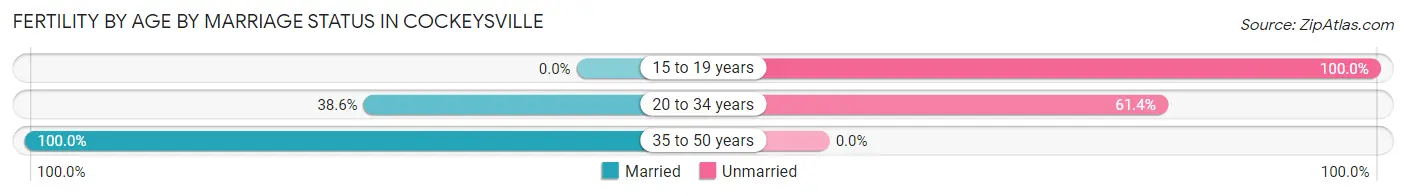
| Age Bracket | Married | Unmarried |
| 15 to 19 years | 0 (0.0%) | 70 (100.0%) |
| 20 to 34 years | 88 (38.6%) | 140 (61.4%) |
| 35 to 50 years | 18 (100.0%) | 0 (0.0%) |
| Total | 106 (33.5%) | 210 (66.5%) |
Fertility by Education in Cockeysville
Average fertility rate in Cockeysville is 51.0 births per 1,000 women. Women with the education attainment of less than high school have the highest fertility rate of 120.0 births per 1,000 women, while women with the education attainment of graduate degree have the lowest fertility at 10.0 births per 1,000 women. Women with the education attainment of bachelor's degree represent 63.9% of all women with births.
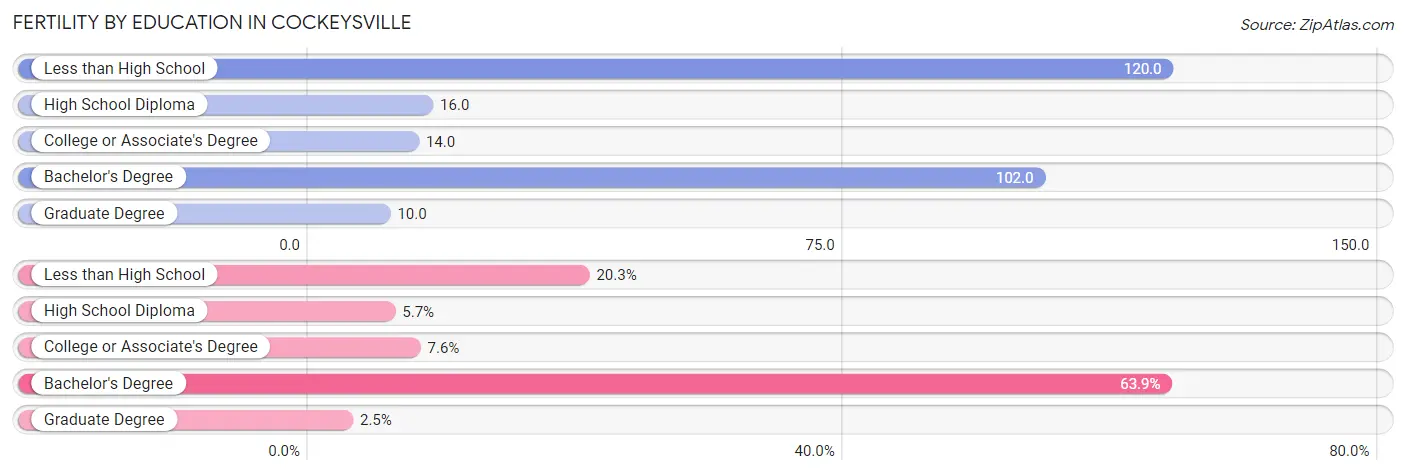
| Educational Attainment | Women with Births | Births / 1,000 Women |
| Less than High School | 64 (20.3%) | 120.0 |
| High School Diploma | 18 (5.7%) | 16.0 |
| College or Associate's Degree | 24 (7.6%) | 14.0 |
| Bachelor's Degree | 202 (63.9%) | 102.0 |
| Graduate Degree | 8 (2.5%) | 10.0 |
| Total | 316 (100.0%) | 51.0 |
Fertility by Education by Marriage Status in Cockeysville
66.5% of women with births in Cockeysville are unmarried. Women with the educational attainment of college or associate's degree are most likely to be married with 100.0% of them married at childbirth, while women with the educational attainment of high school diploma are least likely to be married with 100.0% of them unmarried at childbirth.
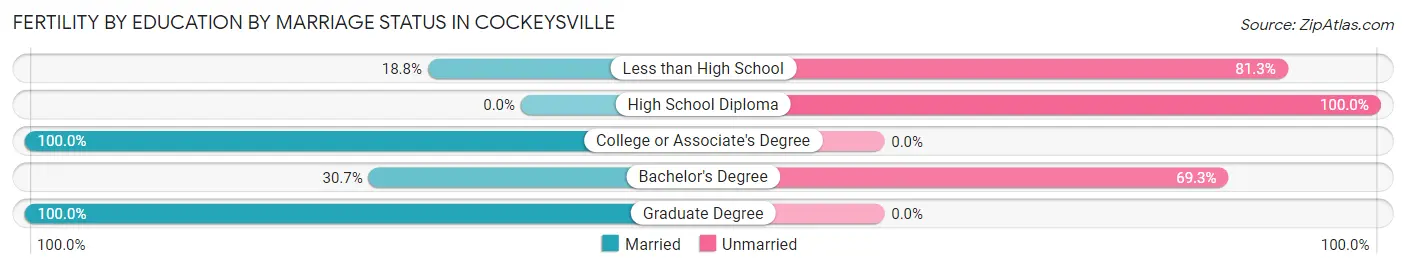
| Educational Attainment | Married | Unmarried |
| Less than High School | 12 (18.8%) | 52 (81.2%) |
| High School Diploma | 0 (0.0%) | 18 (100.0%) |
| College or Associate's Degree | 24 (100.0%) | 0 (0.0%) |
| Bachelor's Degree | 62 (30.7%) | 140 (69.3%) |
| Graduate Degree | 8 (100.0%) | 0 (0.0%) |
| Total | 106 (33.5%) | 210 (66.5%) |
Employment Characteristics in Cockeysville
Employment by Class of Employer in Cockeysville
Among the 13,102 employed individuals in Cockeysville, private company employees (9,630 | 73.5%), not-for-profit organizations (961 | 7.3%), and local government employees (552 | 4.2%) make up the most common classes of employment.
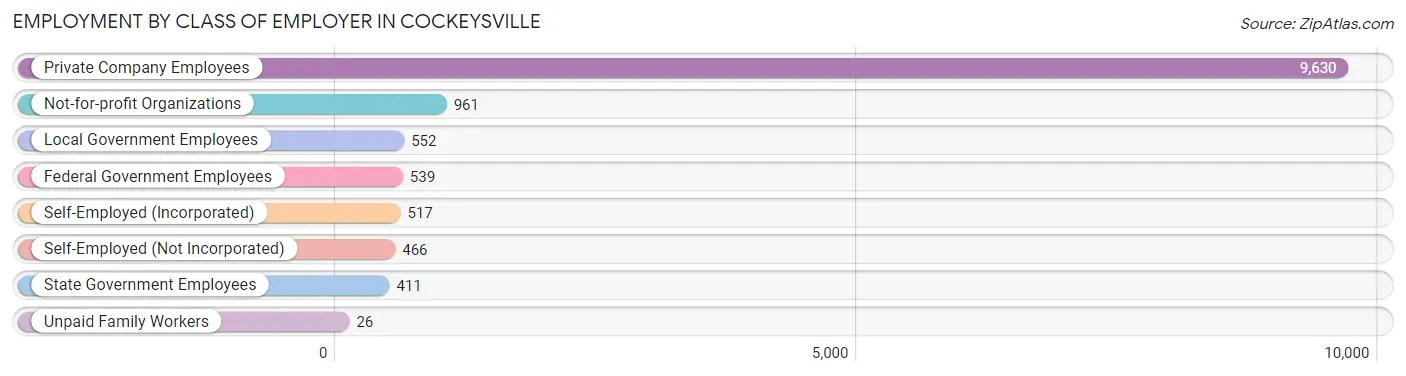
| Employer Class | # Employees | % Employees |
| Private Company Employees | 9,630 | 73.5% |
| Self-Employed (Incorporated) | 517 | 4.0% |
| Self-Employed (Not Incorporated) | 466 | 3.6% |
| Not-for-profit Organizations | 961 | 7.3% |
| Local Government Employees | 552 | 4.2% |
| State Government Employees | 411 | 3.1% |
| Federal Government Employees | 539 | 4.1% |
| Unpaid Family Workers | 26 | 0.2% |
| Total | 13,102 | 100.0% |
Employment Status by Age in Cockeysville
According to the labor force statistics for Cockeysville, out of the total population over 16 years of age (19,470), 72.9% or 14,194 individuals are in the labor force, with 5.0% or 710 of them unemployed. The age group with the highest labor force participation rate is 25 to 29 years, with 94.1% or 2,616 individuals in the labor force. Within the labor force, the 20 to 24 years age range has the highest percentage of unemployed individuals, with 15.8% or 208 of them being unemployed.
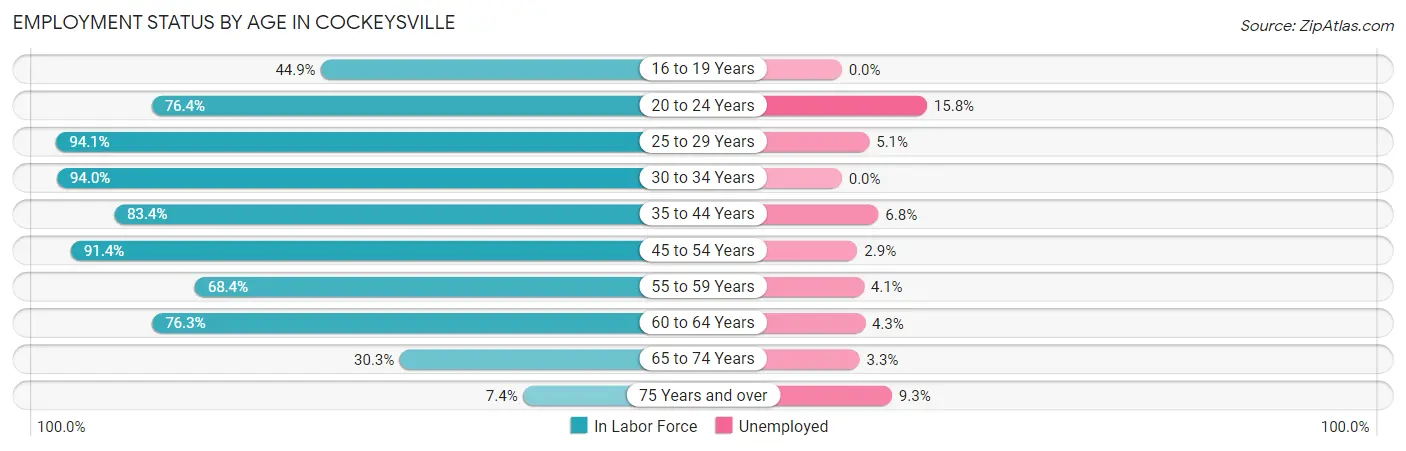
| Age Bracket | In Labor Force | Unemployed |
| 16 to 19 Years | 422 (44.9%) | 0 (0.0%) |
| 20 to 24 Years | 1,315 (76.4%) | 208 (15.8%) |
| 25 to 29 Years | 2,616 (94.1%) | 133 (5.1%) |
| 30 to 34 Years | 2,195 (94.0%) | 0 (0.0%) |
| 35 to 44 Years | 2,788 (83.4%) | 190 (6.8%) |
| 45 to 54 Years | 2,544 (91.4%) | 74 (2.9%) |
| 55 to 59 Years | 845 (68.4%) | 35 (4.1%) |
| 60 to 64 Years | 807 (76.3%) | 35 (4.3%) |
| 65 to 74 Years | 551 (30.3%) | 18 (3.3%) |
| 75 Years and over | 108 (7.4%) | 10 (9.3%) |
| Total | 14,194 (72.9%) | 710 (5.0%) |
Employment Status by Educational Attainment in Cockeysville
According to labor force statistics for Cockeysville, 87.2% of individuals (11,803) out of the total population between 25 and 64 years of age (13,535) are in the labor force, with 4.0% or 472 of them being unemployed. The group with the highest labor force participation rate are those with the educational attainment of college / associate degree, with 92.4% or 2,754 individuals in the labor force. Within the labor force, individuals with high school diploma education have the highest percentage of unemployment, with 6.9% or 150 of them being unemployed.
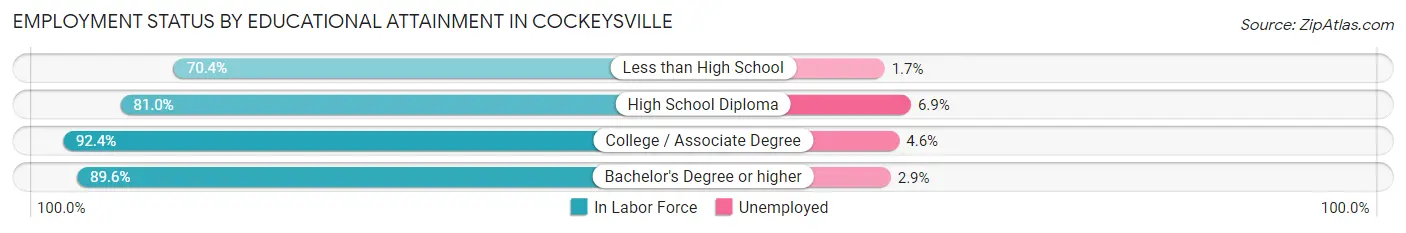
| Educational Attainment | In Labor Force | Unemployed |
| Less than High School | 664 (70.4%) | 16 (1.7%) |
| High School Diploma | 2,180 (81.0%) | 186 (6.9%) |
| College / Associate Degree | 2,754 (92.4%) | 137 (4.6%) |
| Bachelor's Degree or higher | 6,201 (89.6%) | 201 (2.9%) |
| Total | 11,803 (87.2%) | 541 (4.0%) |
Employment Occupations by Sex in Cockeysville
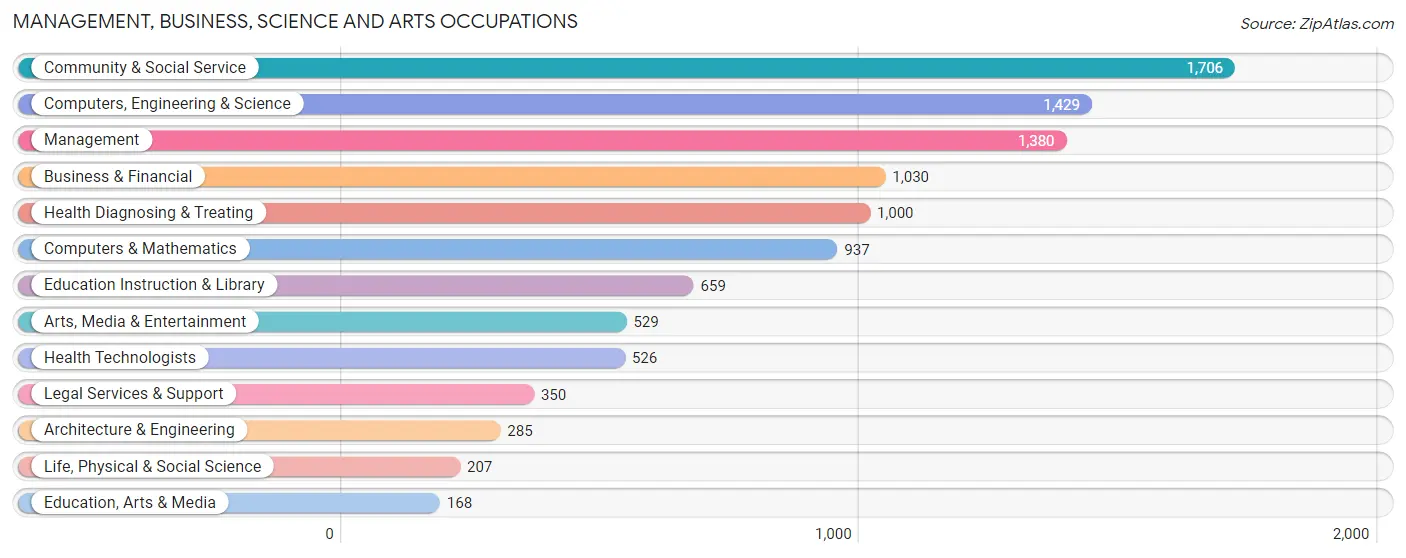
Management, Business, Science and Arts Occupations
The most common Management, Business, Science and Arts occupations in Cockeysville are Community & Social Service (1,706 | 12.7%), Computers, Engineering & Science (1,429 | 10.6%), Management (1,380 | 10.2%), Business & Financial (1,030 | 7.6%), and Health Diagnosing & Treating (1,000 | 7.4%).
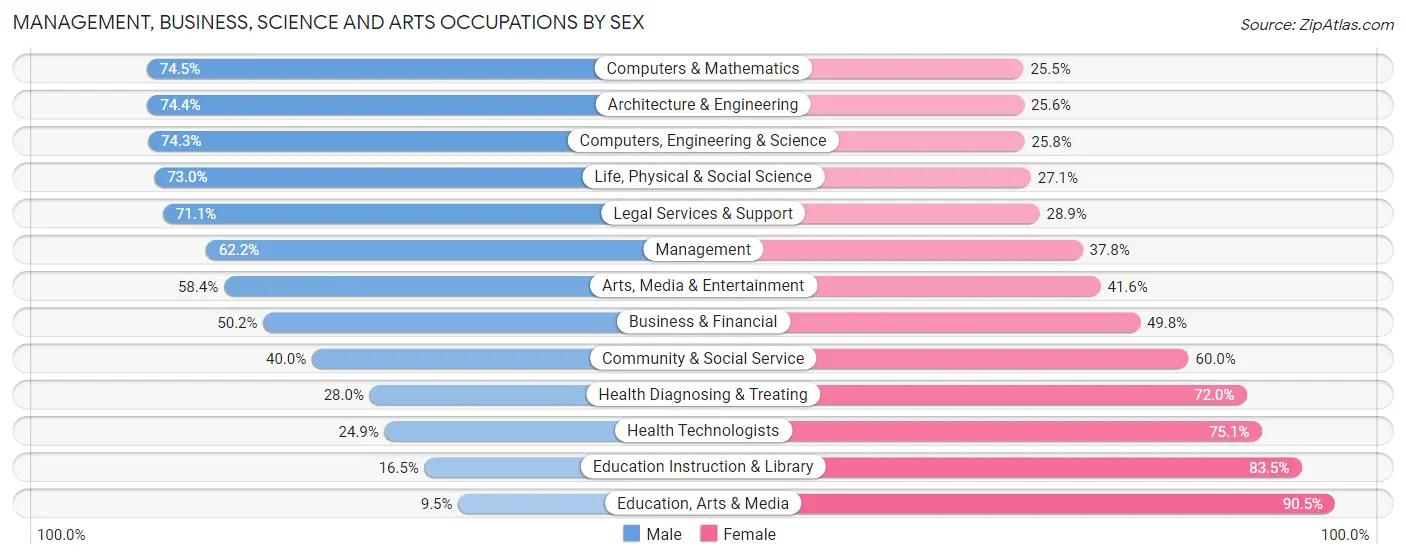
Management, Business, Science and Arts Occupations by Sex
Within the Management, Business, Science and Arts occupations in Cockeysville, the most male-oriented occupations are Computers & Mathematics (74.5%), Architecture & Engineering (74.4%), and Computers, Engineering & Science (74.3%), while the most female-oriented occupations are Education, Arts & Media (90.5%), Education Instruction & Library (83.5%), and Health Technologists (75.1%).
| Occupation | Male | Female |
| Management | 858 (62.2%) | 522 (37.8%) |
| Business & Financial | 517 (50.2%) | 513 (49.8%) |
| Computers, Engineering & Science | 1,061 (74.3%) | 368 (25.8%) |
| Computers & Mathematics | 698 (74.5%) | 239 (25.5%) |
| Architecture & Engineering | 212 (74.4%) | 73 (25.6%) |
| Life, Physical & Social Science | 151 (73.0%) | 56 (27.1%) |
| Community & Social Service | 683 (40.0%) | 1,023 (60.0%) |
| Education, Arts & Media | 16 (9.5%) | 152 (90.5%) |
| Legal Services & Support | 249 (71.1%) | 101 (28.9%) |
| Education Instruction & Library | 109 (16.5%) | 550 (83.5%) |
| Arts, Media & Entertainment | 309 (58.4%) | 220 (41.6%) |
| Health Diagnosing & Treating | 280 (28.0%) | 720 (72.0%) |
| Health Technologists | 131 (24.9%) | 395 (75.1%) |
| Total (Category) | 3,399 (51.9%) | 3,146 (48.1%) |
| Total (Overall) | 7,375 (54.7%) | 6,095 (45.3%) |
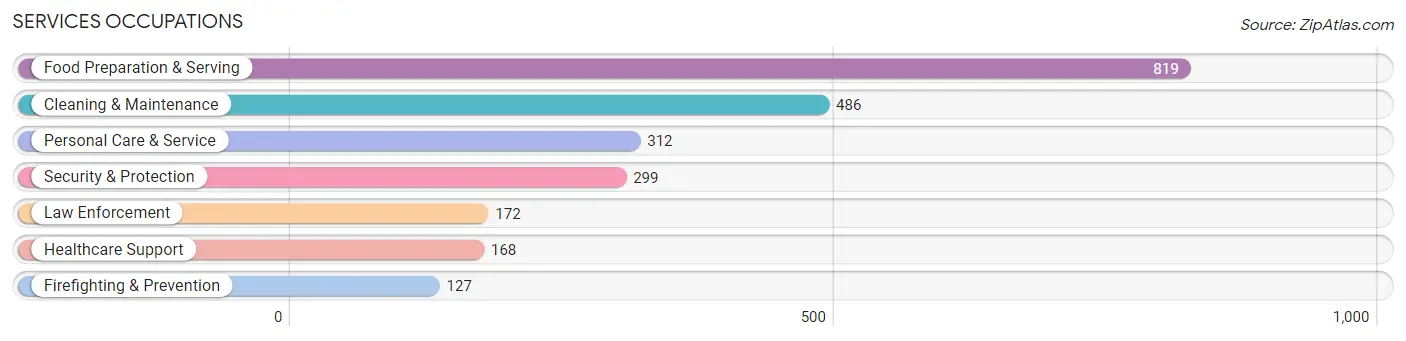
Services Occupations
The most common Services occupations in Cockeysville are Food Preparation & Serving (819 | 6.1%), Cleaning & Maintenance (486 | 3.6%), Personal Care & Service (312 | 2.3%), Security & Protection (299 | 2.2%), and Law Enforcement (172 | 1.3%).
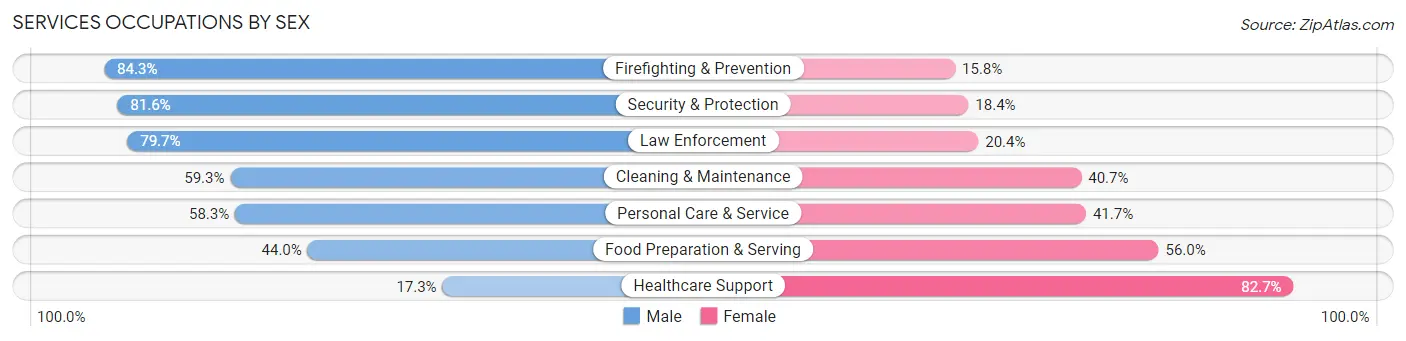
Services Occupations by Sex
Within the Services occupations in Cockeysville, the most male-oriented occupations are Firefighting & Prevention (84.3%), Security & Protection (81.6%), and Law Enforcement (79.6%), while the most female-oriented occupations are Healthcare Support (82.7%), Food Preparation & Serving (56.0%), and Personal Care & Service (41.7%).
| Occupation | Male | Female |
| Healthcare Support | 29 (17.3%) | 139 (82.7%) |
| Security & Protection | 244 (81.6%) | 55 (18.4%) |
| Firefighting & Prevention | 107 (84.3%) | 20 (15.8%) |
| Law Enforcement | 137 (79.6%) | 35 (20.3%) |
| Food Preparation & Serving | 360 (44.0%) | 459 (56.0%) |
| Cleaning & Maintenance | 288 (59.3%) | 198 (40.7%) |
| Personal Care & Service | 182 (58.3%) | 130 (41.7%) |
| Total (Category) | 1,103 (52.9%) | 981 (47.1%) |
| Total (Overall) | 7,375 (54.7%) | 6,095 (45.3%) |
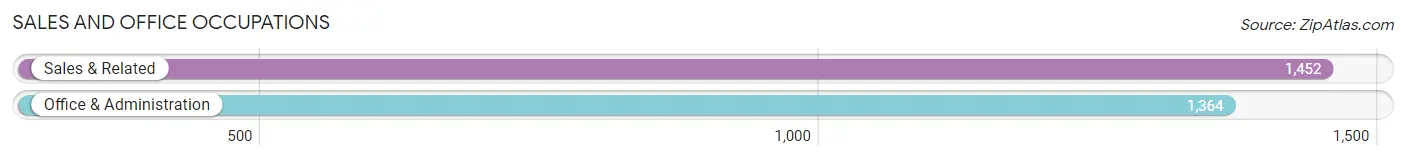
Sales and Office Occupations
The most common Sales and Office occupations in Cockeysville are Sales & Related (1,452 | 10.8%), and Office & Administration (1,364 | 10.1%).
Sales and Office Occupations by Sex
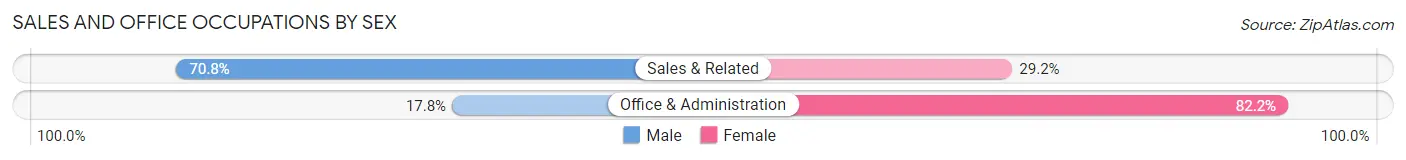
| Occupation | Male | Female |
| Sales & Related | 1,028 (70.8%) | 424 (29.2%) |
| Office & Administration | 243 (17.8%) | 1,121 (82.2%) |
| Total (Category) | 1,271 (45.1%) | 1,545 (54.9%) |
| Total (Overall) | 7,375 (54.7%) | 6,095 (45.3%) |
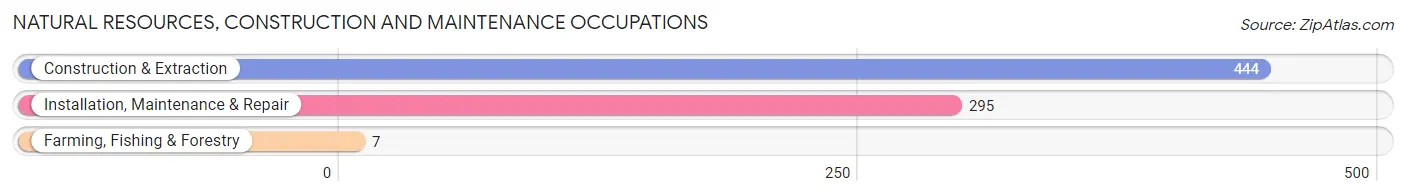
Natural Resources, Construction and Maintenance Occupations
The most common Natural Resources, Construction and Maintenance occupations in Cockeysville are Construction & Extraction (444 | 3.3%), Installation, Maintenance & Repair (295 | 2.2%), and Farming, Fishing & Forestry (7 | 0.1%).
Natural Resources, Construction and Maintenance Occupations by Sex
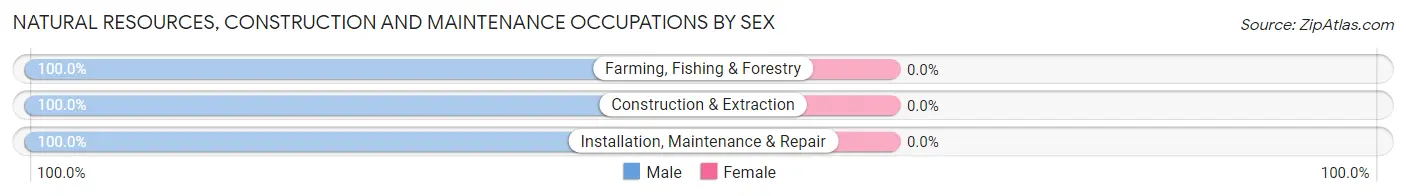
| Occupation | Male | Female |
| Farming, Fishing & Forestry | 7 (100.0%) | 0 (0.0%) |
| Construction & Extraction | 444 (100.0%) | 0 (0.0%) |
| Installation, Maintenance & Repair | 295 (100.0%) | 0 (0.0%) |
| Total (Category) | 746 (100.0%) | 0 (0.0%) |
| Total (Overall) | 7,375 (54.7%) | 6,095 (45.3%) |
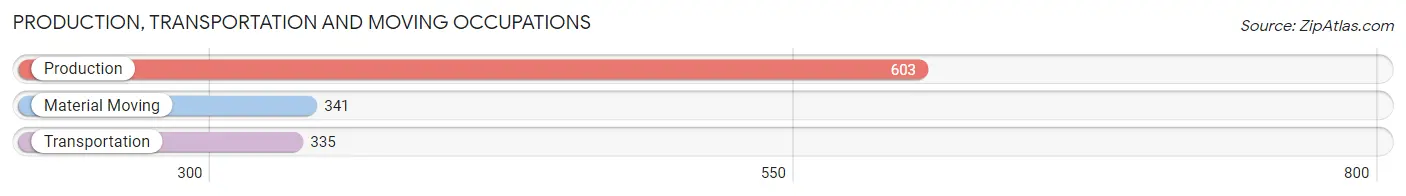
Production, Transportation and Moving Occupations
The most common Production, Transportation and Moving occupations in Cockeysville are Production (603 | 4.5%), Material Moving (341 | 2.5%), and Transportation (335 | 2.5%).
Production, Transportation and Moving Occupations by Sex
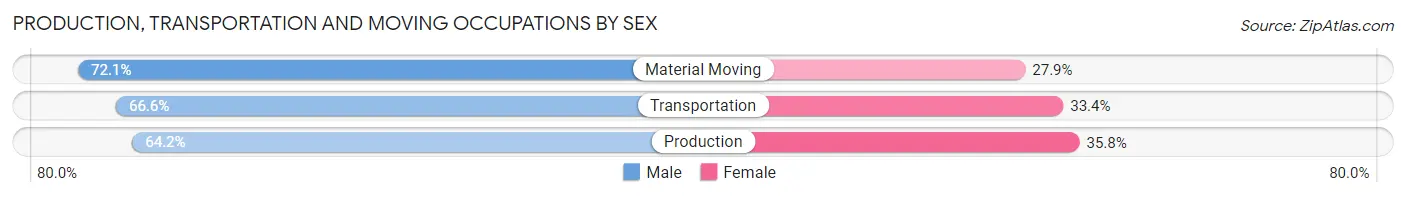
| Occupation | Male | Female |
| Production | 387 (64.2%) | 216 (35.8%) |
| Transportation | 223 (66.6%) | 112 (33.4%) |
| Material Moving | 246 (72.1%) | 95 (27.9%) |
| Total (Category) | 856 (66.9%) | 423 (33.1%) |
| Total (Overall) | 7,375 (54.7%) | 6,095 (45.3%) |
Employment Industries by Sex in Cockeysville
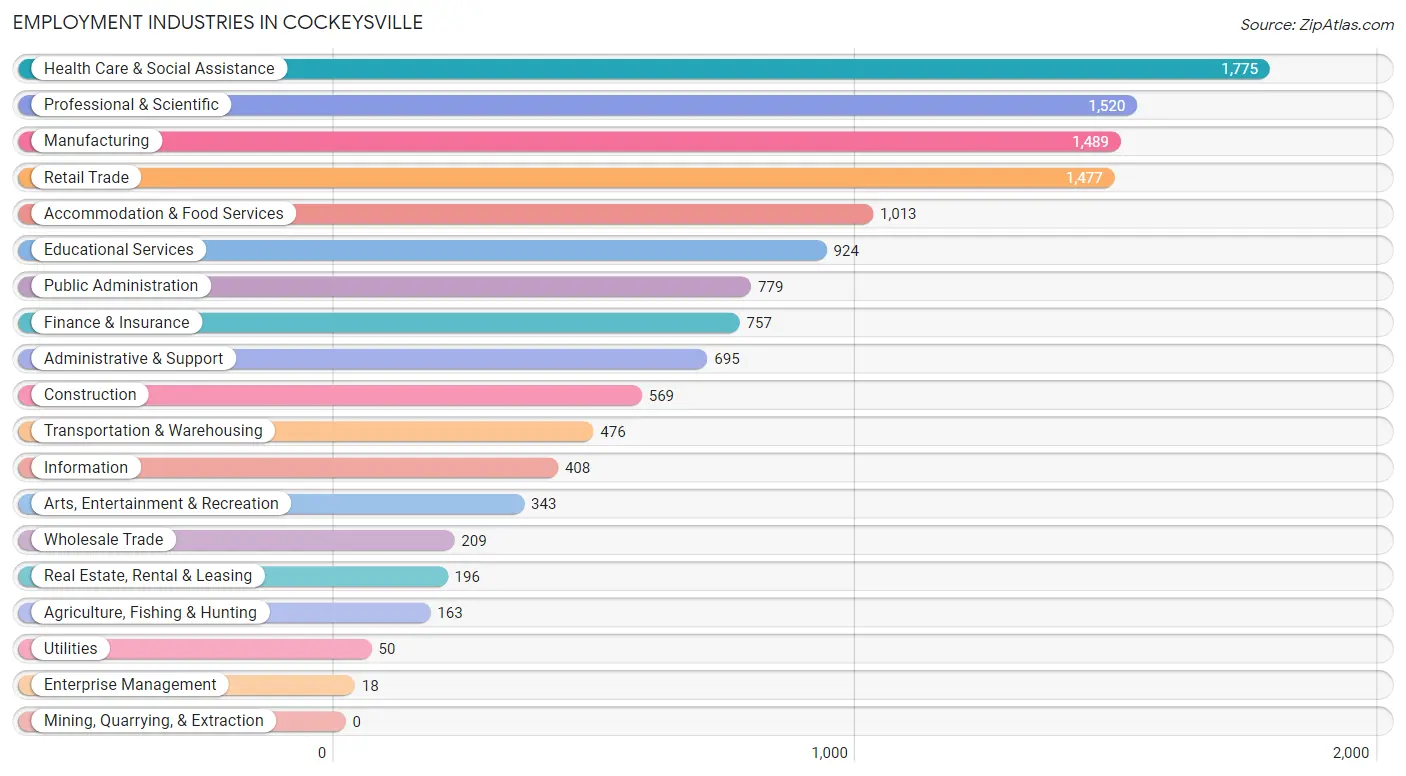
Employment Industries in Cockeysville
The major employment industries in Cockeysville include Health Care & Social Assistance (1,775 | 13.2%), Professional & Scientific (1,520 | 11.3%), Manufacturing (1,489 | 11.1%), Retail Trade (1,477 | 11.0%), and Accommodation & Food Services (1,013 | 7.5%).
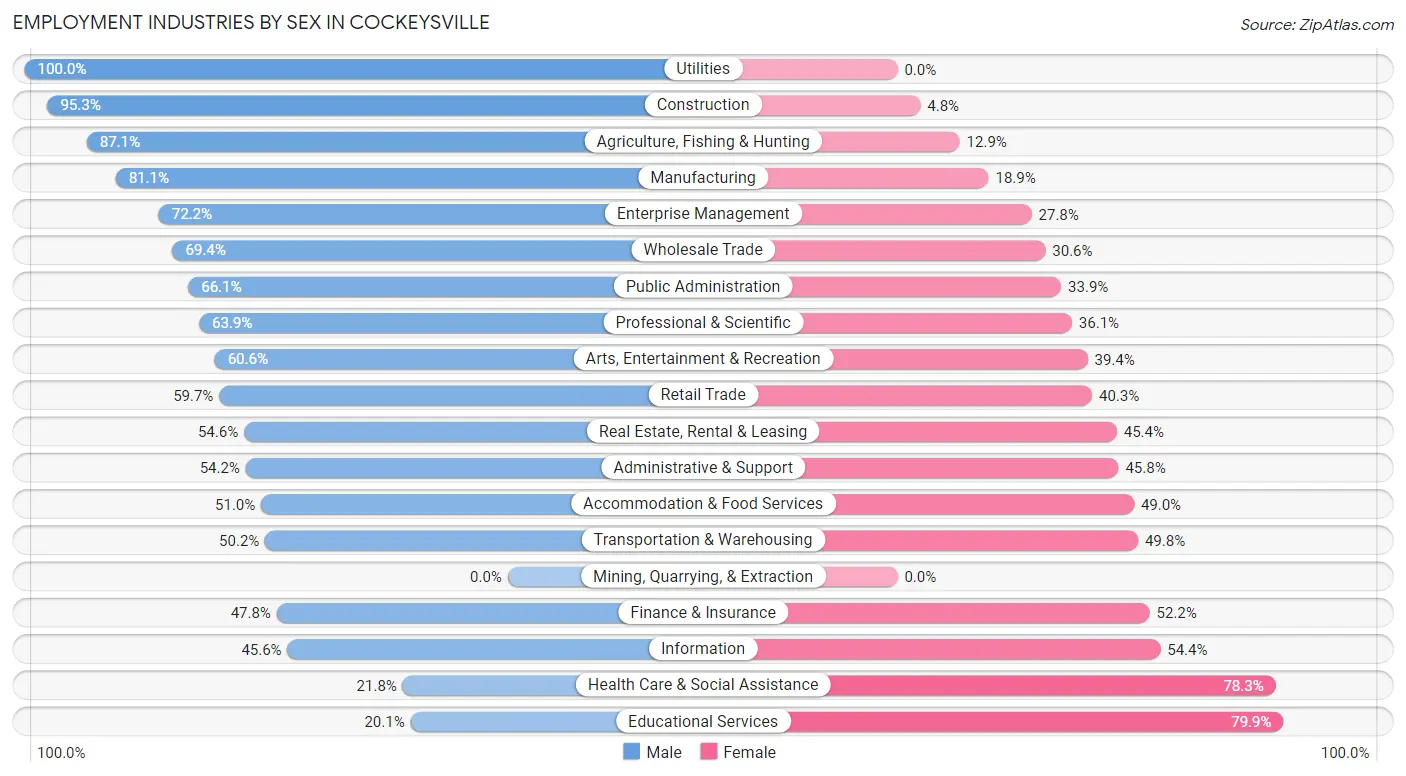
Employment Industries by Sex in Cockeysville
The Cockeysville industries that see more men than women are Utilities (100.0%), Construction (95.3%), and Agriculture, Fishing & Hunting (87.1%), whereas the industries that tend to have a higher number of women are Educational Services (79.9%), Health Care & Social Assistance (78.2%), and Information (54.4%).
| Industry | Male | Female |
| Agriculture, Fishing & Hunting | 142 (87.1%) | 21 (12.9%) |
| Mining, Quarrying, & Extraction | 0 (0.0%) | 0 (0.0%) |
| Construction | 542 (95.3%) | 27 (4.8%) |
| Manufacturing | 1,208 (81.1%) | 281 (18.9%) |
| Wholesale Trade | 145 (69.4%) | 64 (30.6%) |
| Retail Trade | 882 (59.7%) | 595 (40.3%) |
| Transportation & Warehousing | 239 (50.2%) | 237 (49.8%) |
| Utilities | 50 (100.0%) | 0 (0.0%) |
| Information | 186 (45.6%) | 222 (54.4%) |
| Finance & Insurance | 362 (47.8%) | 395 (52.2%) |
| Real Estate, Rental & Leasing | 107 (54.6%) | 89 (45.4%) |
| Professional & Scientific | 971 (63.9%) | 549 (36.1%) |
| Enterprise Management | 13 (72.2%) | 5 (27.8%) |
| Administrative & Support | 377 (54.2%) | 318 (45.8%) |
| Educational Services | 186 (20.1%) | 738 (79.9%) |
| Health Care & Social Assistance | 386 (21.7%) | 1,389 (78.2%) |
| Arts, Entertainment & Recreation | 208 (60.6%) | 135 (39.4%) |
| Accommodation & Food Services | 517 (51.0%) | 496 (49.0%) |
| Public Administration | 515 (66.1%) | 264 (33.9%) |
| Total | 7,375 (54.7%) | 6,095 (45.3%) |
Education in Cockeysville
School Enrollment in Cockeysville
The most common levels of schooling among the 4,957 students in Cockeysville are college / undergraduate (1,385 | 27.9%), middle school (889 | 17.9%), and elementary school (850 | 17.2%).
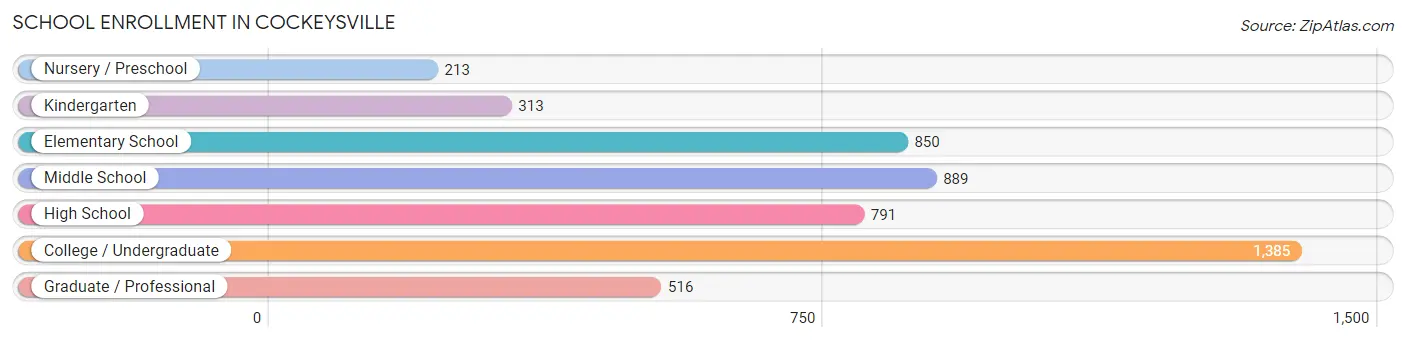
| School Level | # Students | % Students |
| Nursery / Preschool | 213 | 4.3% |
| Kindergarten | 313 | 6.3% |
| Elementary School | 850 | 17.2% |
| Middle School | 889 | 17.9% |
| High School | 791 | 16.0% |
| College / Undergraduate | 1,385 | 27.9% |
| Graduate / Professional | 516 | 10.4% |
| Total | 4,957 | 100.0% |
School Enrollment by Age by Funding Source in Cockeysville
Out of a total of 4,957 students who are enrolled in schools in Cockeysville, 749 (15.1%) attend a private institution, while the remaining 4,208 (84.9%) are enrolled in public schools. The age group of 18 to 19 year olds has the highest likelihood of being enrolled in private schools, with 66 (23.2% in the age bracket) enrolled. Conversely, the age group of 10 to 14 year olds has the lowest likelihood of being enrolled in a private school, with 1,106 (93.2% in the age bracket) attending a public institution.
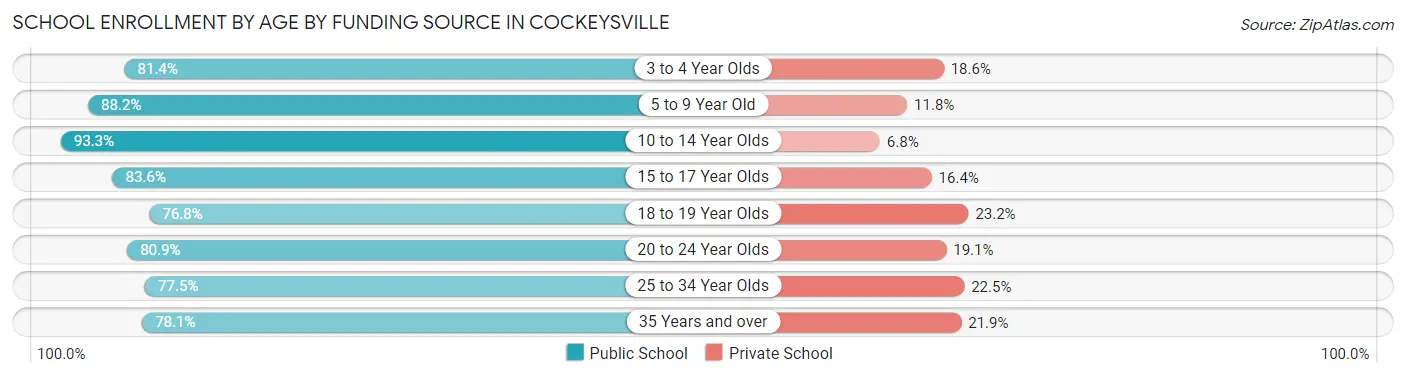
| Age Bracket | Public School | Private School |
| 3 to 4 Year Olds | 179 (81.4%) | 41 (18.6%) |
| 5 to 9 Year Old | 880 (88.2%) | 118 (11.8%) |
| 10 to 14 Year Olds | 1,106 (93.2%) | 80 (6.8%) |
| 15 to 17 Year Olds | 495 (83.6%) | 97 (16.4%) |
| 18 to 19 Year Olds | 218 (76.8%) | 66 (23.2%) |
| 20 to 24 Year Olds | 660 (80.9%) | 156 (19.1%) |
| 25 to 34 Year Olds | 473 (77.5%) | 137 (22.5%) |
| 35 Years and over | 196 (78.1%) | 55 (21.9%) |
| Total | 4,208 (84.9%) | 749 (15.1%) |
Educational Attainment by Field of Study in Cockeysville
Business (1,392 | 15.8%), science & technology (757 | 8.6%), social sciences (751 | 8.5%), education (736 | 8.4%), and arts & humanities (713 | 8.1%) are the most common fields of study among 8,817 individuals in Cockeysville who have obtained a bachelor's degree or higher.
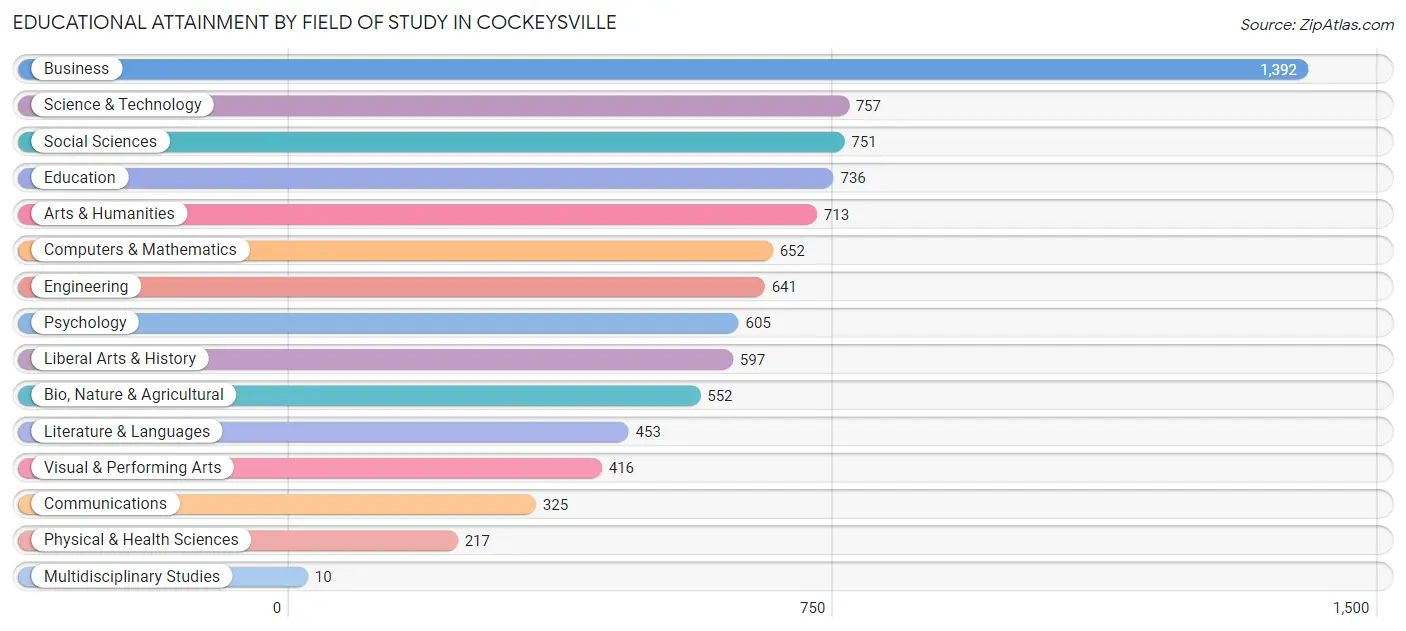
| Field of Study | # Graduates | % Graduates |
| Computers & Mathematics | 652 | 7.4% |
| Bio, Nature & Agricultural | 552 | 6.3% |
| Physical & Health Sciences | 217 | 2.5% |
| Psychology | 605 | 6.9% |
| Social Sciences | 751 | 8.5% |
| Engineering | 641 | 7.3% |
| Multidisciplinary Studies | 10 | 0.1% |
| Science & Technology | 757 | 8.6% |
| Business | 1,392 | 15.8% |
| Education | 736 | 8.4% |
| Literature & Languages | 453 | 5.1% |
| Liberal Arts & History | 597 | 6.8% |
| Visual & Performing Arts | 416 | 4.7% |
| Communications | 325 | 3.7% |
| Arts & Humanities | 713 | 8.1% |
| Total | 8,817 | 100.0% |
Transportation & Commute in Cockeysville
Vehicle Availability by Sex in Cockeysville
The most prevalent vehicle ownership categories in Cockeysville are males with 2 vehicles (3,335, accounting for 46.0%) and females with 2 vehicles (2,540, making up 57.1%).
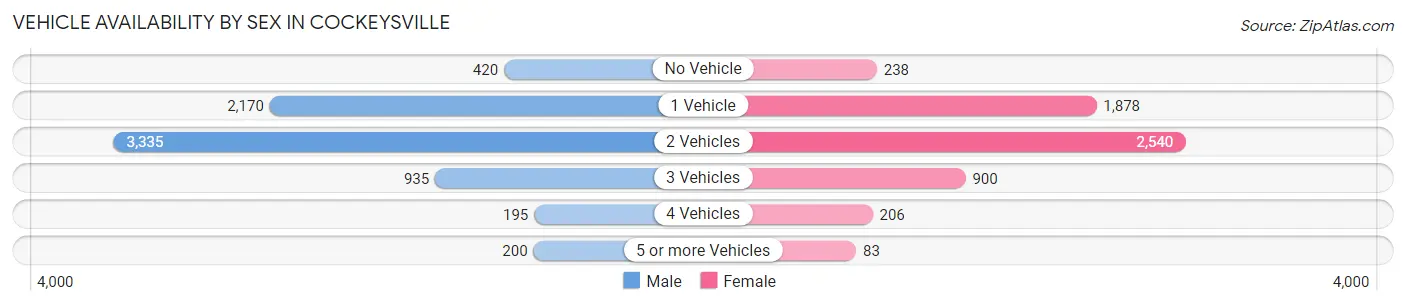
| Vehicles Available | Male | Female |
| No Vehicle | 420 (5.8%) | 238 (4.1%) |
| 1 Vehicle | 2,170 (29.9%) | 1,878 (32.1%) |
| 2 Vehicles | 3,335 (46.0%) | 2,540 (43.5%) |
| 3 Vehicles | 935 (12.9%) | 900 (15.4%) |
| 4 Vehicles | 195 (2.7%) | 206 (3.5%) |
| 5 or more Vehicles | 200 (2.8%) | 83 (1.4%) |
| Total | 7,255 (100.0%) | 5,845 (100.0%) |
Commute Time in Cockeysville
The most frequently occuring commute durations in Cockeysville are 15 to 19 minutes (2,043 commuters, 17.6%), 10 to 14 minutes (1,953 commuters, 16.8%), and 30 to 34 minutes (1,771 commuters, 15.2%).
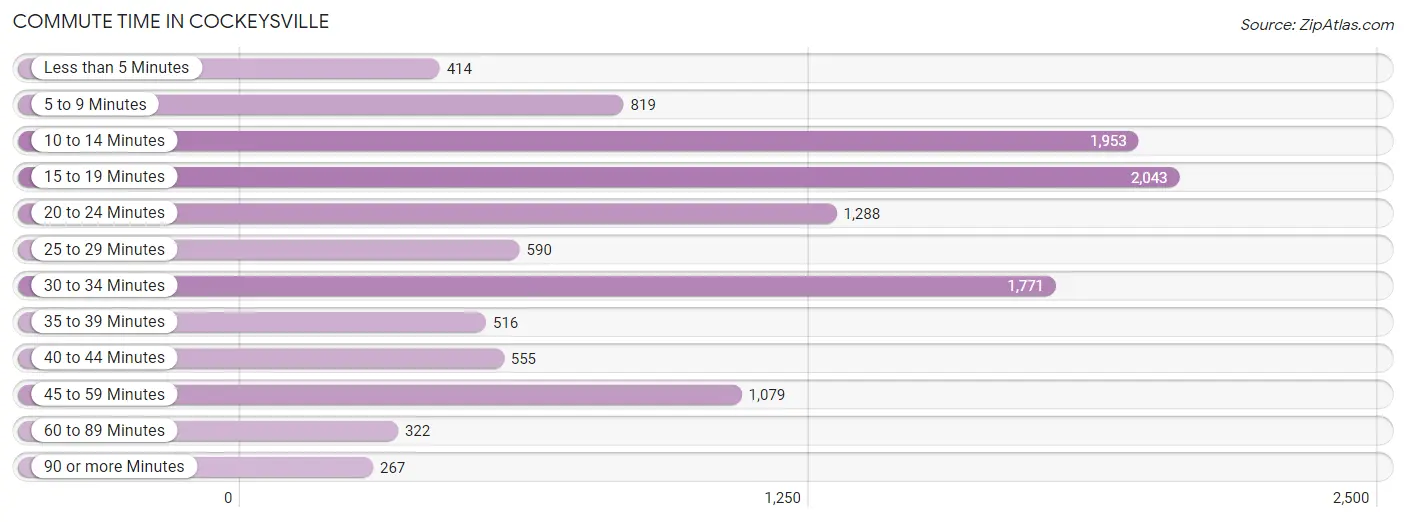
| Commute Time | # Commuters | % Commuters |
| Less than 5 Minutes | 414 | 3.6% |
| 5 to 9 Minutes | 819 | 7.0% |
| 10 to 14 Minutes | 1,953 | 16.8% |
| 15 to 19 Minutes | 2,043 | 17.6% |
| 20 to 24 Minutes | 1,288 | 11.1% |
| 25 to 29 Minutes | 590 | 5.1% |
| 30 to 34 Minutes | 1,771 | 15.2% |
| 35 to 39 Minutes | 516 | 4.4% |
| 40 to 44 Minutes | 555 | 4.8% |
| 45 to 59 Minutes | 1,079 | 9.3% |
| 60 to 89 Minutes | 322 | 2.8% |
| 90 or more Minutes | 267 | 2.3% |
Commute Time by Sex in Cockeysville
The most common commute times in Cockeysville are 15 to 19 minutes (1,146 commuters, 17.7%) for males and 10 to 14 minutes (954 commuters, 18.5%) for females.
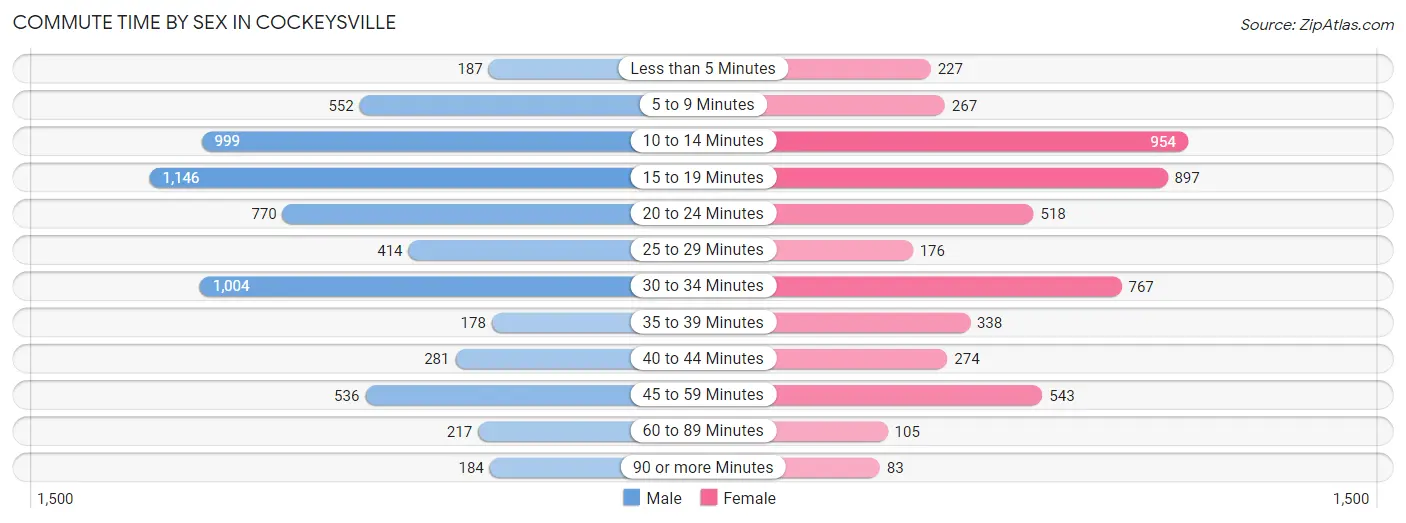
| Commute Time | Male | Female |
| Less than 5 Minutes | 187 (2.9%) | 227 (4.4%) |
| 5 to 9 Minutes | 552 (8.5%) | 267 (5.2%) |
| 10 to 14 Minutes | 999 (15.4%) | 954 (18.5%) |
| 15 to 19 Minutes | 1,146 (17.7%) | 897 (17.4%) |
| 20 to 24 Minutes | 770 (11.9%) | 518 (10.1%) |
| 25 to 29 Minutes | 414 (6.4%) | 176 (3.4%) |
| 30 to 34 Minutes | 1,004 (15.5%) | 767 (14.9%) |
| 35 to 39 Minutes | 178 (2.8%) | 338 (6.6%) |
| 40 to 44 Minutes | 281 (4.3%) | 274 (5.3%) |
| 45 to 59 Minutes | 536 (8.3%) | 543 (10.5%) |
| 60 to 89 Minutes | 217 (3.4%) | 105 (2.0%) |
| 90 or more Minutes | 184 (2.8%) | 83 (1.6%) |
Time of Departure to Work by Sex in Cockeysville
The most frequent times of departure to work in Cockeysville are 7:00 AM to 7:29 AM (789, 12.2%) for males and 8:00 AM to 8:29 AM (747, 14.5%) for females.
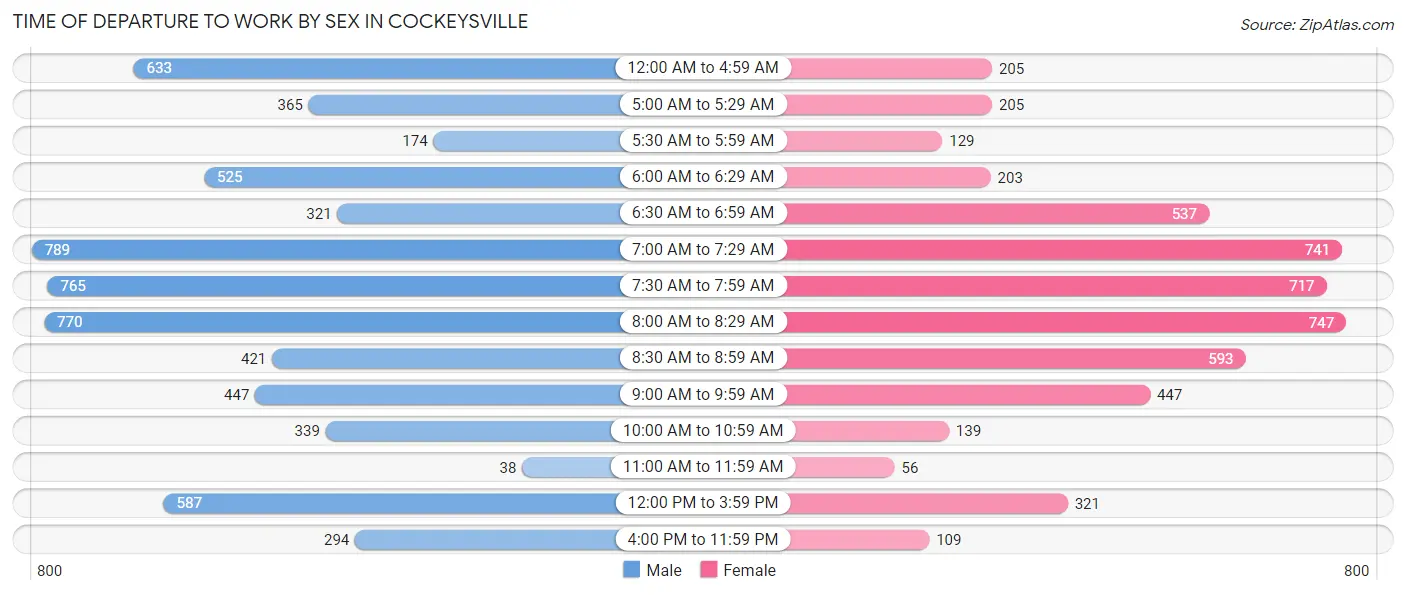
| Time of Departure | Male | Female |
| 12:00 AM to 4:59 AM | 633 (9.8%) | 205 (4.0%) |
| 5:00 AM to 5:29 AM | 365 (5.6%) | 205 (4.0%) |
| 5:30 AM to 5:59 AM | 174 (2.7%) | 129 (2.5%) |
| 6:00 AM to 6:29 AM | 525 (8.1%) | 203 (3.9%) |
| 6:30 AM to 6:59 AM | 321 (5.0%) | 537 (10.4%) |
| 7:00 AM to 7:29 AM | 789 (12.2%) | 741 (14.4%) |
| 7:30 AM to 7:59 AM | 765 (11.8%) | 717 (13.9%) |
| 8:00 AM to 8:29 AM | 770 (11.9%) | 747 (14.5%) |
| 8:30 AM to 8:59 AM | 421 (6.5%) | 593 (11.5%) |
| 9:00 AM to 9:59 AM | 447 (6.9%) | 447 (8.7%) |
| 10:00 AM to 10:59 AM | 339 (5.2%) | 139 (2.7%) |
| 11:00 AM to 11:59 AM | 38 (0.6%) | 56 (1.1%) |
| 12:00 PM to 3:59 PM | 587 (9.1%) | 321 (6.2%) |
| 4:00 PM to 11:59 PM | 294 (4.5%) | 109 (2.1%) |
| Total | 6,468 (100.0%) | 5,149 (100.0%) |
Housing Occupancy in Cockeysville
Occupancy by Ownership in Cockeysville
Of the total 10,305 dwellings in Cockeysville, owner-occupied units account for 3,650 (35.4%), while renter-occupied units make up 6,655 (64.6%).
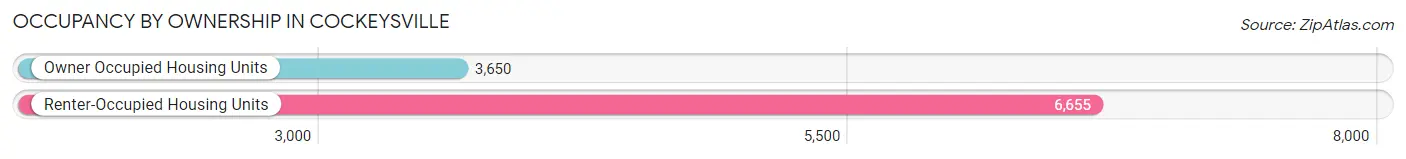
| Occupancy | # Housing Units | % Housing Units |
| Owner Occupied Housing Units | 3,650 | 35.4% |
| Renter-Occupied Housing Units | 6,655 | 64.6% |
| Total Occupied Housing Units | 10,305 | 100.0% |
Occupancy by Household Size in Cockeysville
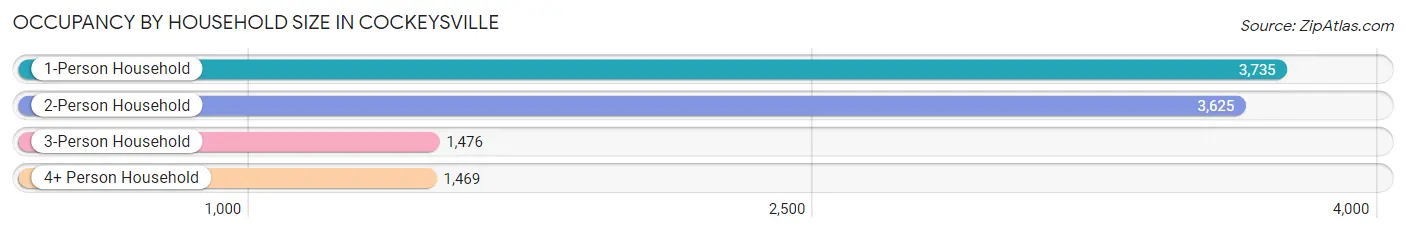
| Household Size | # Housing Units | % Housing Units |
| 1-Person Household | 3,735 | 36.2% |
| 2-Person Household | 3,625 | 35.2% |
| 3-Person Household | 1,476 | 14.3% |
| 4+ Person Household | 1,469 | 14.3% |
| Total Housing Units | 10,305 | 100.0% |
Occupancy by Ownership by Household Size in Cockeysville
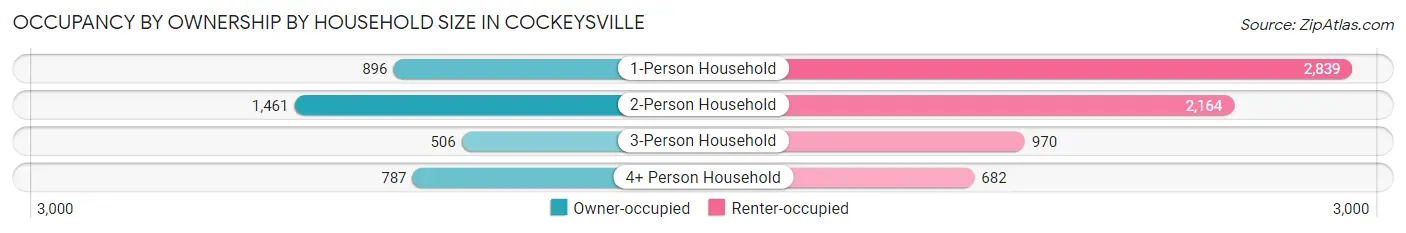
| Household Size | Owner-occupied | Renter-occupied |
| 1-Person Household | 896 (24.0%) | 2,839 (76.0%) |
| 2-Person Household | 1,461 (40.3%) | 2,164 (59.7%) |
| 3-Person Household | 506 (34.3%) | 970 (65.7%) |
| 4+ Person Household | 787 (53.6%) | 682 (46.4%) |
| Total Housing Units | 3,650 (35.4%) | 6,655 (64.6%) |
Occupancy by Educational Attainment in Cockeysville
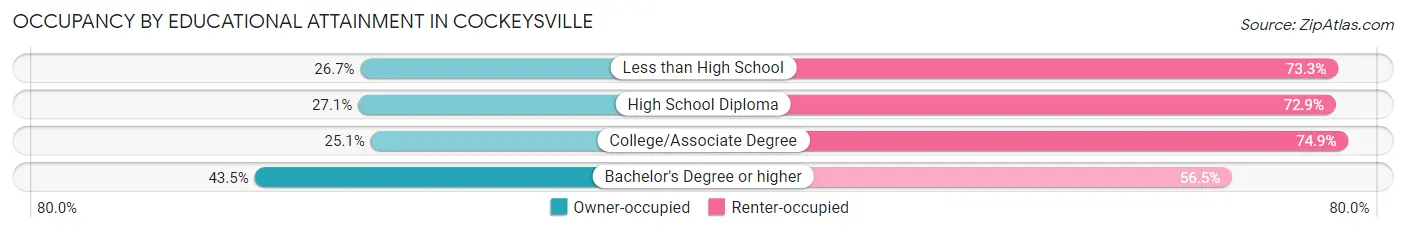
| Household Size | Owner-occupied | Renter-occupied |
| Less than High School | 138 (26.7%) | 378 (73.3%) |
| High School Diploma | 471 (27.1%) | 1,267 (72.9%) |
| College/Associate Degree | 633 (25.1%) | 1,887 (74.9%) |
| Bachelor's Degree or higher | 2,408 (43.5%) | 3,123 (56.5%) |
Occupancy by Age of Householder in Cockeysville
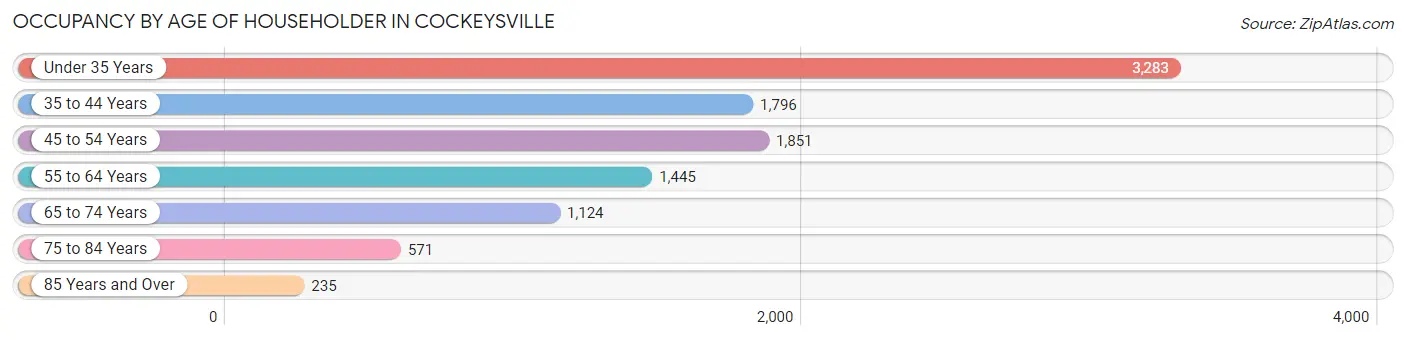
| Age Bracket | # Households | % Households |
| Under 35 Years | 3,283 | 31.9% |
| 35 to 44 Years | 1,796 | 17.4% |
| 45 to 54 Years | 1,851 | 18.0% |
| 55 to 64 Years | 1,445 | 14.0% |
| 65 to 74 Years | 1,124 | 10.9% |
| 75 to 84 Years | 571 | 5.5% |
| 85 Years and Over | 235 | 2.3% |
| Total | 10,305 | 100.0% |
Housing Finances in Cockeysville
Median Income by Occupancy in Cockeysville
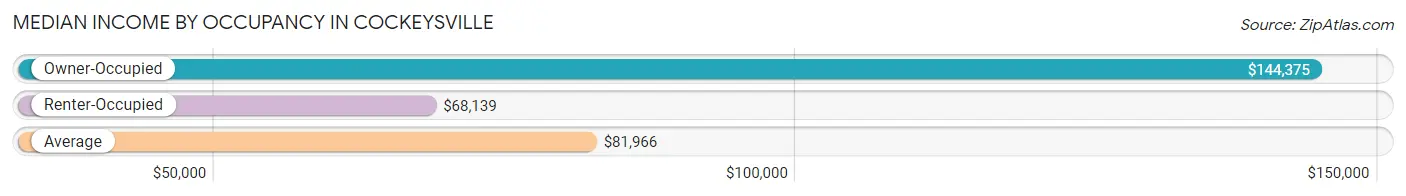
| Occupancy Type | # Households | Median Income |
| Owner-Occupied | 3,650 (35.4%) | $144,375 |
| Renter-Occupied | 6,655 (64.6%) | $68,139 |
| Average | 10,305 (100.0%) | $81,966 |
Occupancy by Householder Income Bracket in Cockeysville
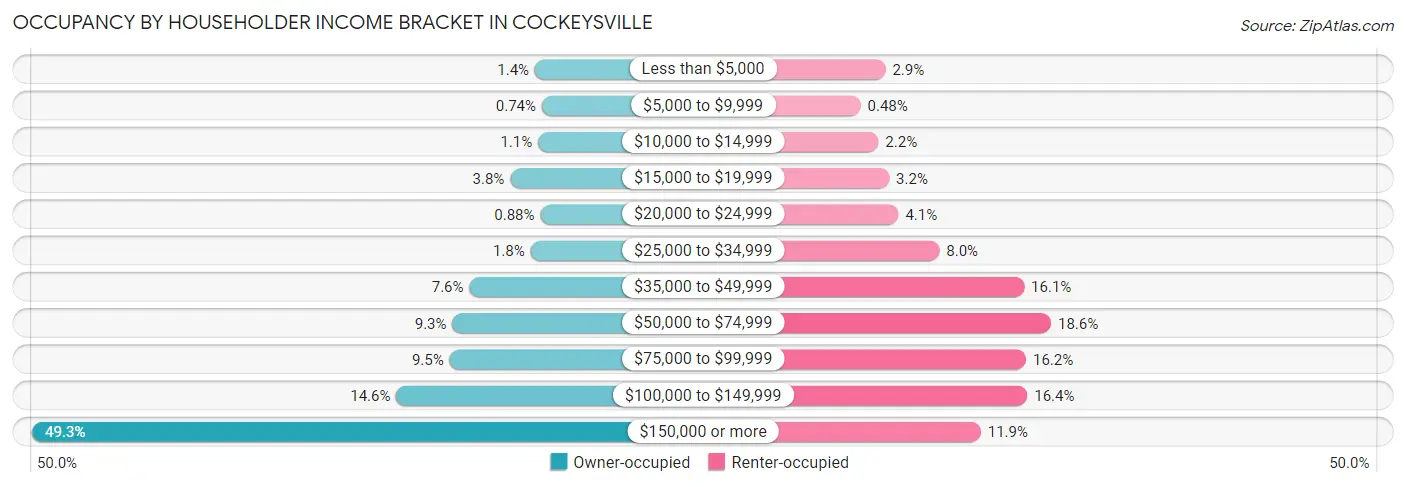
| Income Bracket | Owner-occupied | Renter-occupied |
| Less than $5,000 | 51 (1.4%) | 190 (2.9%) |
| $5,000 to $9,999 | 27 (0.7%) | 32 (0.5%) |
| $10,000 to $14,999 | 40 (1.1%) | 145 (2.2%) |
| $15,000 to $19,999 | 137 (3.7%) | 213 (3.2%) |
| $20,000 to $24,999 | 32 (0.9%) | 272 (4.1%) |
| $25,000 to $34,999 | 66 (1.8%) | 531 (8.0%) |
| $35,000 to $49,999 | 279 (7.6%) | 1,069 (16.1%) |
| $50,000 to $74,999 | 338 (9.3%) | 1,239 (18.6%) |
| $75,000 to $99,999 | 348 (9.5%) | 1,081 (16.2%) |
| $100,000 to $149,999 | 533 (14.6%) | 1,089 (16.4%) |
| $150,000 or more | 1,799 (49.3%) | 794 (11.9%) |
| Total | 3,650 (100.0%) | 6,655 (100.0%) |
Monthly Housing Cost Tiers in Cockeysville
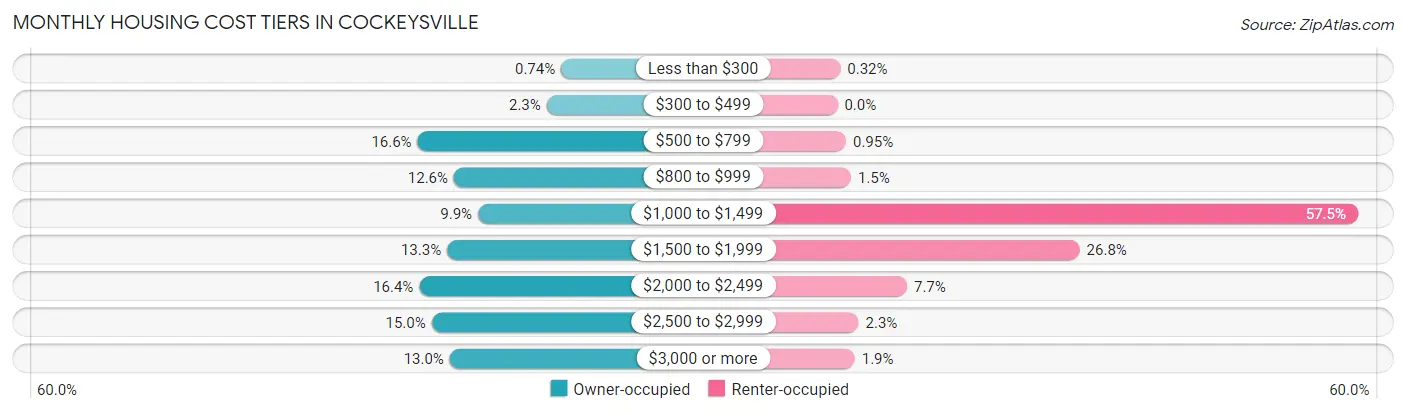
| Monthly Cost | Owner-occupied | Renter-occupied |
| Less than $300 | 27 (0.7%) | 21 (0.3%) |
| $300 to $499 | 85 (2.3%) | 0 (0.0%) |
| $500 to $799 | 606 (16.6%) | 63 (0.9%) |
| $800 to $999 | 459 (12.6%) | 100 (1.5%) |
| $1,000 to $1,499 | 362 (9.9%) | 3,825 (57.5%) |
| $1,500 to $1,999 | 487 (13.3%) | 1,781 (26.8%) |
| $2,000 to $2,499 | 599 (16.4%) | 512 (7.7%) |
| $2,500 to $2,999 | 549 (15.0%) | 156 (2.3%) |
| $3,000 or more | 476 (13.0%) | 128 (1.9%) |
| Total | 3,650 (100.0%) | 6,655 (100.0%) |
Physical Housing Characteristics in Cockeysville
Housing Structures in Cockeysville
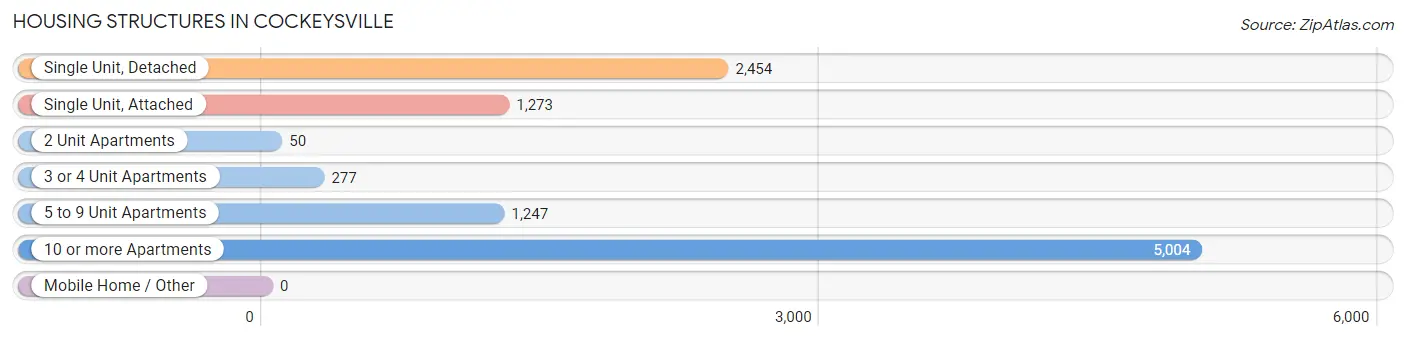
| Structure Type | # Housing Units | % Housing Units |
| Single Unit, Detached | 2,454 | 23.8% |
| Single Unit, Attached | 1,273 | 12.3% |
| 2 Unit Apartments | 50 | 0.5% |
| 3 or 4 Unit Apartments | 277 | 2.7% |
| 5 to 9 Unit Apartments | 1,247 | 12.1% |
| 10 or more Apartments | 5,004 | 48.6% |
| Mobile Home / Other | 0 | 0.0% |
| Total | 10,305 | 100.0% |
Housing Structures by Occupancy in Cockeysville
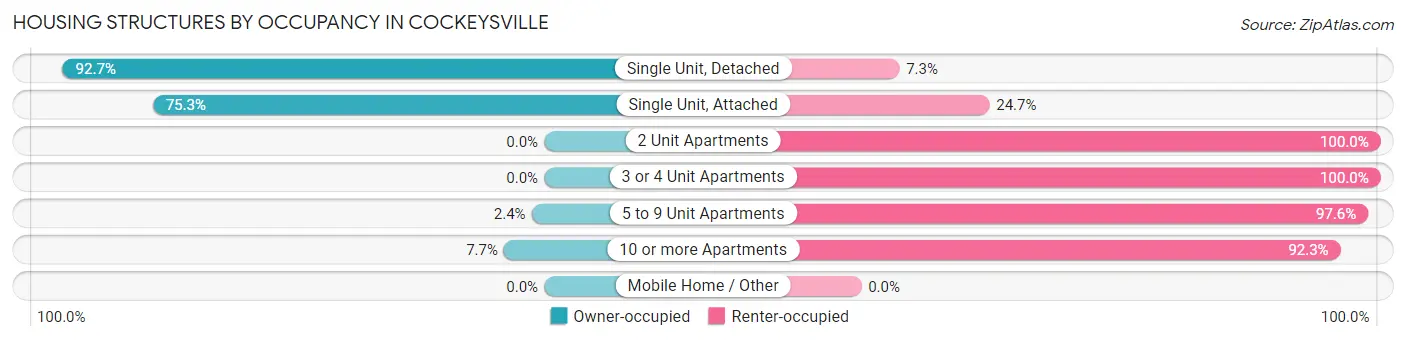
| Structure Type | Owner-occupied | Renter-occupied |
| Single Unit, Detached | 2,274 (92.7%) | 180 (7.3%) |
| Single Unit, Attached | 959 (75.3%) | 314 (24.7%) |
| 2 Unit Apartments | 0 (0.0%) | 50 (100.0%) |
| 3 or 4 Unit Apartments | 0 (0.0%) | 277 (100.0%) |
| 5 to 9 Unit Apartments | 30 (2.4%) | 1,217 (97.6%) |
| 10 or more Apartments | 387 (7.7%) | 4,617 (92.3%) |
| Mobile Home / Other | 0 (0.0%) | 0 (0.0%) |
| Total | 3,650 (35.4%) | 6,655 (64.6%) |
Housing Structures by Number of Rooms in Cockeysville
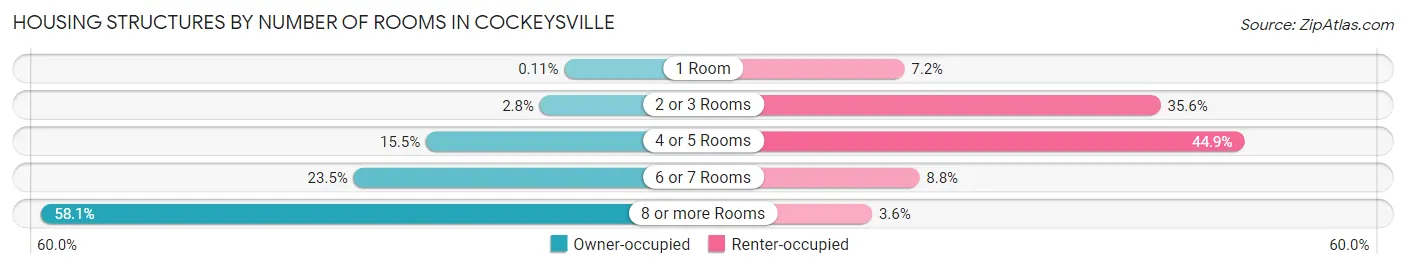
| Number of Rooms | Owner-occupied | Renter-occupied |
| 1 Room | 4 (0.1%) | 476 (7.1%) |
| 2 or 3 Rooms | 103 (2.8%) | 2,368 (35.6%) |
| 4 or 5 Rooms | 564 (15.4%) | 2,987 (44.9%) |
| 6 or 7 Rooms | 857 (23.5%) | 587 (8.8%) |
| 8 or more Rooms | 2,122 (58.1%) | 237 (3.6%) |
| Total | 3,650 (100.0%) | 6,655 (100.0%) |
Housing Structure by Heating Type in Cockeysville
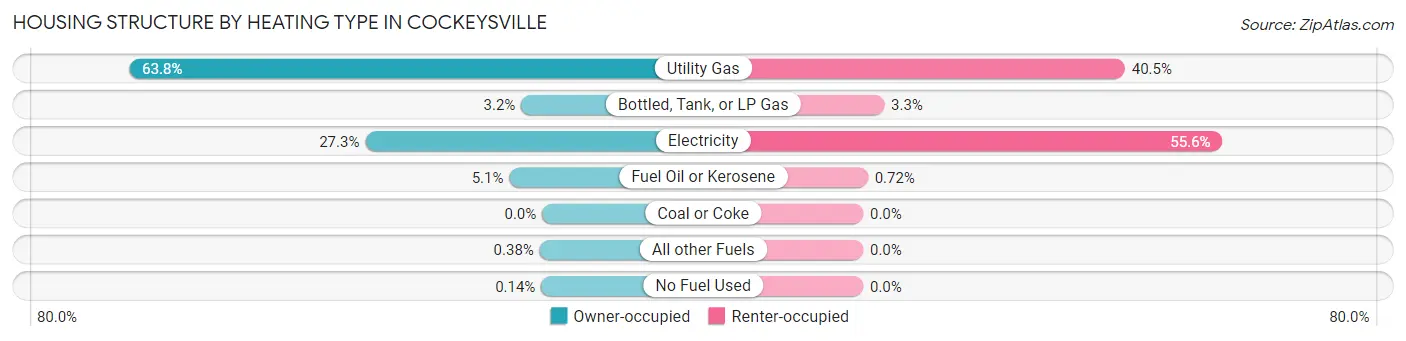
| Heating Type | Owner-occupied | Renter-occupied |
| Utility Gas | 2,330 (63.8%) | 2,693 (40.5%) |
| Bottled, Tank, or LP Gas | 118 (3.2%) | 217 (3.3%) |
| Electricity | 998 (27.3%) | 3,697 (55.5%) |
| Fuel Oil or Kerosene | 185 (5.1%) | 48 (0.7%) |
| Coal or Coke | 0 (0.0%) | 0 (0.0%) |
| All other Fuels | 14 (0.4%) | 0 (0.0%) |
| No Fuel Used | 5 (0.1%) | 0 (0.0%) |
| Total | 3,650 (100.0%) | 6,655 (100.0%) |
Household Vehicle Usage in Cockeysville
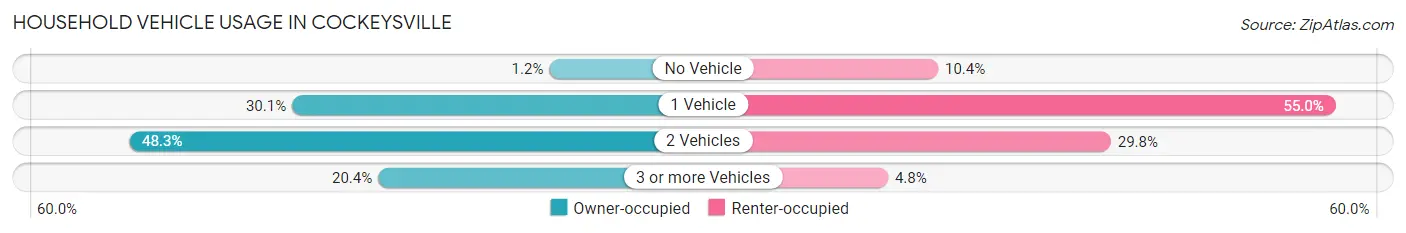
| Vehicles per Household | Owner-occupied | Renter-occupied |
| No Vehicle | 45 (1.2%) | 694 (10.4%) |
| 1 Vehicle | 1,097 (30.0%) | 3,658 (55.0%) |
| 2 Vehicles | 1,763 (48.3%) | 1,982 (29.8%) |
| 3 or more Vehicles | 745 (20.4%) | 321 (4.8%) |
| Total | 3,650 (100.0%) | 6,655 (100.0%) |
Real Estate & Mortgages in Cockeysville
Real Estate and Mortgage Overview in Cockeysville
| Characteristic | Without Mortgage | With Mortgage |
| Housing Units | 1,314 | 2,336 |
| Median Property Value | $385,600 | $380,000 |
| Median Household Income | $103,182 | $1,317 |
| Monthly Housing Costs | $798 | $476 |
| Real Estate Taxes | $4,442 | $26 |
Property Value by Mortgage Status in Cockeysville
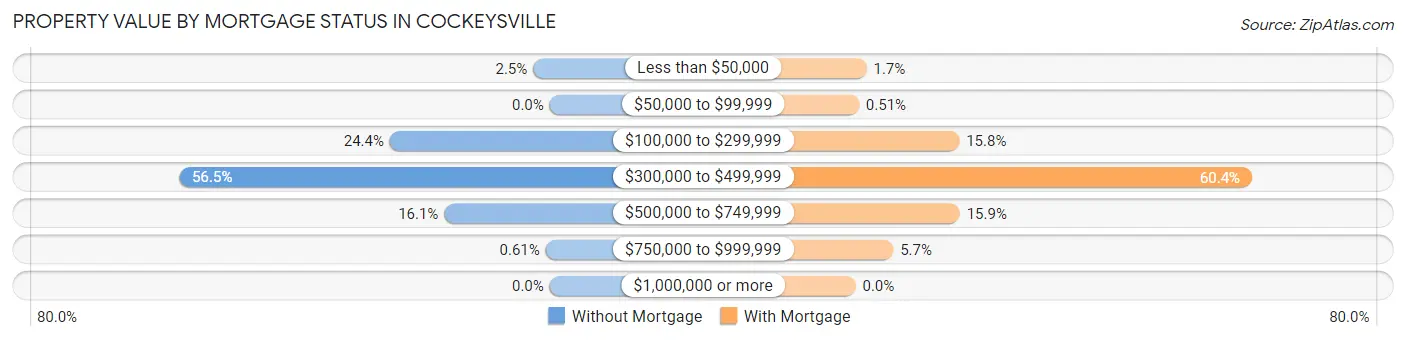
| Property Value | Without Mortgage | With Mortgage |
| Less than $50,000 | 33 (2.5%) | 39 (1.7%) |
| $50,000 to $99,999 | 0 (0.0%) | 12 (0.5%) |
| $100,000 to $299,999 | 320 (24.3%) | 369 (15.8%) |
| $300,000 to $499,999 | 742 (56.5%) | 1,411 (60.4%) |
| $500,000 to $749,999 | 211 (16.1%) | 371 (15.9%) |
| $750,000 to $999,999 | 8 (0.6%) | 134 (5.7%) |
| $1,000,000 or more | 0 (0.0%) | 0 (0.0%) |
| Total | 1,314 (100.0%) | 2,336 (100.0%) |
Household Income by Mortgage Status in Cockeysville
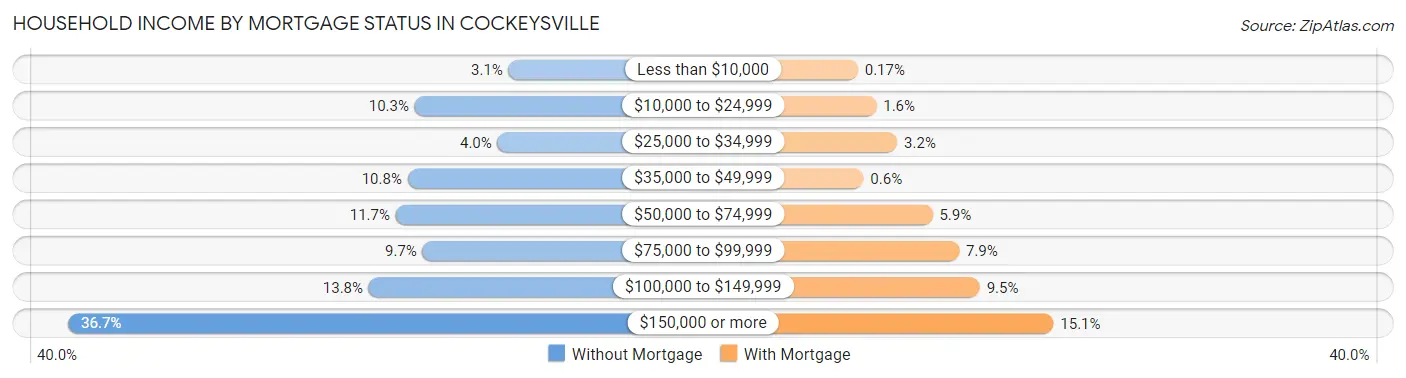
| Household Income | Without Mortgage | With Mortgage |
| Less than $10,000 | 41 (3.1%) | 4 (0.2%) |
| $10,000 to $24,999 | 135 (10.3%) | 37 (1.6%) |
| $25,000 to $34,999 | 52 (4.0%) | 74 (3.2%) |
| $35,000 to $49,999 | 142 (10.8%) | 14 (0.6%) |
| $50,000 to $74,999 | 154 (11.7%) | 137 (5.9%) |
| $75,000 to $99,999 | 127 (9.7%) | 184 (7.9%) |
| $100,000 to $149,999 | 181 (13.8%) | 221 (9.5%) |
| $150,000 or more | 482 (36.7%) | 352 (15.1%) |
| Total | 1,314 (100.0%) | 2,336 (100.0%) |
Property Value to Household Income Ratio in Cockeysville
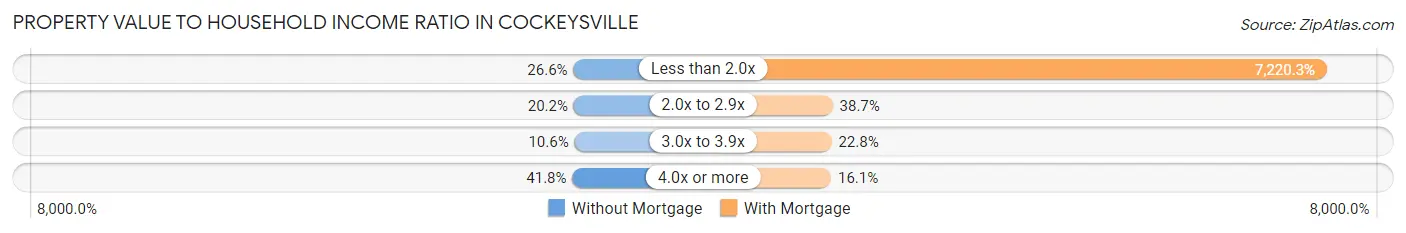
| Value-to-Income Ratio | Without Mortgage | With Mortgage |
| Less than 2.0x | 350 (26.6%) | 168,667 (7,220.3%) |
| 2.0x to 2.9x | 265 (20.2%) | 905 (38.7%) |
| 3.0x to 3.9x | 139 (10.6%) | 532 (22.8%) |
| 4.0x or more | 549 (41.8%) | 375 (16.1%) |
| Total | 1,314 (100.0%) | 2,336 (100.0%) |
Real Estate Taxes by Mortgage Status in Cockeysville
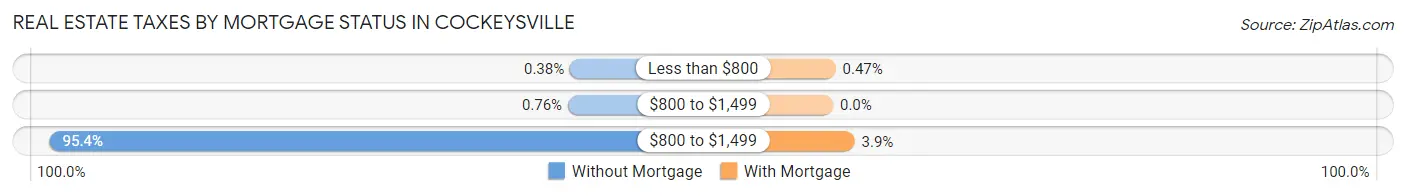
| Property Taxes | Without Mortgage | With Mortgage |
| Less than $800 | 5 (0.4%) | 11 (0.5%) |
| $800 to $1,499 | 10 (0.8%) | 0 (0.0%) |
| $800 to $1,499 | 1,254 (95.4%) | 92 (3.9%) |
| Total | 1,314 (100.0%) | 2,336 (100.0%) |
Health & Disability in Cockeysville
Health Insurance Coverage by Age in Cockeysville
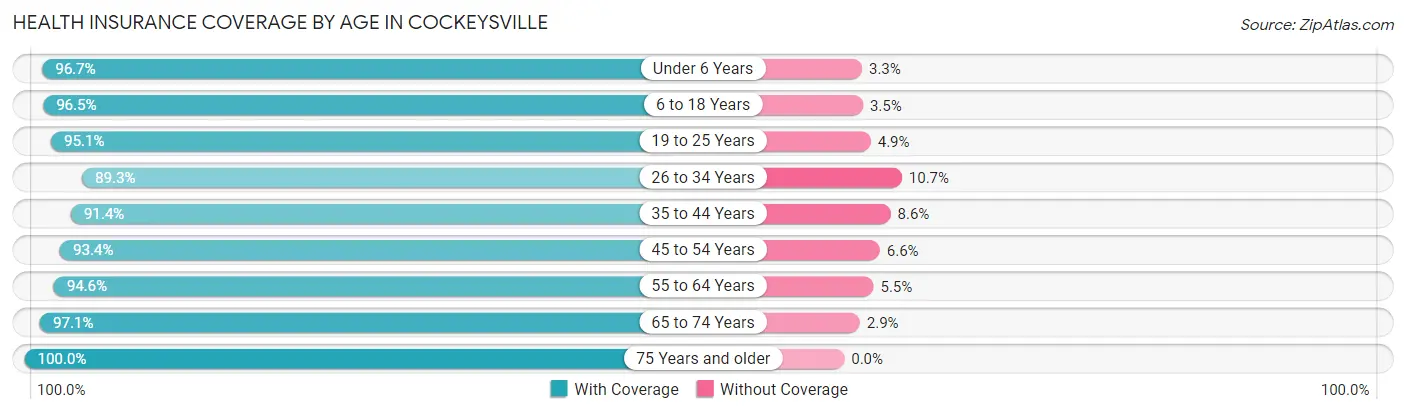
| Age Bracket | With Coverage | Without Coverage |
| Under 6 Years | 1,461 (96.7%) | 50 (3.3%) |
| 6 to 18 Years | 2,748 (96.5%) | 99 (3.5%) |
| 19 to 25 Years | 2,483 (95.1%) | 129 (4.9%) |
| 26 to 34 Years | 4,040 (89.3%) | 486 (10.7%) |
| 35 to 44 Years | 3,044 (91.4%) | 288 (8.6%) |
| 45 to 54 Years | 2,590 (93.4%) | 184 (6.6%) |
| 55 to 64 Years | 2,132 (94.6%) | 123 (5.4%) |
| 65 to 74 Years | 1,672 (97.1%) | 50 (2.9%) |
| 75 Years and older | 1,117 (100.0%) | 0 (0.0%) |
| Total | 21,287 (93.8%) | 1,409 (6.2%) |
Health Insurance Coverage by Citizenship Status in Cockeysville
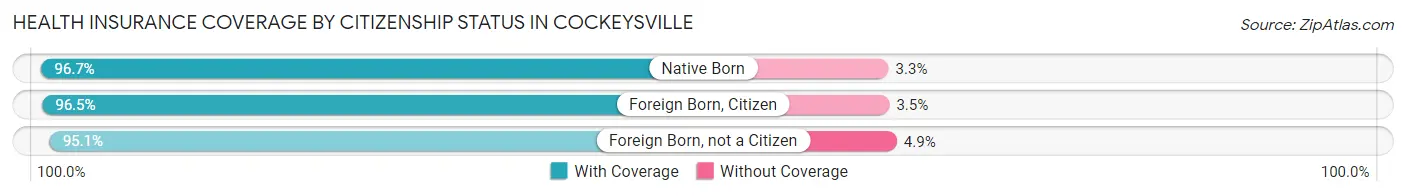
| Citizenship Status | With Coverage | Without Coverage |
| Native Born | 1,461 (96.7%) | 50 (3.3%) |
| Foreign Born, Citizen | 2,748 (96.5%) | 99 (3.5%) |
| Foreign Born, not a Citizen | 2,483 (95.1%) | 129 (4.9%) |
Health Insurance Coverage by Household Income in Cockeysville
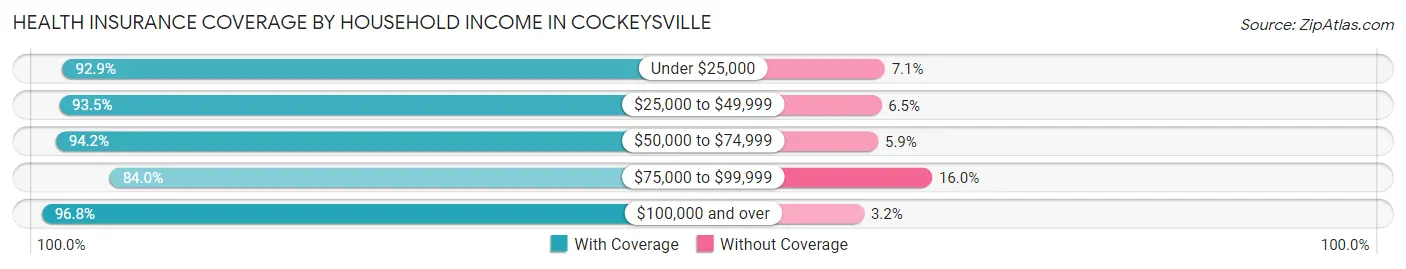
| Household Income | With Coverage | Without Coverage |
| Under $25,000 | 1,817 (92.9%) | 139 (7.1%) |
| $25,000 to $49,999 | 3,345 (93.5%) | 231 (6.5%) |
| $50,000 to $74,999 | 2,769 (94.2%) | 172 (5.9%) |
| $75,000 to $99,999 | 2,712 (84.0%) | 515 (16.0%) |
| $100,000 and over | 10,592 (96.8%) | 351 (3.2%) |
Public vs Private Health Insurance Coverage by Age in Cockeysville
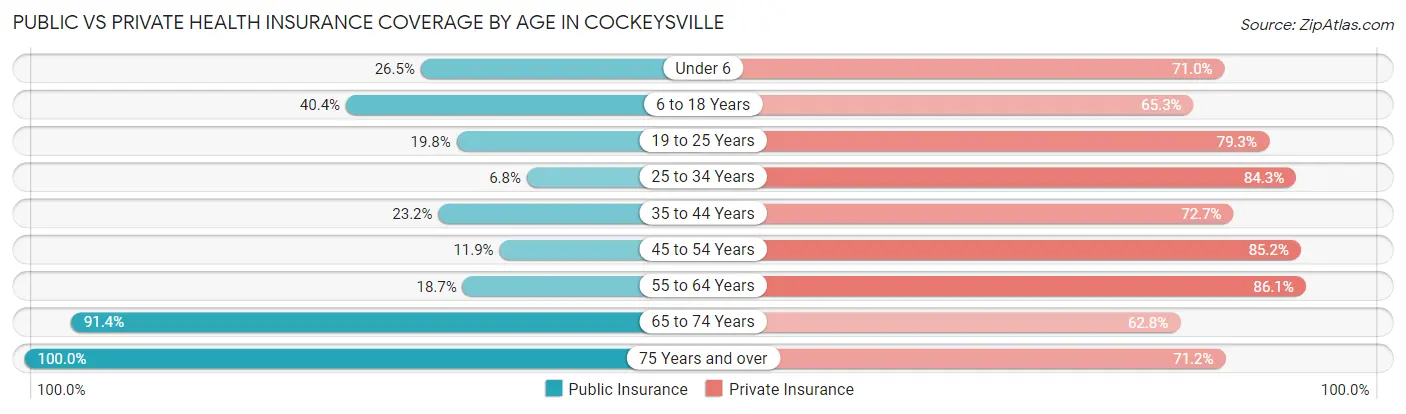
| Age Bracket | Public Insurance | Private Insurance |
| Under 6 | 400 (26.5%) | 1,073 (71.0%) |
| 6 to 18 Years | 1,149 (40.4%) | 1,858 (65.3%) |
| 19 to 25 Years | 518 (19.8%) | 2,070 (79.2%) |
| 25 to 34 Years | 307 (6.8%) | 3,816 (84.3%) |
| 35 to 44 Years | 773 (23.2%) | 2,422 (72.7%) |
| 45 to 54 Years | 329 (11.9%) | 2,363 (85.2%) |
| 55 to 64 Years | 422 (18.7%) | 1,941 (86.1%) |
| 65 to 74 Years | 1,574 (91.4%) | 1,081 (62.8%) |
| 75 Years and over | 1,117 (100.0%) | 795 (71.2%) |
| Total | 6,589 (29.0%) | 17,419 (76.7%) |
Disability Status by Sex by Age in Cockeysville
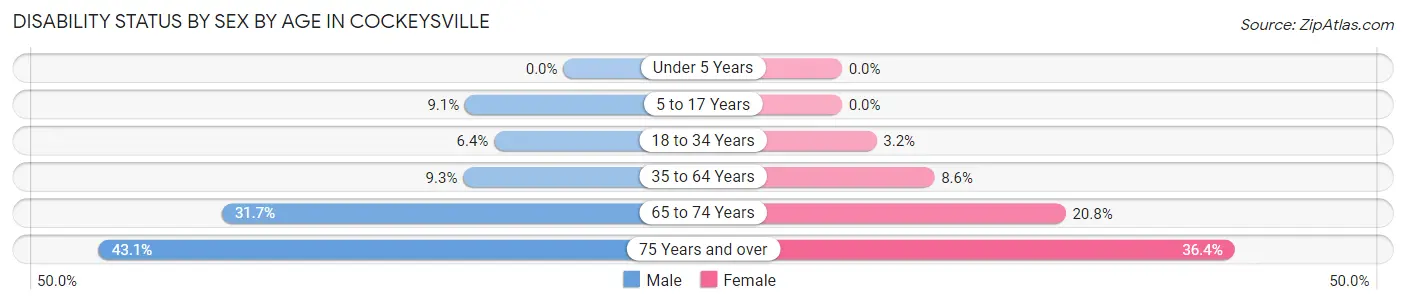
| Age Bracket | Male | Female |
| Under 5 Years | 0 (0.0%) | 0 (0.0%) |
| 5 to 17 Years | 167 (9.1%) | 0 (0.0%) |
| 18 to 34 Years | 232 (6.4%) | 118 (3.2%) |
| 35 to 64 Years | 427 (9.3%) | 323 (8.6%) |
| 65 to 74 Years | 271 (31.7%) | 180 (20.8%) |
| 75 Years and over | 181 (43.1%) | 254 (36.4%) |
Disability Class by Sex by Age in Cockeysville
Disability Class: Hearing Difficulty
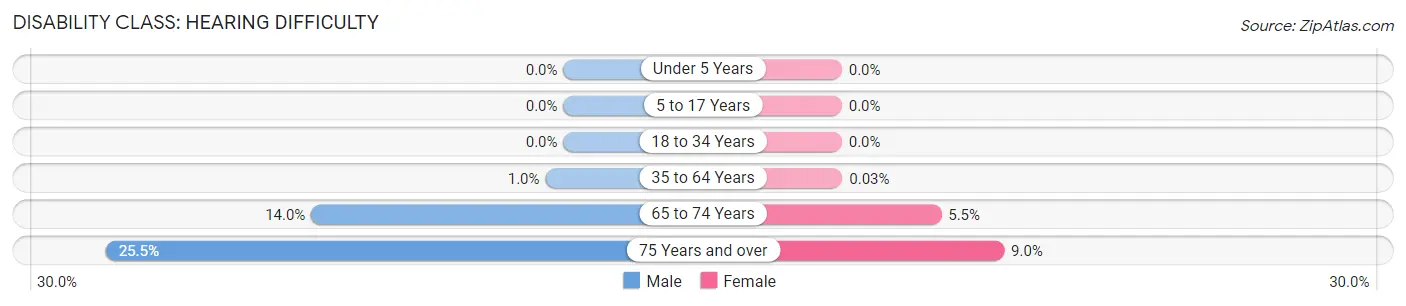
| Age Bracket | Male | Female |
| Under 5 Years | 0 (0.0%) | 0 (0.0%) |
| 5 to 17 Years | 0 (0.0%) | 0 (0.0%) |
| 18 to 34 Years | 0 (0.0%) | 0 (0.0%) |
| 35 to 64 Years | 46 (1.0%) | 1 (0.0%) |
| 65 to 74 Years | 120 (14.0%) | 48 (5.5%) |
| 75 Years and over | 107 (25.5%) | 63 (9.0%) |
Disability Class: Vision Difficulty
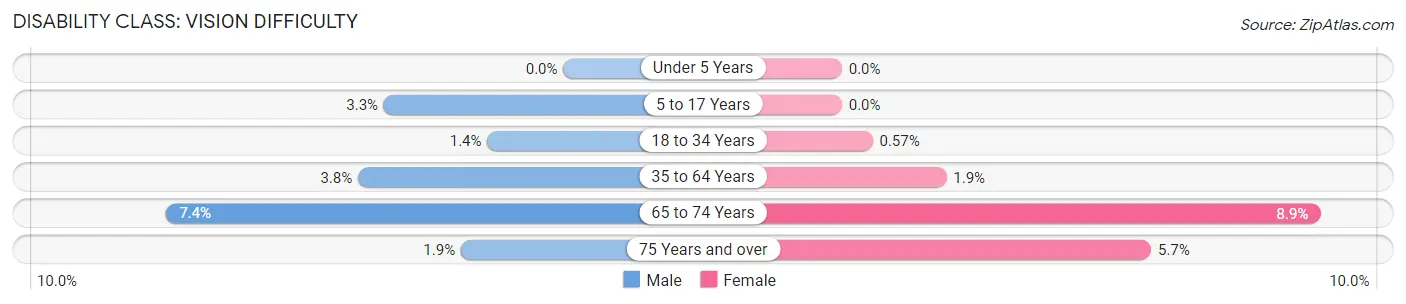
| Age Bracket | Male | Female |
| Under 5 Years | 0 (0.0%) | 0 (0.0%) |
| 5 to 17 Years | 61 (3.3%) | 0 (0.0%) |
| 18 to 34 Years | 51 (1.4%) | 21 (0.6%) |
| 35 to 64 Years | 175 (3.8%) | 73 (1.9%) |
| 65 to 74 Years | 63 (7.4%) | 77 (8.9%) |
| 75 Years and over | 8 (1.9%) | 40 (5.7%) |
Disability Class: Cognitive Difficulty
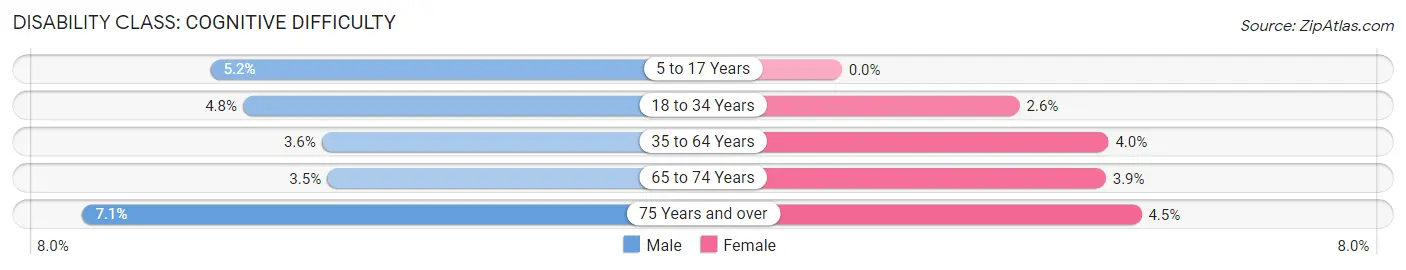
| Age Bracket | Male | Female |
| 5 to 17 Years | 96 (5.2%) | 0 (0.0%) |
| 18 to 34 Years | 172 (4.8%) | 97 (2.6%) |
| 35 to 64 Years | 165 (3.6%) | 149 (4.0%) |
| 65 to 74 Years | 30 (3.5%) | 34 (3.9%) |
| 75 Years and over | 30 (7.1%) | 31 (4.4%) |
Disability Class: Ambulatory Difficulty
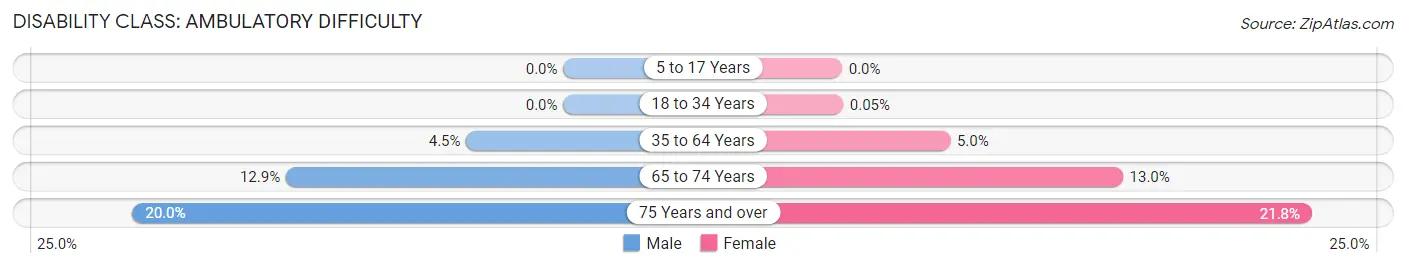
| Age Bracket | Male | Female |
| 5 to 17 Years | 0 (0.0%) | 0 (0.0%) |
| 18 to 34 Years | 0 (0.0%) | 2 (0.1%) |
| 35 to 64 Years | 207 (4.5%) | 189 (5.0%) |
| 65 to 74 Years | 110 (12.9%) | 113 (13.0%) |
| 75 Years and over | 84 (20.0%) | 152 (21.8%) |
Disability Class: Self-Care Difficulty
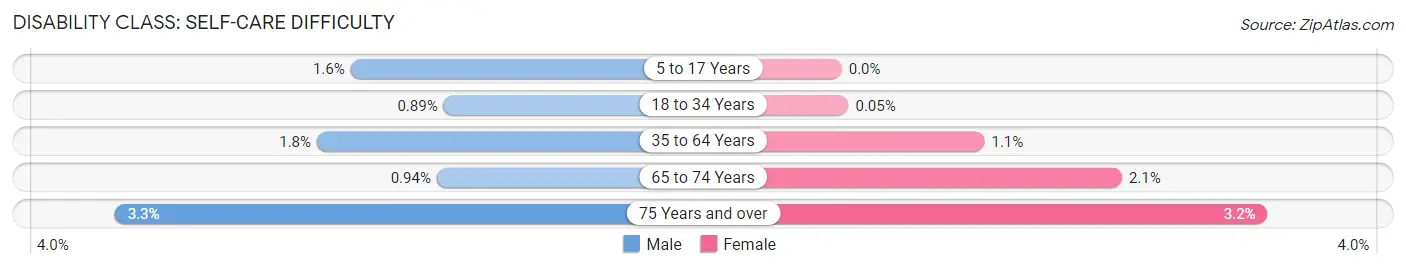
| Age Bracket | Male | Female |
| 5 to 17 Years | 29 (1.6%) | 0 (0.0%) |
| 18 to 34 Years | 32 (0.9%) | 2 (0.1%) |
| 35 to 64 Years | 84 (1.8%) | 40 (1.1%) |
| 65 to 74 Years | 8 (0.9%) | 18 (2.1%) |
| 75 Years and over | 14 (3.3%) | 22 (3.2%) |
Technology Access in Cockeysville
Computing Device Access in Cockeysville
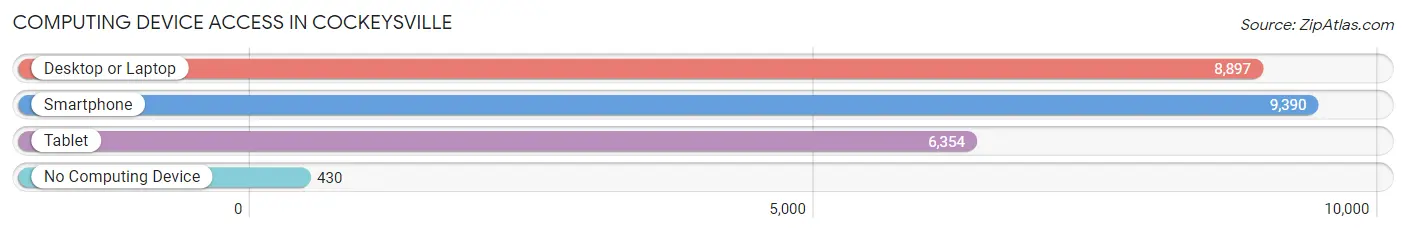
| Device Type | # Households | % Households |
| Desktop or Laptop | 8,897 | 86.3% |
| Smartphone | 9,390 | 91.1% |
| Tablet | 6,354 | 61.7% |
| No Computing Device | 430 | 4.2% |
| Total | 10,305 | 100.0% |
Internet Access in Cockeysville
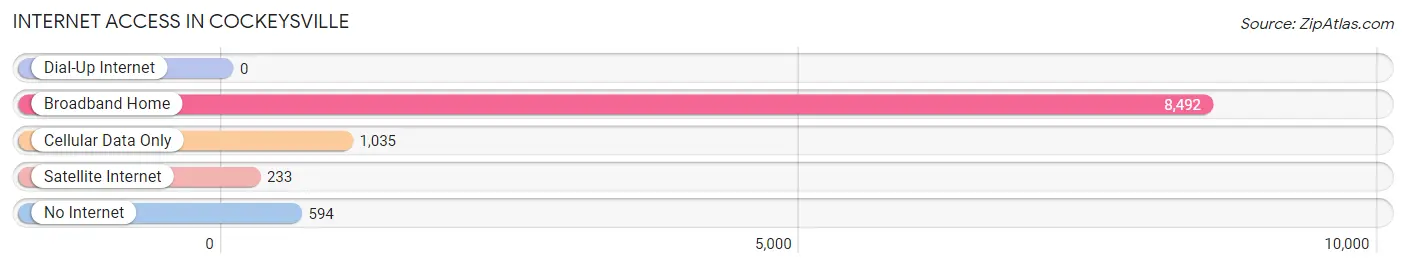
| Internet Type | # Households | % Households |
| Dial-Up Internet | 0 | 0.0% |
| Broadband Home | 8,492 | 82.4% |
| Cellular Data Only | 1,035 | 10.0% |
| Satellite Internet | 233 | 2.3% |
| No Internet | 594 | 5.8% |
| Total | 10,305 | 100.0% |
Cockeysville Summary
Cockeysville is a census-designated place (CDP) located in Baltimore County, Maryland, United States. It is situated in the northern part of the county, just south of the city of Baltimore. The population of Cockeysville was 20,776 at the 2010 census.
History
The area now known as Cockeysville was originally inhabited by the Susquehannock Native Americans. The first European settlers arrived in the area in the late 1700s. The area was named after the Cockey family, who were among the first settlers. The Cockey family owned a large amount of land in the area, and the town was named after them.
In the early 1800s, the area was a popular destination for wealthy Baltimoreans looking to escape the city. The area was known for its mineral springs, which were believed to have healing properties. The area was also known for its horse racing, and the first racetrack in the area was built in 1821.
In the late 1800s, the area began to develop into a residential community. The Baltimore and Ohio Railroad opened a station in the area in 1873, and the area began to grow rapidly. The area was incorporated as a town in 1888, and the name was changed to Cockeysville in 1889.
Geography
Cockeysville is located at 39°27'17" North, 76°37'45" West (39.454722, -76.629167). According to the United States Census Bureau, the CDP has a total area of 11.2 square miles (29.0 km2), of which 11.1 square miles (28.7 km2) is land and 0.1 square miles (0.3 km2) is water.
Economy
Cockeysville is home to a variety of businesses, including retail stores, restaurants, and professional services. The area is also home to several corporate headquarters, including McCormick & Company, T. Rowe Price, and Black & Decker.
The area is also home to a number of technology companies, including Mindgrub Technologies, a software development firm, and CyberPoint International, a cybersecurity firm.
Demographics
As of the 2010 census, there were 20,776 people, 8,717 households, and 5,717 families residing in the CDP. The population density was 1,871.2 people per square mile (722.3/km2). There were 9,093 housing units at an average density of 817.3 per square mile (315.7/km2). The racial makeup of the CDP was 81.2% White, 11.2% African American, 0.3% Native American, 4.2% Asian, 0.1% Pacific Islander, 1.3% from other races, and 1.7% from two or more races. Hispanic or Latino of any race were 3.7% of the population.
There were 8,717 households, out of which 28.2% had children under the age of 18 living with them, 51.2% were married couples living together, 10.7% had a female householder with no husband present, and 34.2% were non-families. 28.2% of all households were made up of individuals, and 11.2% had someone living alone who was 65 years of age or older. The average household size was 2.37 and the average family size was 2.93.
In the CDP, the population was spread out, with 22.2% under the age of 18, 6.2% from 18 to 24, 28.2% from 25 to 44, 27.2% from 45 to 64, and 16.2% who were 65 years of age or older. The median age was 40 years. For every 100 females, there were 92.2 males. For every 100 females age 18 and over, there were 88.7 males.
The median income for a household in the CDP was $63,945, and the median income for a family was $77,945. Males had a median income of $51,945 versus $41,945 for females. The per capita income for the CDP was $33,945. About 3.2% of families and 5.2% of the population were below the poverty line, including 6.2% of those under age 18 and 4.2% of those age 65 or over.
Common Questions
What is Per Capita Income in Cockeysville?
Per Capita income in Cockeysville is $51,180.
What is the Median Family Income in Cockeysville?
Median Family Income in Cockeysville is $109,719.
What is the Median Household income in Cockeysville?
Median Household Income in Cockeysville is $81,966.
What is Income or Wage Gap in Cockeysville?
Income or Wage Gap in Cockeysville is 17.0%.
Women in Cockeysville earn 83.0 cents for every dollar earned by a man.
What is Family Income Deficit in Cockeysville?
Family Income Deficit in Cockeysville is $7,937.
Families that are below poverty line in Cockeysville earn $7,937 less on average than the poverty threshold level.
What is Inequality or Gini Index in Cockeysville?
Inequality or Gini Index in Cockeysville is 0.44.
What is the Total Population of Cockeysville?
Total Population of Cockeysville is 23,246.
What is the Total Male Population of Cockeysville?
Total Male Population of Cockeysville is 12,066.
What is the Total Female Population of Cockeysville?
Total Female Population of Cockeysville is 11,180.
What is the Ratio of Males per 100 Females in Cockeysville?
There are 107.92 Males per 100 Females in Cockeysville.
What is the Ratio of Females per 100 Males in Cockeysville?
There are 92.66 Females per 100 Males in Cockeysville.
What is the Median Population Age in Cockeysville?
Median Population Age in Cockeysville is 35.3 Years.
What is the Average Family Size in Cockeysville
Average Family Size in Cockeysville is 2.9 People.
What is the Average Household Size in Cockeysville
Average Household Size in Cockeysville is 2.2 People.
How Large is the Labor Force in Cockeysville?
There are 14,194 People in the Labor Forcein in Cockeysville.
What is the Percentage of People in the Labor Force in Cockeysville?
72.9% of People are in the Labor Force in Cockeysville.
What is the Unemployment Rate in Cockeysville?
Unemployment Rate in Cockeysville is 5.0%.