Federalsburg, MD Map & Demographics
Federalsburg Map
Federalsburg Overview
$19,145
PER CAPITA INCOME
$37,656
AVG FAMILY INCOME
$33,511
AVG HOUSEHOLD INCOME
25.3%
WAGE / INCOME GAP [ % ]
74.7¢/ $1
WAGE / INCOME GAP [ $ ]
$9,595
FAMILY INCOME DEFICIT
0.46
INEQUALITY / GINI INDEX
2,818
TOTAL POPULATION
1,180
MALE POPULATION
1,638
FEMALE POPULATION
72.04
MALES / 100 FEMALES
138.81
FEMALES / 100 MALES
36.4
MEDIAN AGE
3.1
AVG FAMILY SIZE
2.6
AVG HOUSEHOLD SIZE
1,136
LABOR FORCE [ PEOPLE ]
54.2%
PERCENT IN LABOR FORCE
7.4%
UNEMPLOYMENT RATE
Federalsburg Zip Codes
Income in Federalsburg
Income Overview in Federalsburg
Per Capita Income in Federalsburg is $19,145, while median incomes of families and households are $37,656 and $33,511 respectively.
| Characteristic | Number | Measure |
| Per Capita Income | 2,818 | $19,145 |
| Median Family Income | 782 | $37,656 |
| Mean Family Income | 782 | $54,876 |
| Median Household Income | 1,067 | $33,511 |
| Mean Household Income | 1,067 | $47,732 |
| Income Deficit | 782 | $9,595 |
| Wage / Income Gap (%) | 2,818 | 25.35% |
| Wage / Income Gap ($) | 2,818 | 74.65¢ per $1 |
| Gini / Inequality Index | 2,818 | 0.46 |
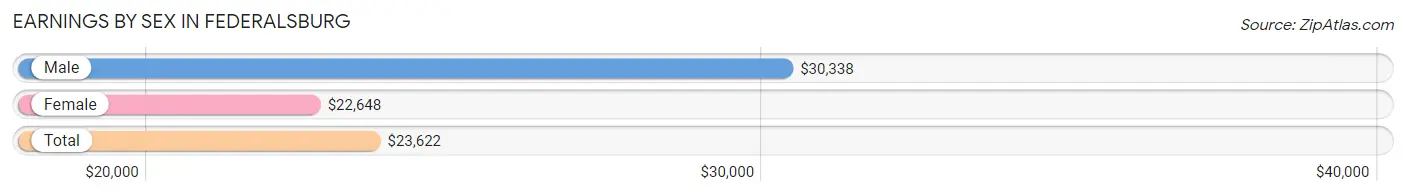
Earnings by Sex in Federalsburg
Average Earnings in Federalsburg are $23,622, $30,338 for men and $22,648 for women, a difference of 25.4%.
| Sex | Number | Average Earnings |
| Male | 462 (37.0%) | $30,338 |
| Female | 785 (62.9%) | $22,648 |
| Total | 1,247 (100.0%) | $23,622 |
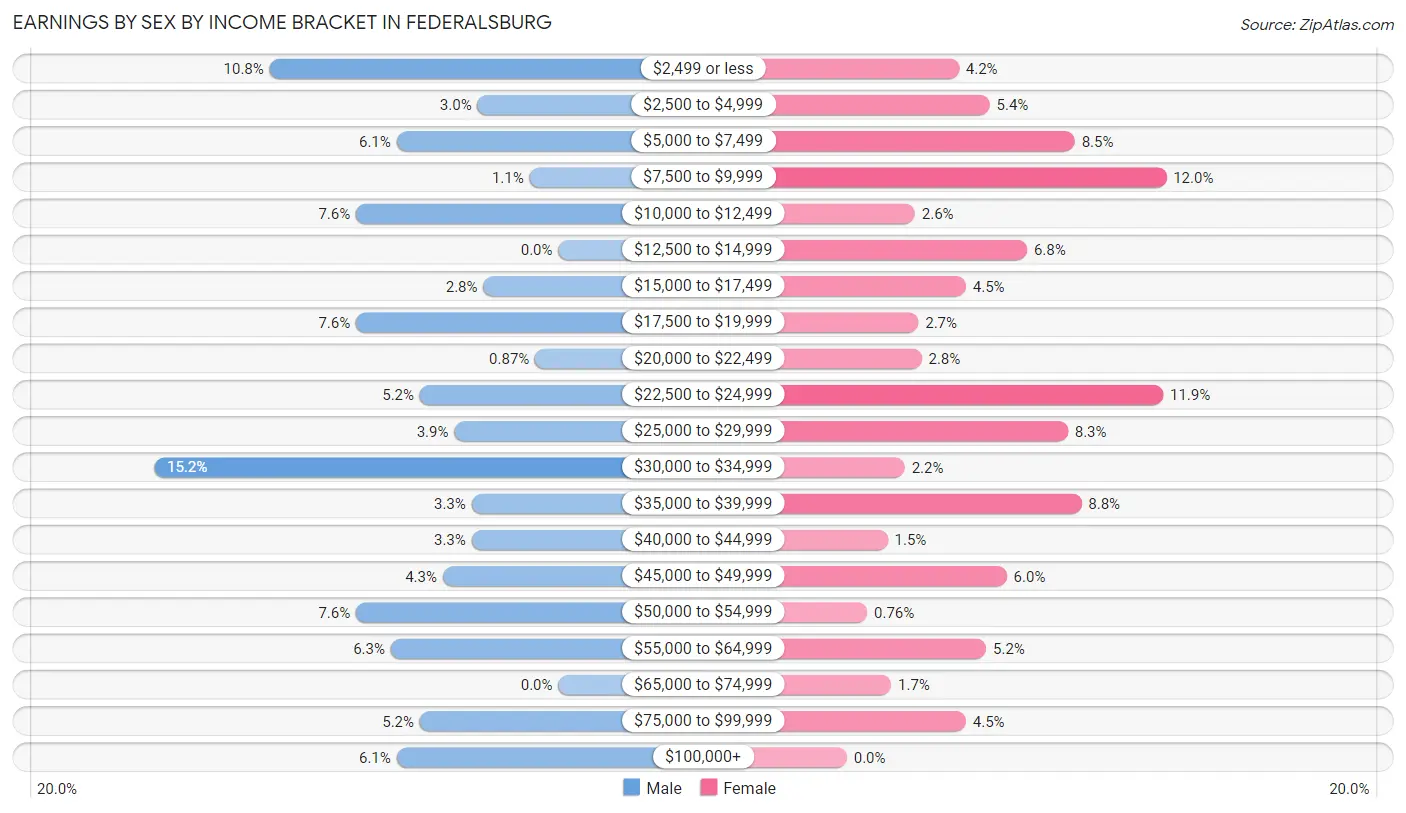
Earnings by Sex by Income Bracket in Federalsburg
The most common earnings brackets in Federalsburg are $30,000 to $34,999 for men (70 | 15.1%) and $7,500 to $9,999 for women (94 | 12.0%).
| Income | Male | Female |
| $2,499 or less | 50 (10.8%) | 33 (4.2%) |
| $2,500 to $4,999 | 14 (3.0%) | 42 (5.3%) |
| $5,000 to $7,499 | 28 (6.1%) | 67 (8.5%) |
| $7,500 to $9,999 | 5 (1.1%) | 94 (12.0%) |
| $10,000 to $12,499 | 35 (7.6%) | 20 (2.5%) |
| $12,500 to $14,999 | 0 (0.0%) | 53 (6.8%) |
| $15,000 to $17,499 | 13 (2.8%) | 35 (4.5%) |
| $17,500 to $19,999 | 35 (7.6%) | 21 (2.7%) |
| $20,000 to $22,499 | 4 (0.9%) | 22 (2.8%) |
| $22,500 to $24,999 | 24 (5.2%) | 93 (11.8%) |
| $25,000 to $29,999 | 18 (3.9%) | 65 (8.3%) |
| $30,000 to $34,999 | 70 (15.1%) | 17 (2.2%) |
| $35,000 to $39,999 | 15 (3.3%) | 69 (8.8%) |
| $40,000 to $44,999 | 15 (3.3%) | 12 (1.5%) |
| $45,000 to $49,999 | 20 (4.3%) | 47 (6.0%) |
| $50,000 to $54,999 | 35 (7.6%) | 6 (0.8%) |
| $55,000 to $64,999 | 29 (6.3%) | 41 (5.2%) |
| $65,000 to $74,999 | 0 (0.0%) | 13 (1.7%) |
| $75,000 to $99,999 | 24 (5.2%) | 35 (4.5%) |
| $100,000+ | 28 (6.1%) | 0 (0.0%) |
| Total | 462 (100.0%) | 785 (100.0%) |
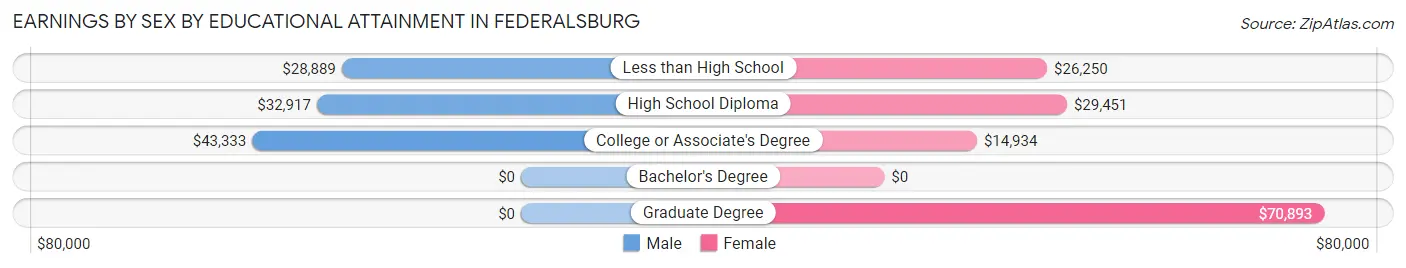
Earnings by Sex by Educational Attainment in Federalsburg
Average earnings in Federalsburg are $32,917 for men and $24,207 for women, a difference of 26.5%. Men with an educational attainment of college or associate's degree enjoy the highest average annual earnings of $43,333, while those with less than high school education earn the least with $28,889. Women with an educational attainment of graduate degree earn the most with the average annual earnings of $70,893, while those with college or associate's degree education have the smallest earnings of $14,934.
| Educational Attainment | Male Income | Female Income |
| Less than High School | $28,889 | $26,250 |
| High School Diploma | $32,917 | $29,451 |
| College or Associate's Degree | $43,333 | $14,934 |
| Bachelor's Degree | - | - |
| Graduate Degree | - | - |
| Total | $32,917 | $24,207 |
Family Income in Federalsburg
Family Income Brackets in Federalsburg
According to the Federalsburg family income data, there are 168 families falling into the $50,000 to $74,999 income range, which is the most common income bracket and makes up 21.5% of all families. Conversely, the $10,000 to $14,999 income bracket is the least frequent group with only 16 families (2.1%) belonging to this category.
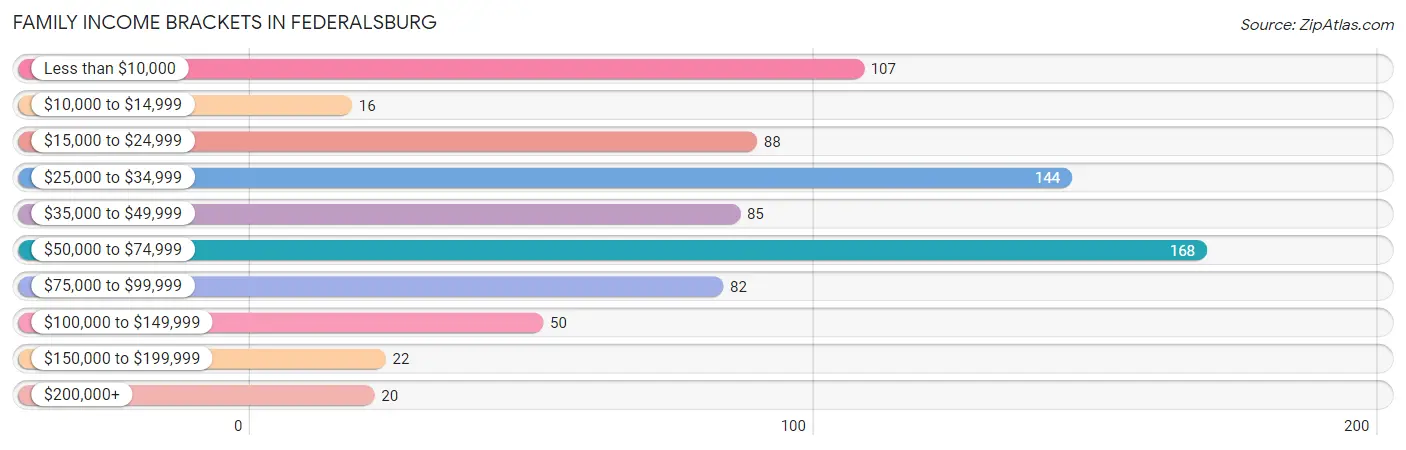
| Income Bracket | # Families | % Families |
| Less than $10,000 | 107 | 13.7% |
| $10,000 to $14,999 | 16 | 2.0% |
| $15,000 to $24,999 | 88 | 11.3% |
| $25,000 to $34,999 | 144 | 18.4% |
| $35,000 to $49,999 | 85 | 10.9% |
| $50,000 to $74,999 | 168 | 21.5% |
| $75,000 to $99,999 | 82 | 10.5% |
| $100,000 to $149,999 | 50 | 6.4% |
| $150,000 to $199,999 | 22 | 2.8% |
| $200,000+ | 20 | 2.6% |
Family Income by Famaliy Size in Federalsburg
5-person families (42 | 5.4%) account for the highest median family income in Federalsburg with $62,283 per family, while 2-person families (385 | 49.2%) have the highest median income of $19,699 per family member.
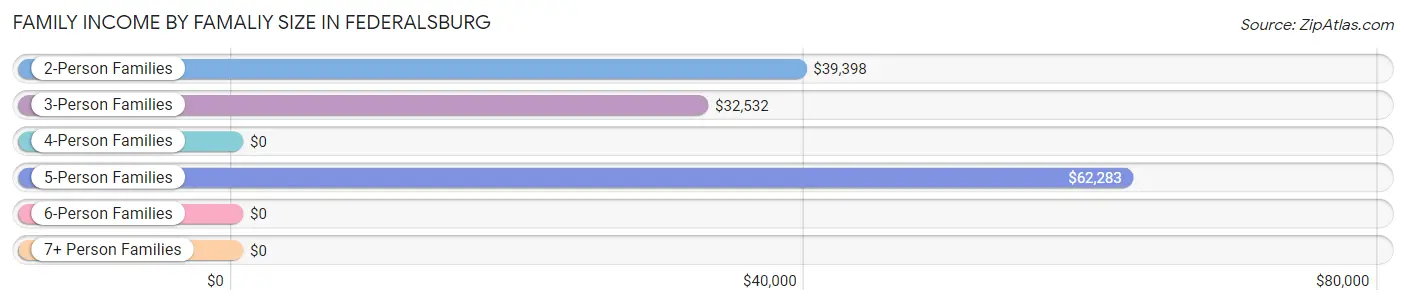
| Income Bracket | # Families | Median Income |
| 2-Person Families | 385 (49.2%) | $39,398 |
| 3-Person Families | 175 (22.4%) | $32,532 |
| 4-Person Families | 103 (13.2%) | $0 |
| 5-Person Families | 42 (5.4%) | $62,283 |
| 6-Person Families | 55 (7.0%) | $0 |
| 7+ Person Families | 22 (2.8%) | $0 |
| Total | 782 (100.0%) | $37,656 |
Family Income by Number of Earners in Federalsburg
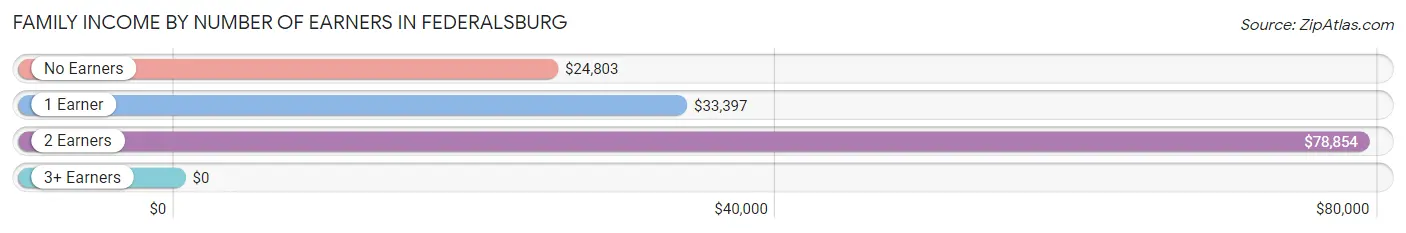
| Number of Earners | # Families | Median Income |
| No Earners | 160 (20.5%) | $24,803 |
| 1 Earner | 342 (43.7%) | $33,397 |
| 2 Earners | 211 (27.0%) | $78,854 |
| 3+ Earners | 69 (8.8%) | $0 |
| Total | 782 (100.0%) | $37,656 |
Household Income in Federalsburg
Household Income Brackets in Federalsburg
With 211 households falling in the category, the $25,000 to $34,999 income range is the most frequent in Federalsburg, accounting for 19.8% of all households. In contrast, only 20 households (1.9%) fall into the $200,000+ income bracket, making it the least populous group.
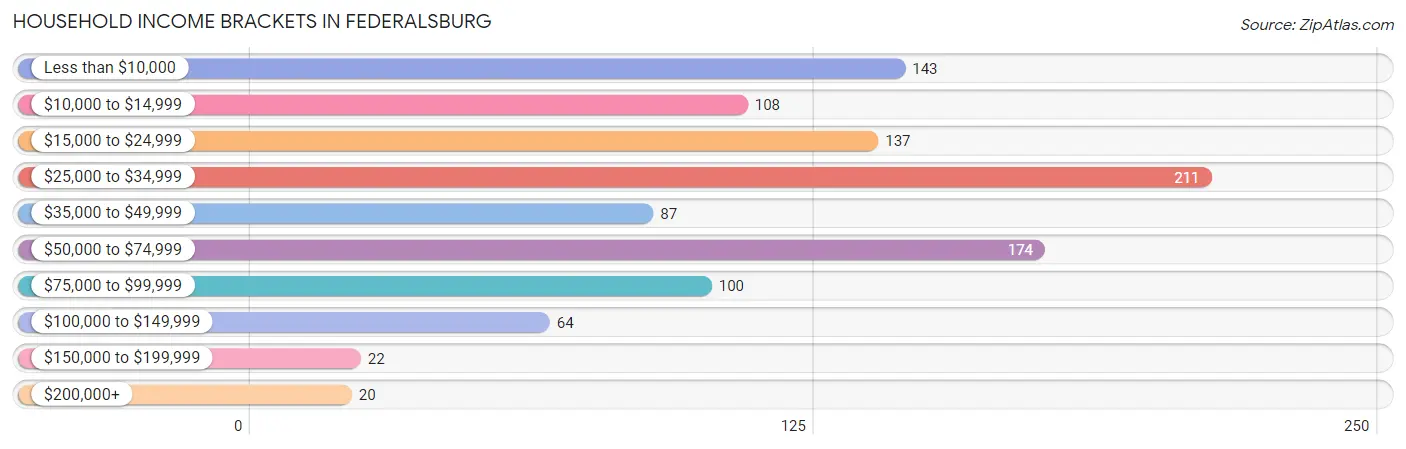
| Income Bracket | # Households | % Households |
| Less than $10,000 | 143 | 13.4% |
| $10,000 to $14,999 | 108 | 10.1% |
| $15,000 to $24,999 | 137 | 12.8% |
| $25,000 to $34,999 | 211 | 19.8% |
| $35,000 to $49,999 | 87 | 8.2% |
| $50,000 to $74,999 | 174 | 16.3% |
| $75,000 to $99,999 | 100 | 9.4% |
| $100,000 to $149,999 | 64 | 6.0% |
| $150,000 to $199,999 | 22 | 2.1% |
| $200,000+ | 20 | 1.9% |
Household Income by Householder Age in Federalsburg
The median household income in Federalsburg is $33,511, with the highest median household income of $42,917 found in the 65+ years age bracket for the primary householder. A total of 239 households (22.4%) fall into this category. Meanwhile, the 15 to 24 years age bracket for the primary householder has the lowest median household income of $0, with 15 households (1.4%) in this group.
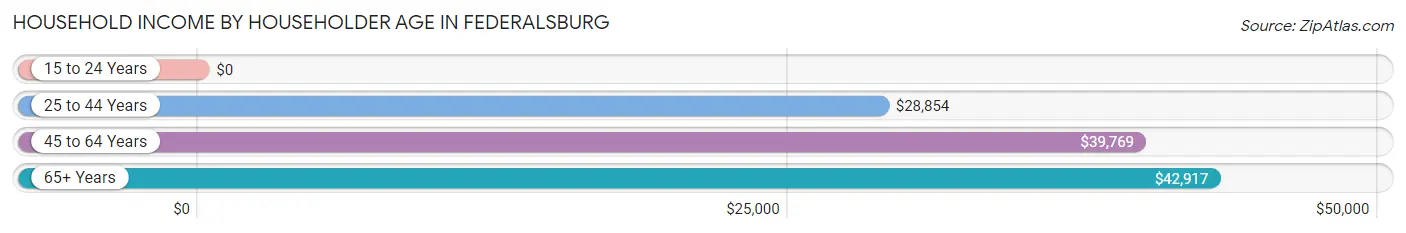
| Income Bracket | # Households | Median Income |
| 15 to 24 Years | 15 (1.4%) | $0 |
| 25 to 44 Years | 384 (36.0%) | $28,854 |
| 45 to 64 Years | 429 (40.2%) | $39,769 |
| 65+ Years | 239 (22.4%) | $42,917 |
| Total | 1,067 (100.0%) | $33,511 |
Poverty in Federalsburg
Income Below Poverty by Sex and Age in Federalsburg
With 22.3% poverty level for males and 38.2% for females among the residents of Federalsburg, 5 year old males and 16 and 17 year old females are the most vulnerable to poverty, with 23 males (100.0%) and 7 females (100.0%) in their respective age groups living below the poverty level.
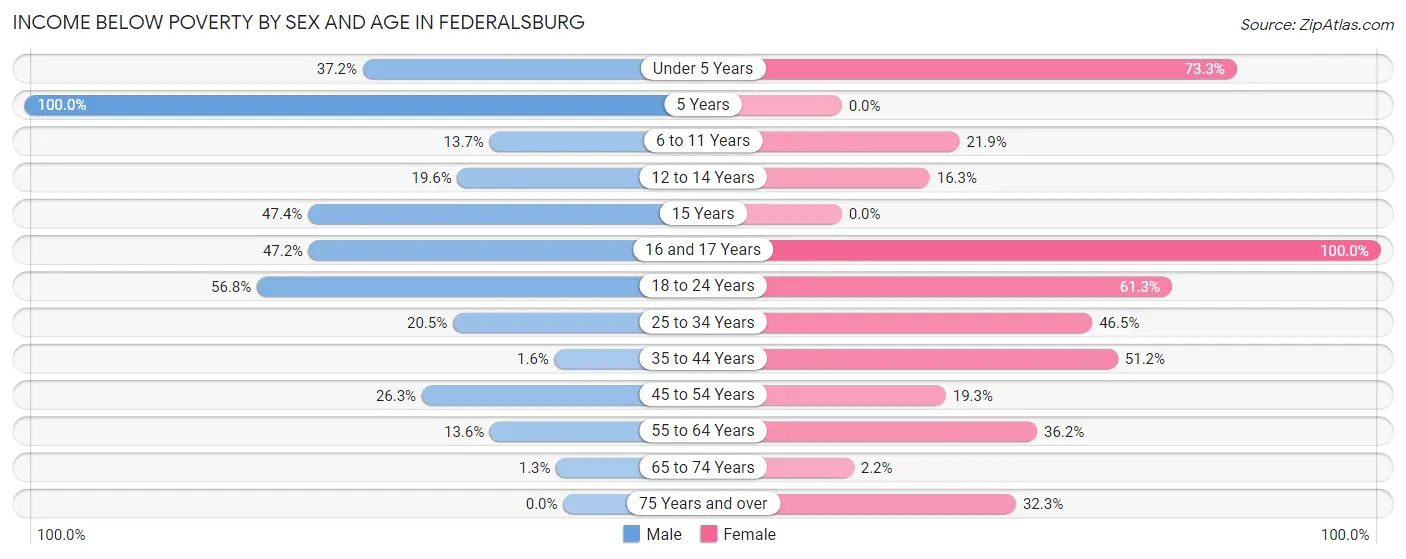
| Age Bracket | Male | Female |
| Under 5 Years | 32 (37.2%) | 107 (73.3%) |
| 5 Years | 23 (100.0%) | 0 (0.0%) |
| 6 to 11 Years | 23 (13.7%) | 26 (21.8%) |
| 12 to 14 Years | 11 (19.6%) | 8 (16.3%) |
| 15 Years | 18 (47.4%) | 0 (0.0%) |
| 16 and 17 Years | 17 (47.2%) | 7 (100.0%) |
| 18 to 24 Years | 54 (56.8%) | 98 (61.3%) |
| 25 to 34 Years | 17 (20.5%) | 139 (46.5%) |
| 35 to 44 Years | 1 (1.6%) | 62 (51.2%) |
| 45 to 54 Years | 42 (26.3%) | 28 (19.3%) |
| 55 to 64 Years | 23 (13.6%) | 104 (36.2%) |
| 65 to 74 Years | 2 (1.3%) | 3 (2.2%) |
| 75 Years and over | 0 (0.0%) | 43 (32.3%) |
| Total | 263 (22.3%) | 625 (38.2%) |
Income Above Poverty by Sex and Age in Federalsburg
According to the poverty statistics in Federalsburg, males aged 75 years and over and females aged 5 years are the age groups that are most secure financially, with 100.0% of males and 100.0% of females in these age groups living above the poverty line.
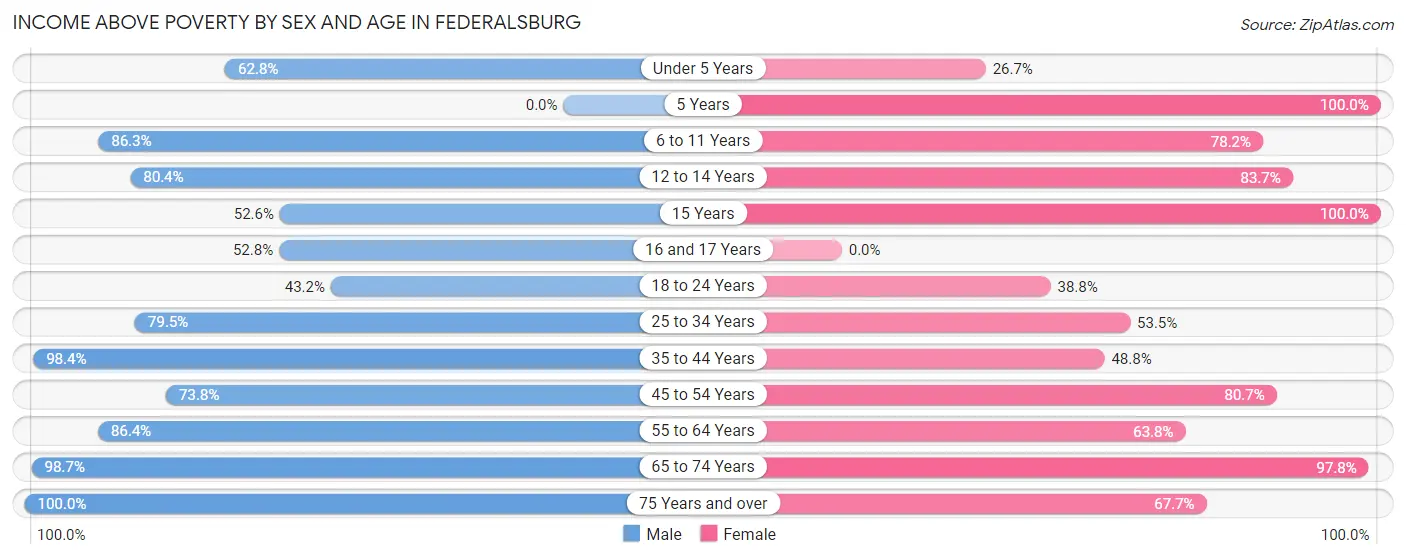
| Age Bracket | Male | Female |
| Under 5 Years | 54 (62.8%) | 39 (26.7%) |
| 5 Years | 0 (0.0%) | 17 (100.0%) |
| 6 to 11 Years | 145 (86.3%) | 93 (78.1%) |
| 12 to 14 Years | 45 (80.4%) | 41 (83.7%) |
| 15 Years | 20 (52.6%) | 20 (100.0%) |
| 16 and 17 Years | 19 (52.8%) | 0 (0.0%) |
| 18 to 24 Years | 41 (43.2%) | 62 (38.8%) |
| 25 to 34 Years | 66 (79.5%) | 160 (53.5%) |
| 35 to 44 Years | 61 (98.4%) | 59 (48.8%) |
| 45 to 54 Years | 118 (73.8%) | 117 (80.7%) |
| 55 to 64 Years | 146 (86.4%) | 183 (63.8%) |
| 65 to 74 Years | 152 (98.7%) | 132 (97.8%) |
| 75 Years and over | 50 (100.0%) | 90 (67.7%) |
| Total | 917 (77.7%) | 1,013 (61.8%) |
Income Below Poverty Among Married-Couple Families in Federalsburg
The poverty statistics for married-couple families in Federalsburg show that 13.9% or 56 of the total 402 families live below the poverty line. Families with 1 or 2 children have the highest poverty rate of 30.2%, comprising of 26 families. On the other hand, families with no children have the lowest poverty rate of 5.7%, which includes 15 families.
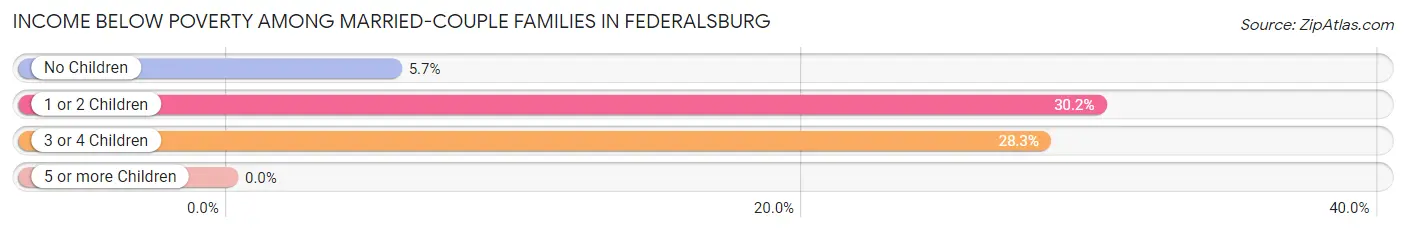
| Children | Above Poverty | Below Poverty |
| No Children | 248 (94.3%) | 15 (5.7%) |
| 1 or 2 Children | 60 (69.8%) | 26 (30.2%) |
| 3 or 4 Children | 38 (71.7%) | 15 (28.3%) |
| 5 or more Children | 0 (0.0%) | 0 (0.0%) |
| Total | 346 (86.1%) | 56 (13.9%) |
Income Below Poverty Among Single-Parent Households in Federalsburg
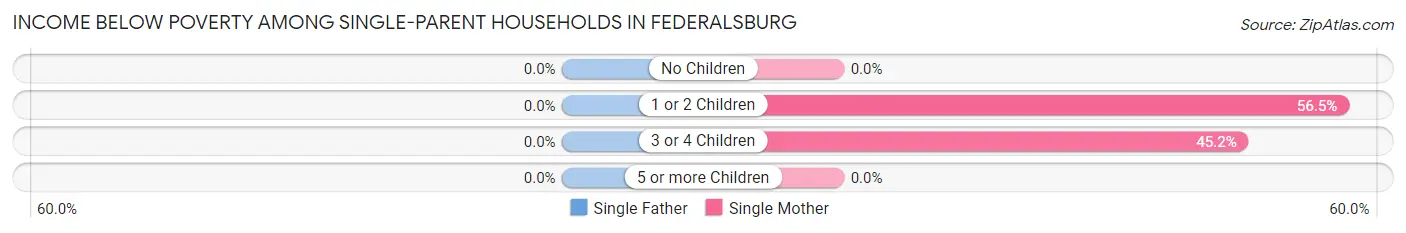
| Children | Single Father | Single Mother |
| No Children | 0 (0.0%) | 0 (0.0%) |
| 1 or 2 Children | 0 (0.0%) | 148 (56.5%) |
| 3 or 4 Children | 0 (0.0%) | 19 (45.2%) |
| 5 or more Children | 0 (0.0%) | 0 (0.0%) |
| Total | 0 (0.0%) | 167 (44.5%) |
Income Below Poverty Among Married-Couple vs Single-Parent Households in Federalsburg
The poverty data for Federalsburg shows that 56 of the married-couple family households (13.9%) and 167 of the single-parent households (44.0%) are living below the poverty level. Within the married-couple family households, those with 1 or 2 children have the highest poverty rate, with 26 households (30.2%) falling below the poverty line. Among the single-parent households, those with 1 or 2 children have the highest poverty rate, with 148 household (56.5%) living below poverty.
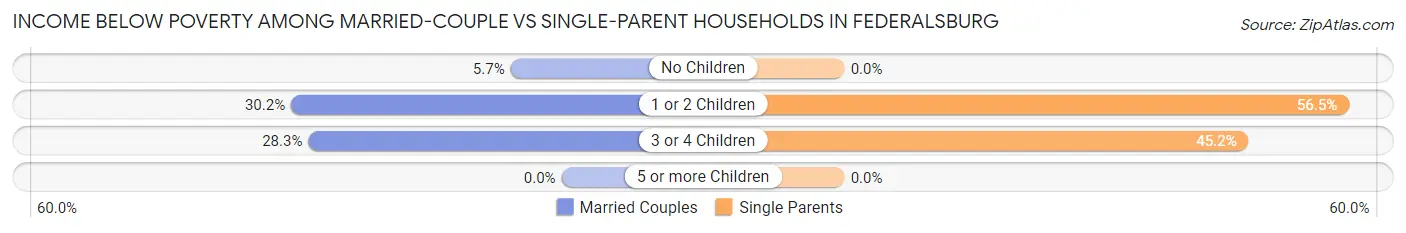
| Children | Married-Couple Families | Single-Parent Households |
| No Children | 15 (5.7%) | 0 (0.0%) |
| 1 or 2 Children | 26 (30.2%) | 148 (56.5%) |
| 3 or 4 Children | 15 (28.3%) | 19 (45.2%) |
| 5 or more Children | 0 (0.0%) | 0 (0.0%) |
| Total | 56 (13.9%) | 167 (44.0%) |
Race in Federalsburg
The most populous races in Federalsburg are Black / African American (1,313 | 46.6%), White / Caucasian (1,168 | 41.4%), and Two or more Races (290 | 10.3%).
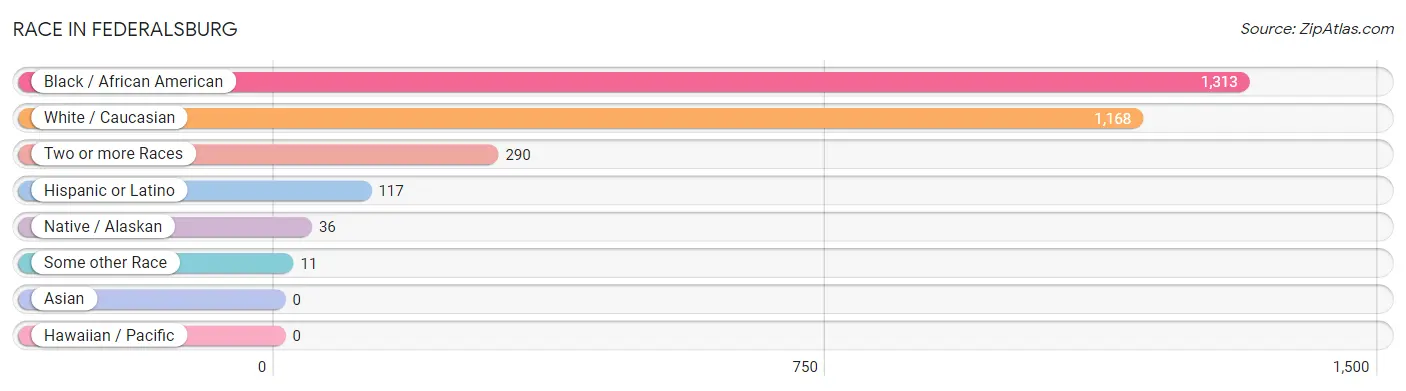
| Race | # Population | % Population |
| Asian | 0 | 0.0% |
| Black / African American | 1,313 | 46.6% |
| Hawaiian / Pacific | 0 | 0.0% |
| Hispanic or Latino | 117 | 4.2% |
| Native / Alaskan | 36 | 1.3% |
| White / Caucasian | 1,168 | 41.4% |
| Two or more Races | 290 | 10.3% |
| Some other Race | 11 | 0.4% |
| Total | 2,818 | 100.0% |
Ancestry in Federalsburg
The most populous ancestries reported in Federalsburg are German (206 | 7.3%), English (197 | 7.0%), American (195 | 6.9%), Irish (173 | 6.1%), and Italian (151 | 5.4%), together accounting for 32.7% of all Federalsburg residents.
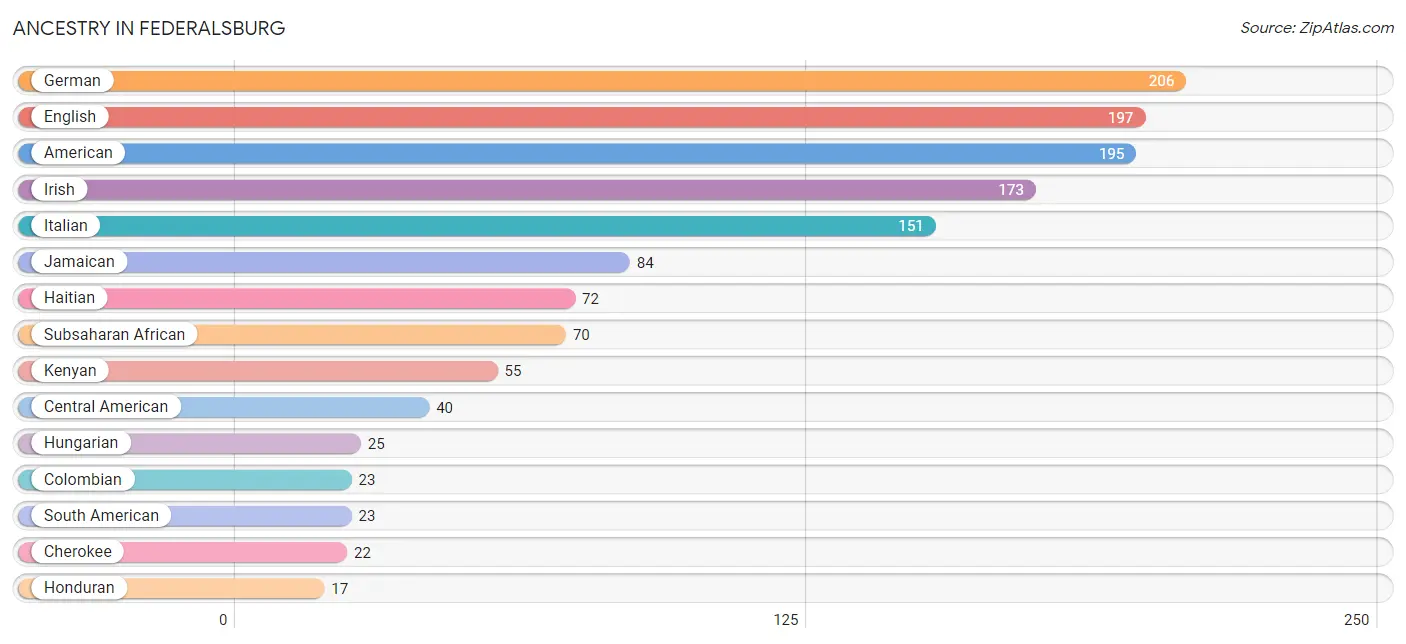
| Ancestry | # Population | % Population |
| African | 3 | 0.1% |
| American | 195 | 6.9% |
| Central American | 40 | 1.4% |
| Cherokee | 22 | 0.8% |
| Colombian | 23 | 0.8% |
| Dutch | 5 | 0.2% |
| Eastern European | 6 | 0.2% |
| English | 197 | 7.0% |
| European | 4 | 0.1% |
| Finnish | 3 | 0.1% |
| French | 3 | 0.1% |
| German | 206 | 7.3% |
| Haitian | 72 | 2.6% |
| Honduran | 17 | 0.6% |
| Hungarian | 25 | 0.9% |
| Irish | 173 | 6.1% |
| Italian | 151 | 5.4% |
| Jamaican | 84 | 3.0% |
| Kenyan | 55 | 1.9% |
| Mexican | 17 | 0.6% |
| Norwegian | 5 | 0.2% |
| Panamanian | 12 | 0.4% |
| Polish | 7 | 0.3% |
| Puerto Rican | 6 | 0.2% |
| Salvadoran | 11 | 0.4% |
| Scottish | 9 | 0.3% |
| South American | 23 | 0.8% |
| Spaniard | 10 | 0.4% |
| Subsaharan African | 70 | 2.5% |
| Ukrainian | 2 | 0.1% | View All 30 Rows |
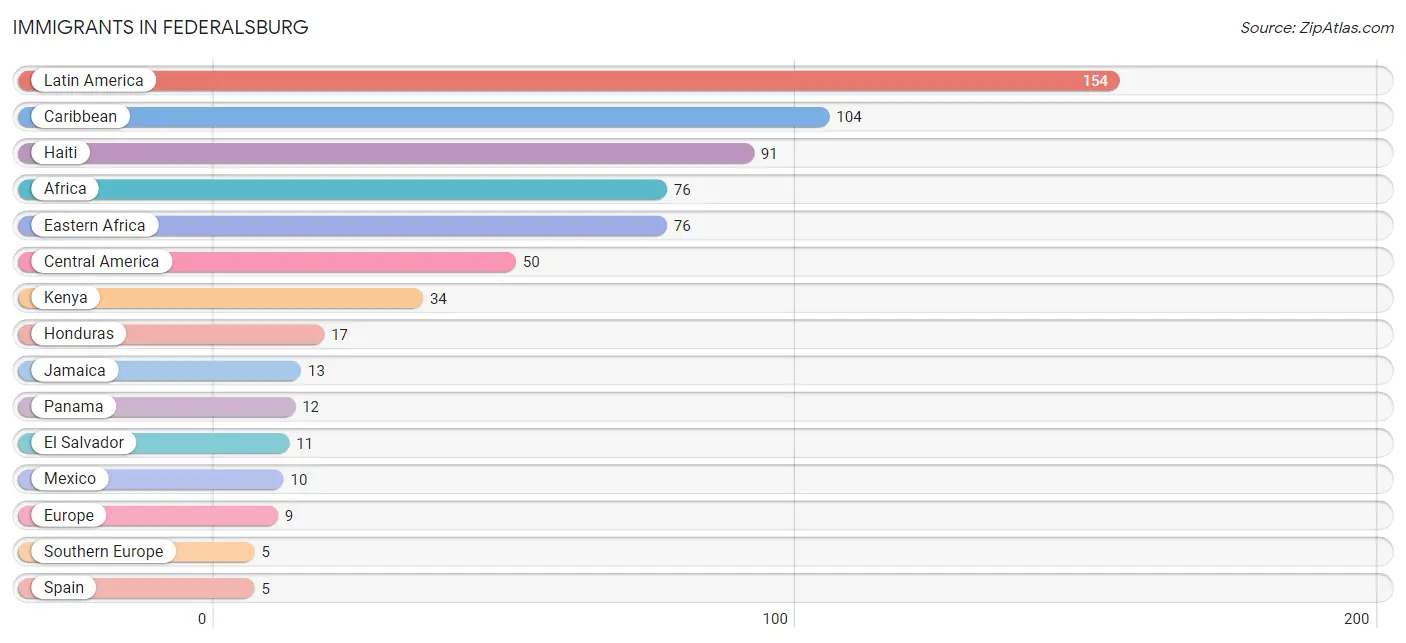
Immigrants in Federalsburg
The most numerous immigrant groups reported in Federalsburg came from Latin America (154 | 5.5%), Caribbean (104 | 3.7%), Haiti (91 | 3.2%), Africa (76 | 2.7%), and Eastern Africa (76 | 2.7%), together accounting for 17.8% of all Federalsburg residents.
| Immigration Origin | # Population | % Population |
| Africa | 76 | 2.7% |
| Caribbean | 104 | 3.7% |
| Central America | 50 | 1.8% |
| Eastern Africa | 76 | 2.7% |
| El Salvador | 11 | 0.4% |
| Europe | 9 | 0.3% |
| Haiti | 91 | 3.2% |
| Honduras | 17 | 0.6% |
| Jamaica | 13 | 0.5% |
| Kenya | 34 | 1.2% |
| Latin America | 154 | 5.5% |
| Mexico | 10 | 0.4% |
| Netherlands | 4 | 0.1% |
| Panama | 12 | 0.4% |
| Southern Europe | 5 | 0.2% |
| Spain | 5 | 0.2% |
| Western Europe | 4 | 0.1% | View All 17 Rows |
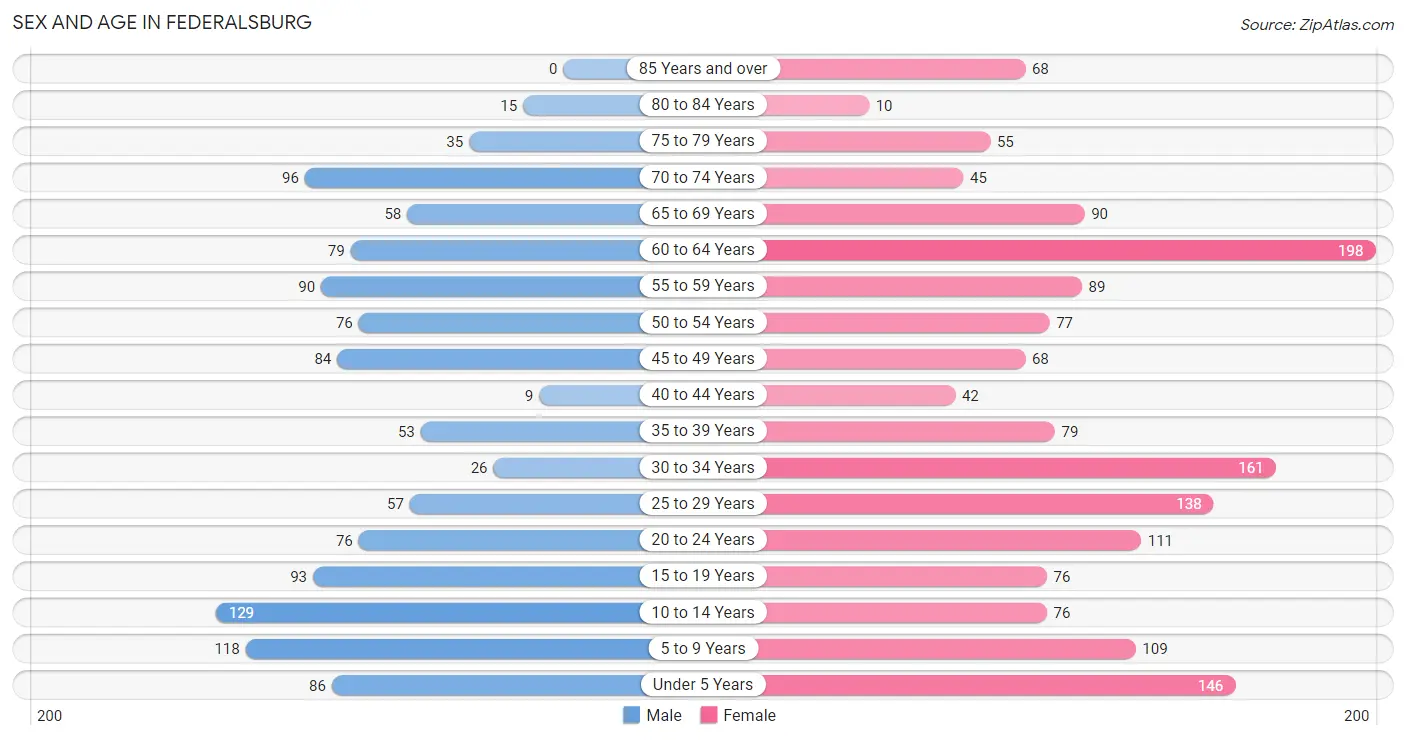
Sex and Age in Federalsburg
Sex and Age in Federalsburg
The most populous age groups in Federalsburg are 10 to 14 Years (129 | 10.9%) for men and 60 to 64 Years (198 | 12.1%) for women.
| Age Bracket | Male | Female |
| Under 5 Years | 86 (7.3%) | 146 (8.9%) |
| 5 to 9 Years | 118 (10.0%) | 109 (6.7%) |
| 10 to 14 Years | 129 (10.9%) | 76 (4.6%) |
| 15 to 19 Years | 93 (7.9%) | 76 (4.6%) |
| 20 to 24 Years | 76 (6.4%) | 111 (6.8%) |
| 25 to 29 Years | 57 (4.8%) | 138 (8.4%) |
| 30 to 34 Years | 26 (2.2%) | 161 (9.8%) |
| 35 to 39 Years | 53 (4.5%) | 79 (4.8%) |
| 40 to 44 Years | 9 (0.8%) | 42 (2.6%) |
| 45 to 49 Years | 84 (7.1%) | 68 (4.2%) |
| 50 to 54 Years | 76 (6.4%) | 77 (4.7%) |
| 55 to 59 Years | 90 (7.6%) | 89 (5.4%) |
| 60 to 64 Years | 79 (6.7%) | 198 (12.1%) |
| 65 to 69 Years | 58 (4.9%) | 90 (5.5%) |
| 70 to 74 Years | 96 (8.1%) | 45 (2.8%) |
| 75 to 79 Years | 35 (3.0%) | 55 (3.4%) |
| 80 to 84 Years | 15 (1.3%) | 10 (0.6%) |
| 85 Years and over | 0 (0.0%) | 68 (4.2%) |
| Total | 1,180 (100.0%) | 1,638 (100.0%) |
Families and Households in Federalsburg
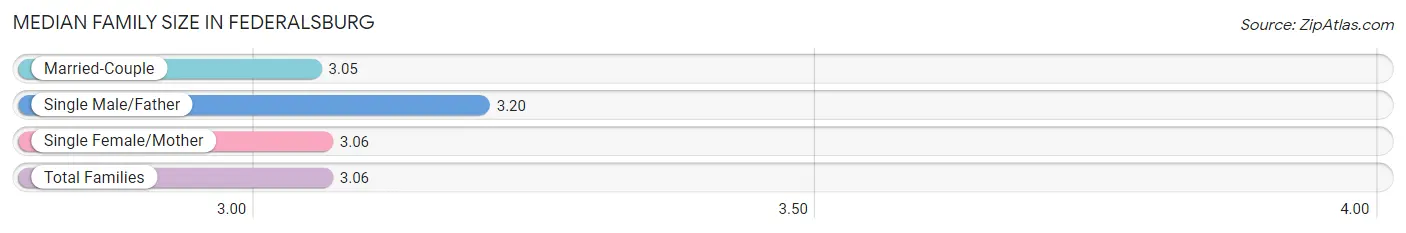
Median Family Size in Federalsburg
The median family size in Federalsburg is 3.06 persons per family, with single male/father families (5 | 0.6%) accounting for the largest median family size of 3.2 persons per family. On the other hand, married-couple families (402 | 51.4%) represent the smallest median family size with 3.05 persons per family.
| Family Type | # Families | Family Size |
| Married-Couple | 402 (51.4%) | 3.05 |
| Single Male/Father | 5 (0.6%) | 3.20 |
| Single Female/Mother | 375 (47.9%) | 3.06 |
| Total Families | 782 (100.0%) | 3.06 |
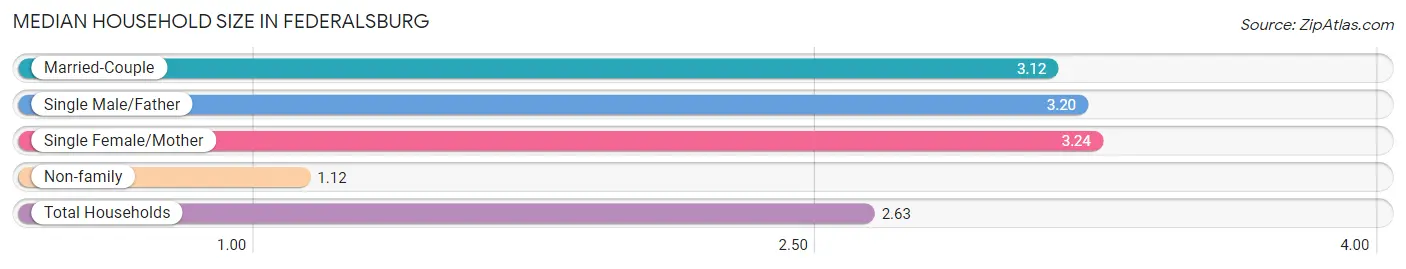
Median Household Size in Federalsburg
The median household size in Federalsburg is 2.63 persons per household, with single female/mother households (375 | 35.1%) accounting for the largest median household size of 3.24 persons per household. non-family households (285 | 26.7%) represent the smallest median household size with 1.12 persons per household.
| Household Type | # Households | Household Size |
| Married-Couple | 402 (37.7%) | 3.12 |
| Single Male/Father | 5 (0.5%) | 3.20 |
| Single Female/Mother | 375 (35.1%) | 3.24 |
| Non-family | 285 (26.7%) | 1.12 |
| Total Households | 1,067 (100.0%) | 2.63 |
Household Size by Marriage Status in Federalsburg
Out of a total of 1,067 households in Federalsburg, 782 (73.3%) are family households, while 285 (26.7%) are nonfamily households. The most numerous type of family households are 2-person households, comprising 343, and the most common type of nonfamily households are 1-person households, comprising 255.
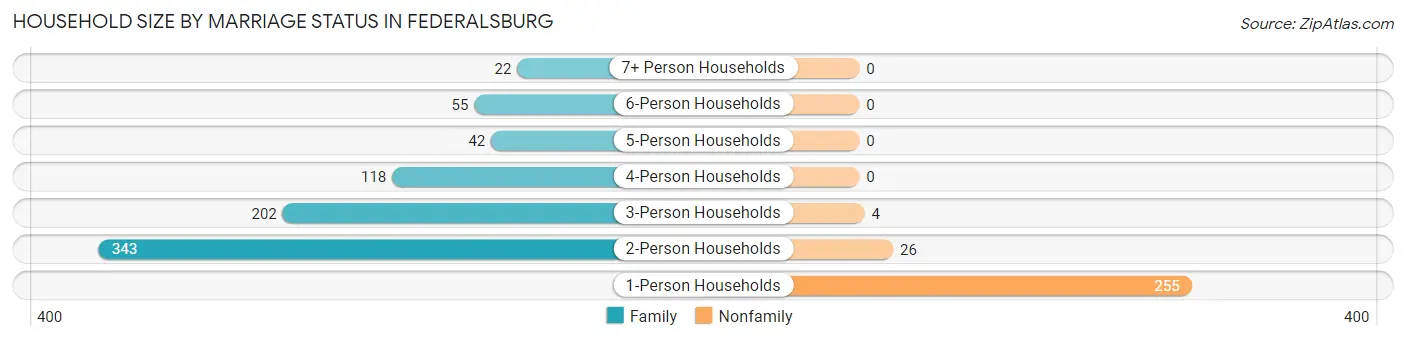
| Household Size | Family Households | Nonfamily Households |
| 1-Person Households | - | 255 (23.9%) |
| 2-Person Households | 343 (32.2%) | 26 (2.4%) |
| 3-Person Households | 202 (18.9%) | 4 (0.4%) |
| 4-Person Households | 118 (11.1%) | 0 (0.0%) |
| 5-Person Households | 42 (3.9%) | 0 (0.0%) |
| 6-Person Households | 55 (5.1%) | 0 (0.0%) |
| 7+ Person Households | 22 (2.1%) | 0 (0.0%) |
| Total | 782 (73.3%) | 285 (26.7%) |
Female Fertility in Federalsburg
Fertility by Age in Federalsburg
Average fertility rate in Federalsburg is 126.0 births per 1,000 women. Women in the age bracket of 20 to 34 years have the highest fertility rate with 200.0 births per 1,000 women. Women in the age bracket of 20 to 34 years acount for 93.2% of all women with births.
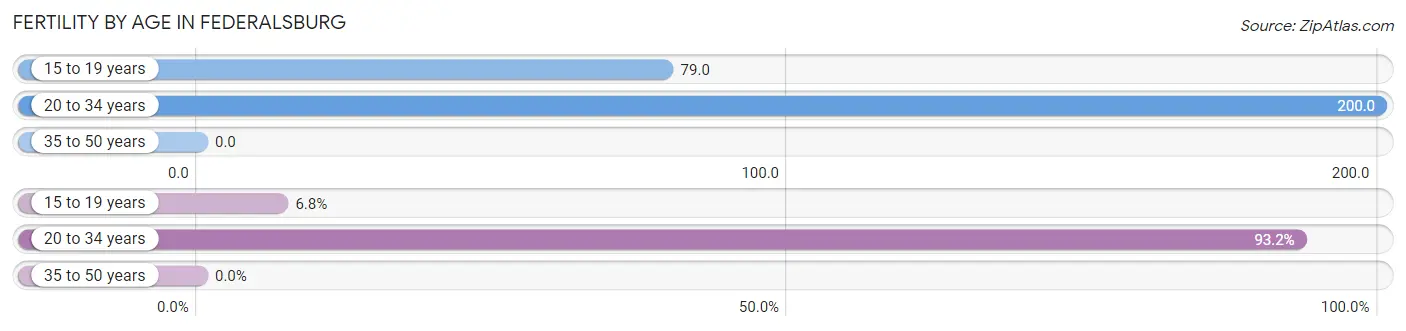
| Age Bracket | Women with Births | Births / 1,000 Women |
| 15 to 19 years | 6 (6.8%) | 79.0 |
| 20 to 34 years | 82 (93.2%) | 200.0 |
| 35 to 50 years | 0 (0.0%) | 0.0 |
| Total | 88 (100.0%) | 126.0 |
Fertility by Age by Marriage Status in Federalsburg
20.5% of women with births (88) in Federalsburg are married. The highest percentage of unmarried women with births falls into 15 to 19 years age bracket with 100.0% of them unmarried at the time of birth, while the lowest percentage of unmarried women with births belong to 20 to 34 years age bracket with 78.0% of them unmarried.
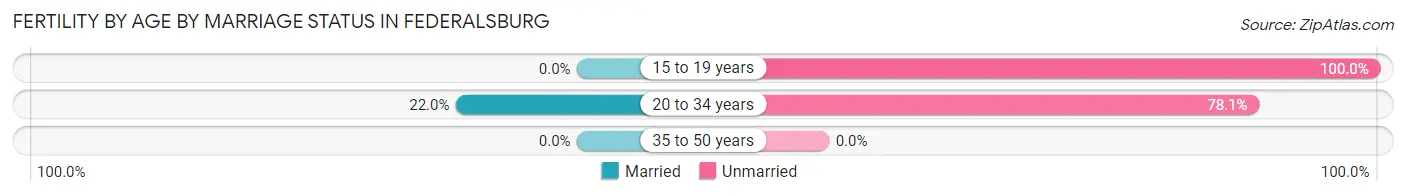
| Age Bracket | Married | Unmarried |
| 15 to 19 years | 0 (0.0%) | 6 (100.0%) |
| 20 to 34 years | 18 (22.0%) | 64 (78.0%) |
| 35 to 50 years | 0 (0.0%) | 0 (0.0%) |
| Total | 18 (20.4%) | 70 (79.5%) |
Fertility by Education in Federalsburg
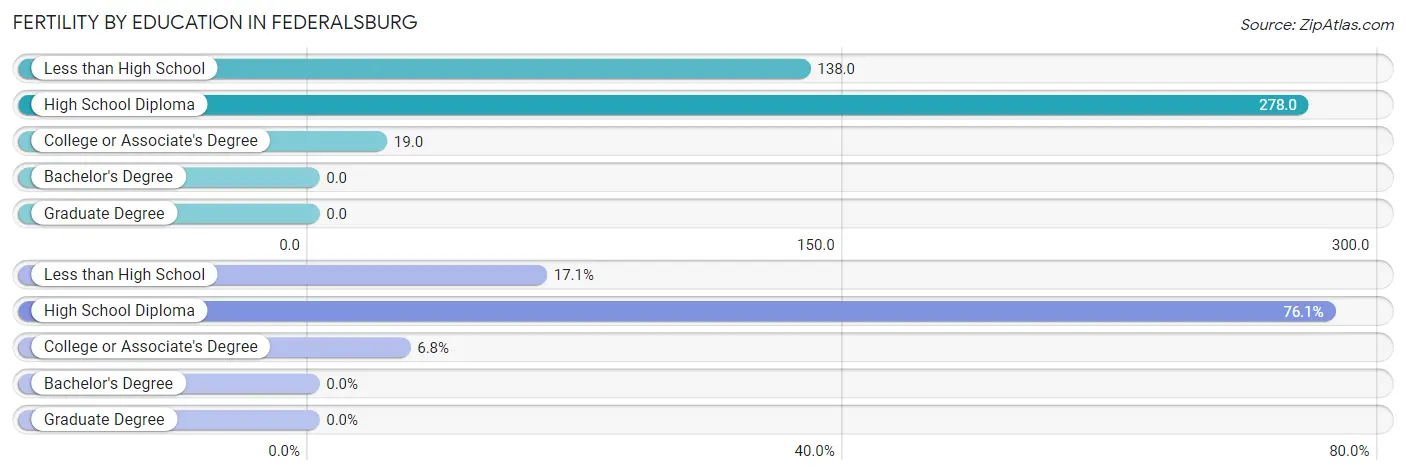
| Educational Attainment | Women with Births | Births / 1,000 Women |
| Less than High School | 15 (17.1%) | 138.0 |
| High School Diploma | 67 (76.1%) | 278.0 |
| College or Associate's Degree | 6 (6.8%) | 19.0 |
| Bachelor's Degree | 0 (0.0%) | 0.0 |
| Graduate Degree | 0 (0.0%) | 0.0 |
| Total | 88 (100.0%) | 126.0 |
Fertility by Education by Marriage Status in Federalsburg
79.5% of women with births in Federalsburg are unmarried. Women with the educational attainment of less than high school are most likely to be married with 100.0% of them married at childbirth, while women with the educational attainment of college or associate's degree are least likely to be married with 100.0% of them unmarried at childbirth.
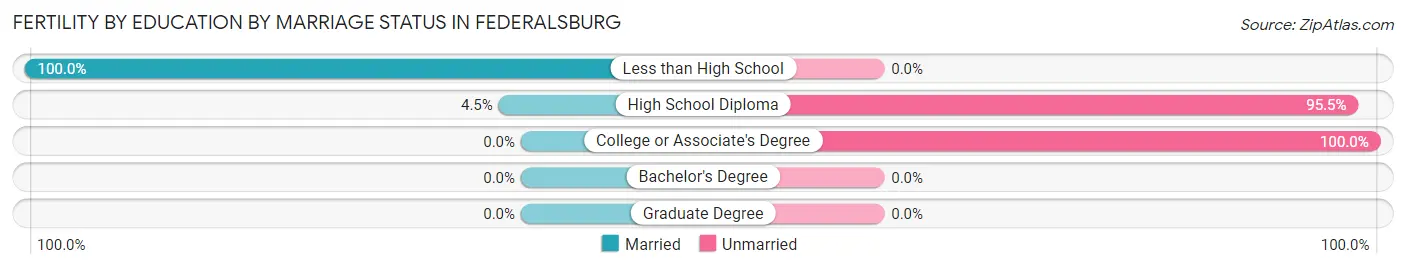
| Educational Attainment | Married | Unmarried |
| Less than High School | 15 (100.0%) | 0 (0.0%) |
| High School Diploma | 3 (4.5%) | 64 (95.5%) |
| College or Associate's Degree | 0 (0.0%) | 6 (100.0%) |
| Bachelor's Degree | 0 (0.0%) | 0 (0.0%) |
| Graduate Degree | 0 (0.0%) | 0 (0.0%) |
| Total | 18 (20.4%) | 70 (79.5%) |
Employment Characteristics in Federalsburg
Employment by Class of Employer in Federalsburg
Among the 1,029 employed individuals in Federalsburg, private company employees (622 | 60.5%), not-for-profit organizations (145 | 14.1%), and self-employed (not incorporated) (66 | 6.4%) make up the most common classes of employment.
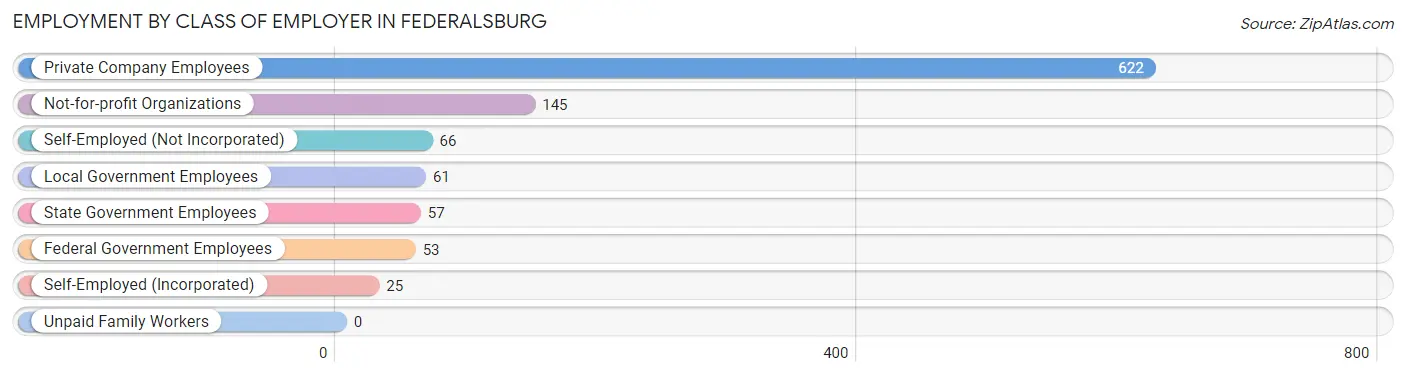
| Employer Class | # Employees | % Employees |
| Private Company Employees | 622 | 60.5% |
| Self-Employed (Incorporated) | 25 | 2.4% |
| Self-Employed (Not Incorporated) | 66 | 6.4% |
| Not-for-profit Organizations | 145 | 14.1% |
| Local Government Employees | 61 | 5.9% |
| State Government Employees | 57 | 5.5% |
| Federal Government Employees | 53 | 5.1% |
| Unpaid Family Workers | 0 | 0.0% |
| Total | 1,029 | 100.0% |
Employment Status by Age in Federalsburg
According to the labor force statistics for Federalsburg, out of the total population over 16 years of age (2,096), 54.2% or 1,136 individuals are in the labor force, with 7.4% or 84 of them unemployed. The age group with the highest labor force participation rate is 30 to 34 years, with 90.9% or 170 individuals in the labor force. Within the labor force, the 60 to 64 years age range has the highest percentage of unemployed individuals, with 20.9% or 38 of them being unemployed.
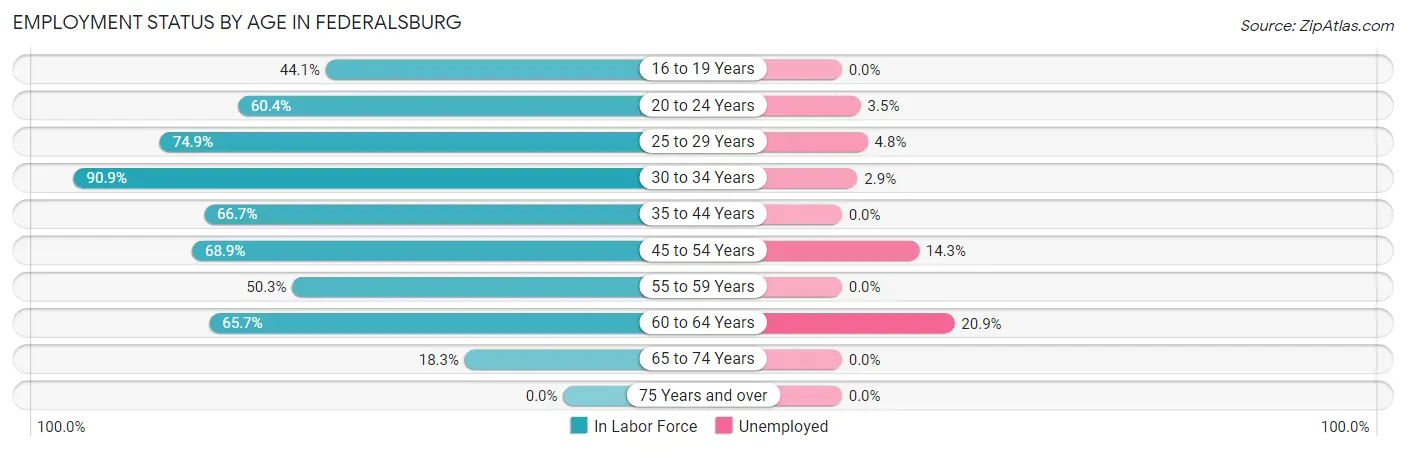
| Age Bracket | In Labor Force | Unemployed |
| 16 to 19 Years | 49 (44.1%) | 0 (0.0%) |
| 20 to 24 Years | 113 (60.4%) | 4 (3.5%) |
| 25 to 29 Years | 146 (74.9%) | 7 (4.8%) |
| 30 to 34 Years | 170 (90.9%) | 5 (2.9%) |
| 35 to 44 Years | 122 (66.7%) | 0 (0.0%) |
| 45 to 54 Years | 210 (68.9%) | 30 (14.3%) |
| 55 to 59 Years | 90 (50.3%) | 0 (0.0%) |
| 60 to 64 Years | 182 (65.7%) | 38 (20.9%) |
| 65 to 74 Years | 53 (18.3%) | 0 (0.0%) |
| 75 Years and over | 0 (0.0%) | 0 (0.0%) |
| Total | 1,136 (54.2%) | 84 (7.4%) |
Employment Status by Educational Attainment in Federalsburg
According to labor force statistics for Federalsburg, 69.4% of individuals (920) out of the total population between 25 and 64 years of age (1,326) are in the labor force, with 8.7% or 80 of them being unemployed. The group with the highest labor force participation rate are those with the educational attainment of bachelor's degree or higher, with 94.5% or 103 individuals in the labor force. Within the labor force, individuals with less than high school education have the highest percentage of unemployment, with 19.1% or 17 of them being unemployed.
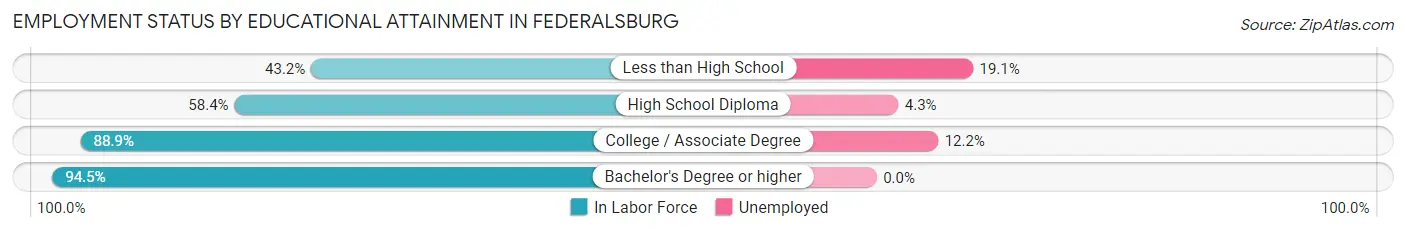
| Educational Attainment | In Labor Force | Unemployed |
| Less than High School | 89 (43.2%) | 39 (19.1%) |
| High School Diploma | 327 (58.4%) | 24 (4.3%) |
| College / Associate Degree | 401 (88.9%) | 55 (12.2%) |
| Bachelor's Degree or higher | 103 (94.5%) | 0 (0.0%) |
| Total | 920 (69.4%) | 115 (8.7%) |
Employment Occupations by Sex in Federalsburg
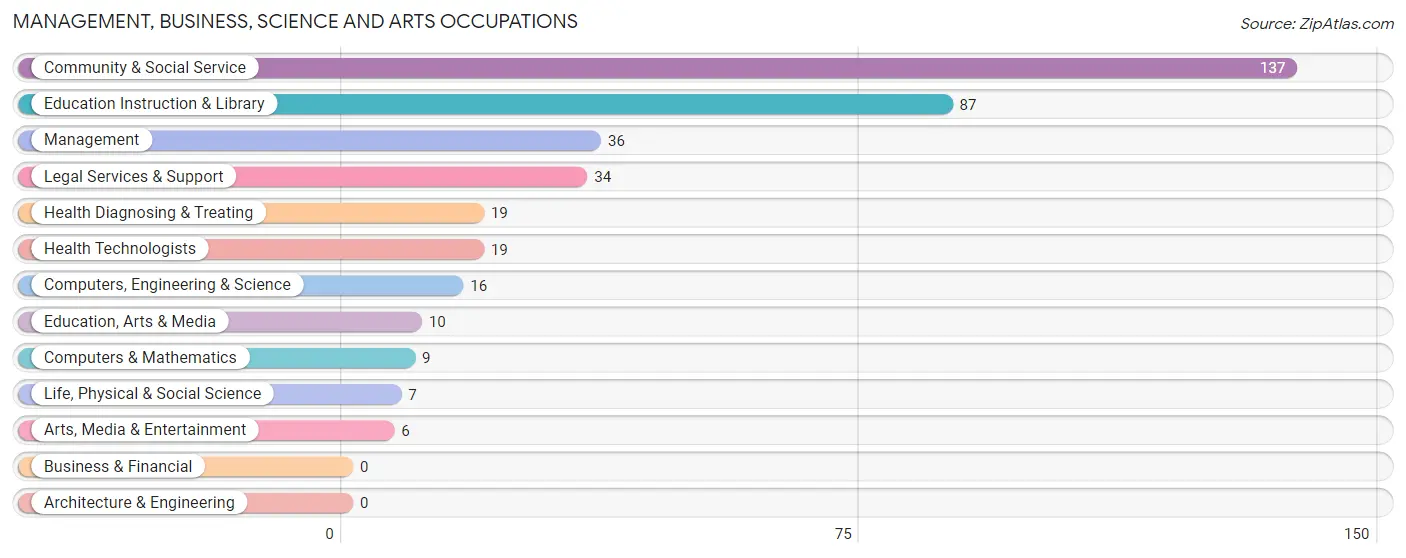
Management, Business, Science and Arts Occupations
The most common Management, Business, Science and Arts occupations in Federalsburg are Community & Social Service (137 | 13.0%), Education Instruction & Library (87 | 8.3%), Management (36 | 3.4%), Legal Services & Support (34 | 3.2%), and Health Diagnosing & Treating (19 | 1.8%).
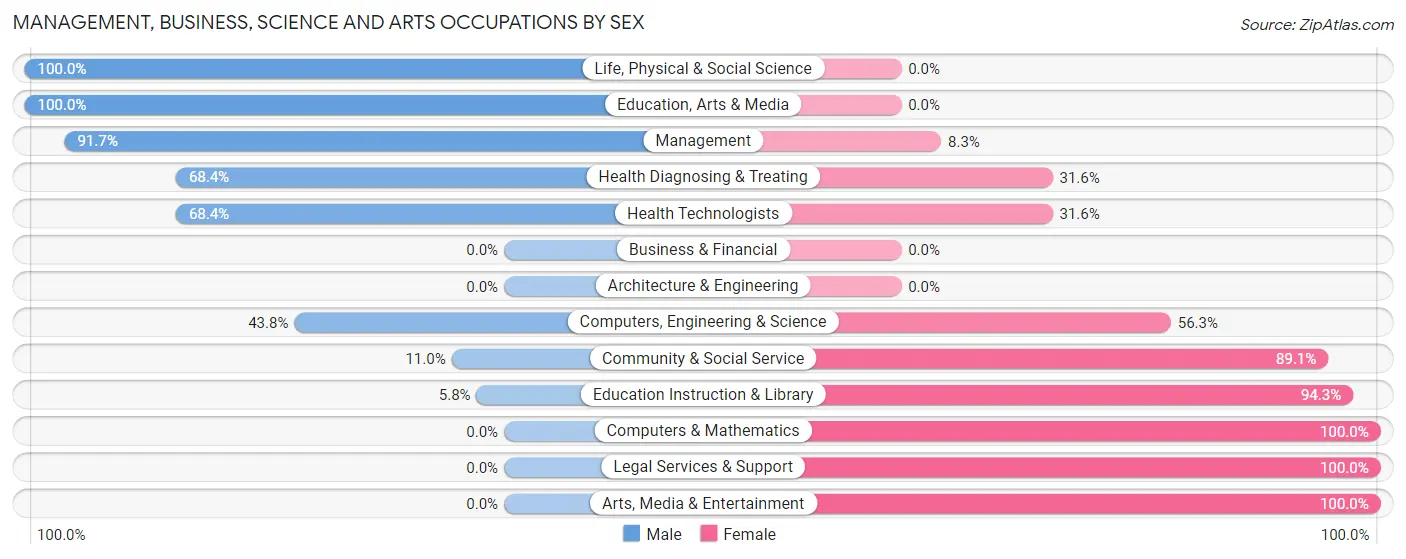
Management, Business, Science and Arts Occupations by Sex
Within the Management, Business, Science and Arts occupations in Federalsburg, the most male-oriented occupations are Life, Physical & Social Science (100.0%), Education, Arts & Media (100.0%), and Management (91.7%), while the most female-oriented occupations are Computers & Mathematics (100.0%), Legal Services & Support (100.0%), and Arts, Media & Entertainment (100.0%).
| Occupation | Male | Female |
| Management | 33 (91.7%) | 3 (8.3%) |
| Business & Financial | 0 (0.0%) | 0 (0.0%) |
| Computers, Engineering & Science | 7 (43.8%) | 9 (56.2%) |
| Computers & Mathematics | 0 (0.0%) | 9 (100.0%) |
| Architecture & Engineering | 0 (0.0%) | 0 (0.0%) |
| Life, Physical & Social Science | 7 (100.0%) | 0 (0.0%) |
| Community & Social Service | 15 (11.0%) | 122 (89.0%) |
| Education, Arts & Media | 10 (100.0%) | 0 (0.0%) |
| Legal Services & Support | 0 (0.0%) | 34 (100.0%) |
| Education Instruction & Library | 5 (5.8%) | 82 (94.3%) |
| Arts, Media & Entertainment | 0 (0.0%) | 6 (100.0%) |
| Health Diagnosing & Treating | 13 (68.4%) | 6 (31.6%) |
| Health Technologists | 13 (68.4%) | 6 (31.6%) |
| Total (Category) | 68 (32.7%) | 140 (67.3%) |
| Total (Overall) | 375 (35.7%) | 676 (64.3%) |
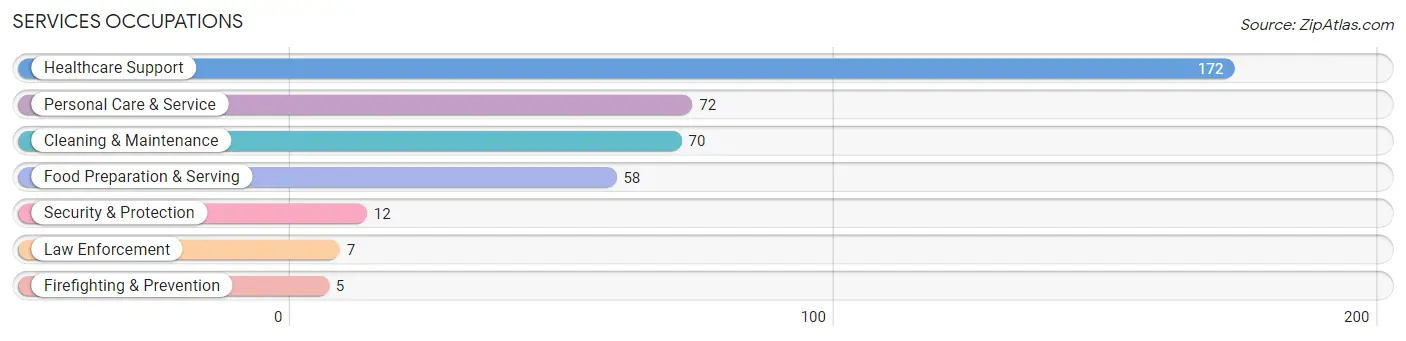
Services Occupations
The most common Services occupations in Federalsburg are Healthcare Support (172 | 16.4%), Personal Care & Service (72 | 6.9%), Cleaning & Maintenance (70 | 6.7%), Food Preparation & Serving (58 | 5.5%), and Security & Protection (12 | 1.1%).
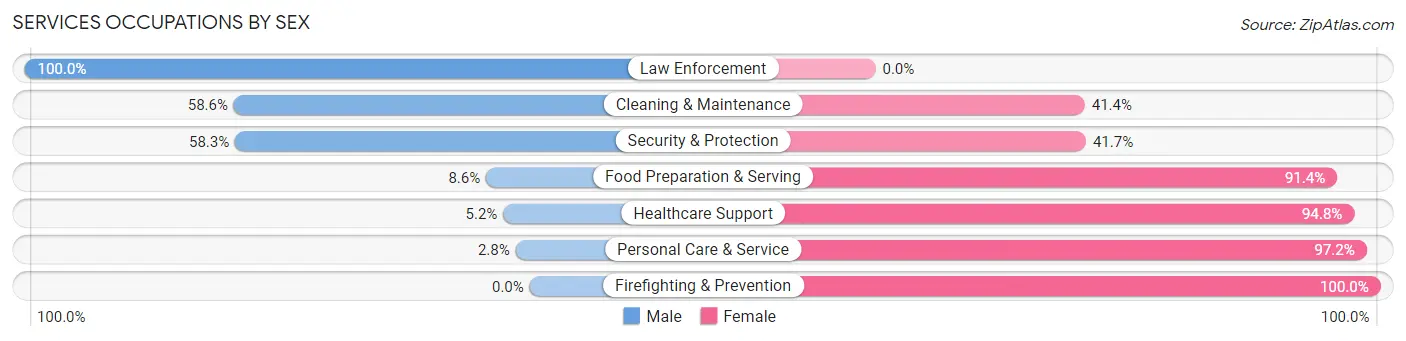
Services Occupations by Sex
Within the Services occupations in Federalsburg, the most male-oriented occupations are Law Enforcement (100.0%), Cleaning & Maintenance (58.6%), and Security & Protection (58.3%), while the most female-oriented occupations are Firefighting & Prevention (100.0%), Personal Care & Service (97.2%), and Healthcare Support (94.8%).
| Occupation | Male | Female |
| Healthcare Support | 9 (5.2%) | 163 (94.8%) |
| Security & Protection | 7 (58.3%) | 5 (41.7%) |
| Firefighting & Prevention | 0 (0.0%) | 5 (100.0%) |
| Law Enforcement | 7 (100.0%) | 0 (0.0%) |
| Food Preparation & Serving | 5 (8.6%) | 53 (91.4%) |
| Cleaning & Maintenance | 41 (58.6%) | 29 (41.4%) |
| Personal Care & Service | 2 (2.8%) | 70 (97.2%) |
| Total (Category) | 64 (16.7%) | 320 (83.3%) |
| Total (Overall) | 375 (35.7%) | 676 (64.3%) |
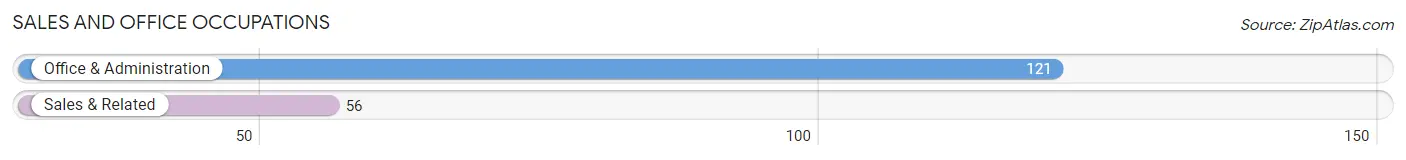
Sales and Office Occupations
The most common Sales and Office occupations in Federalsburg are Office & Administration (121 | 11.5%), and Sales & Related (56 | 5.3%).
Sales and Office Occupations by Sex
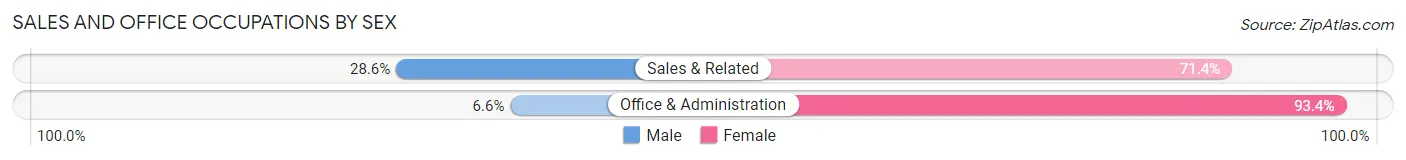
| Occupation | Male | Female |
| Sales & Related | 16 (28.6%) | 40 (71.4%) |
| Office & Administration | 8 (6.6%) | 113 (93.4%) |
| Total (Category) | 24 (13.6%) | 153 (86.4%) |
| Total (Overall) | 375 (35.7%) | 676 (64.3%) |
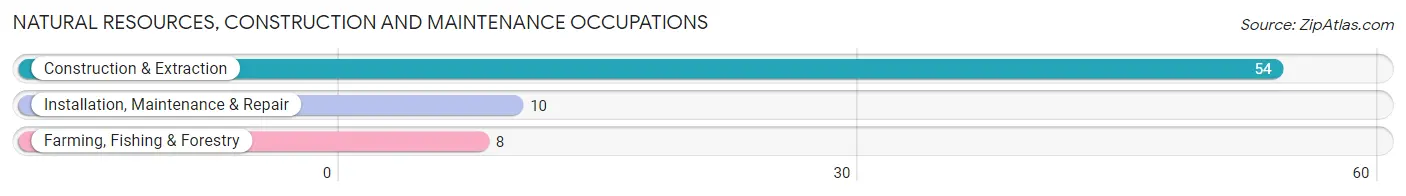
Natural Resources, Construction and Maintenance Occupations
The most common Natural Resources, Construction and Maintenance occupations in Federalsburg are Construction & Extraction (54 | 5.1%), Installation, Maintenance & Repair (10 | 0.9%), and Farming, Fishing & Forestry (8 | 0.8%).
Natural Resources, Construction and Maintenance Occupations by Sex
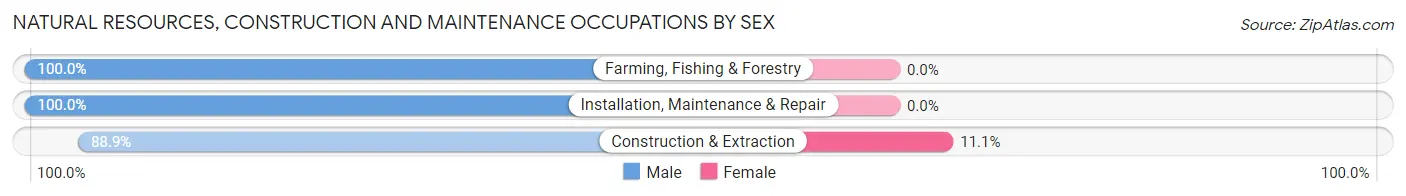
| Occupation | Male | Female |
| Farming, Fishing & Forestry | 8 (100.0%) | 0 (0.0%) |
| Construction & Extraction | 48 (88.9%) | 6 (11.1%) |
| Installation, Maintenance & Repair | 10 (100.0%) | 0 (0.0%) |
| Total (Category) | 66 (91.7%) | 6 (8.3%) |
| Total (Overall) | 375 (35.7%) | 676 (64.3%) |
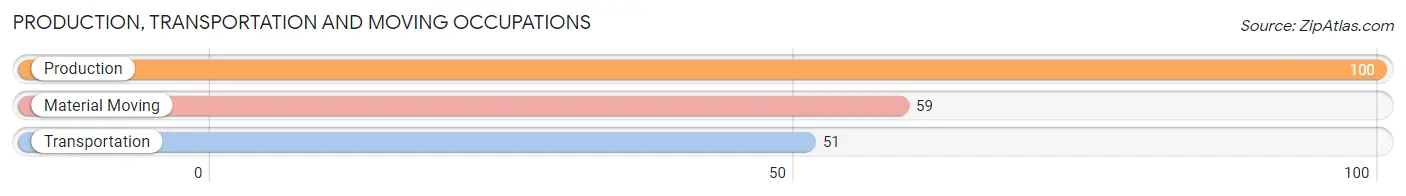
Production, Transportation and Moving Occupations
The most common Production, Transportation and Moving occupations in Federalsburg are Production (100 | 9.5%), Material Moving (59 | 5.6%), and Transportation (51 | 4.9%).
Production, Transportation and Moving Occupations by Sex
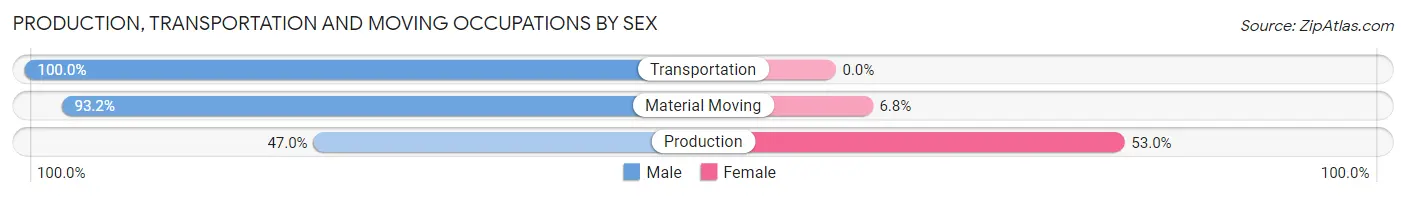
| Occupation | Male | Female |
| Production | 47 (47.0%) | 53 (53.0%) |
| Transportation | 51 (100.0%) | 0 (0.0%) |
| Material Moving | 55 (93.2%) | 4 (6.8%) |
| Total (Category) | 153 (72.9%) | 57 (27.1%) |
| Total (Overall) | 375 (35.7%) | 676 (64.3%) |
Employment Industries by Sex in Federalsburg
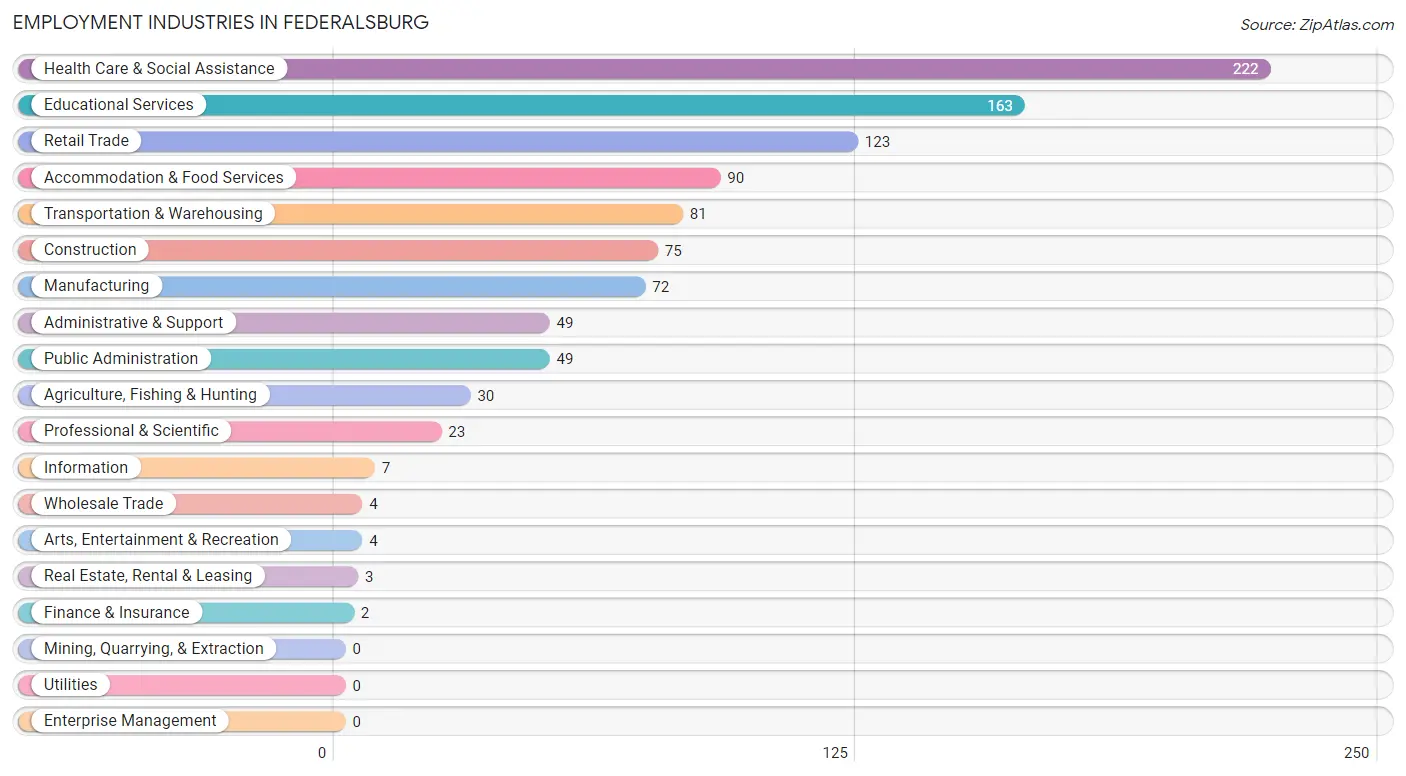
Employment Industries in Federalsburg
The major employment industries in Federalsburg include Health Care & Social Assistance (222 | 21.1%), Educational Services (163 | 15.5%), Retail Trade (123 | 11.7%), Accommodation & Food Services (90 | 8.6%), and Transportation & Warehousing (81 | 7.7%).
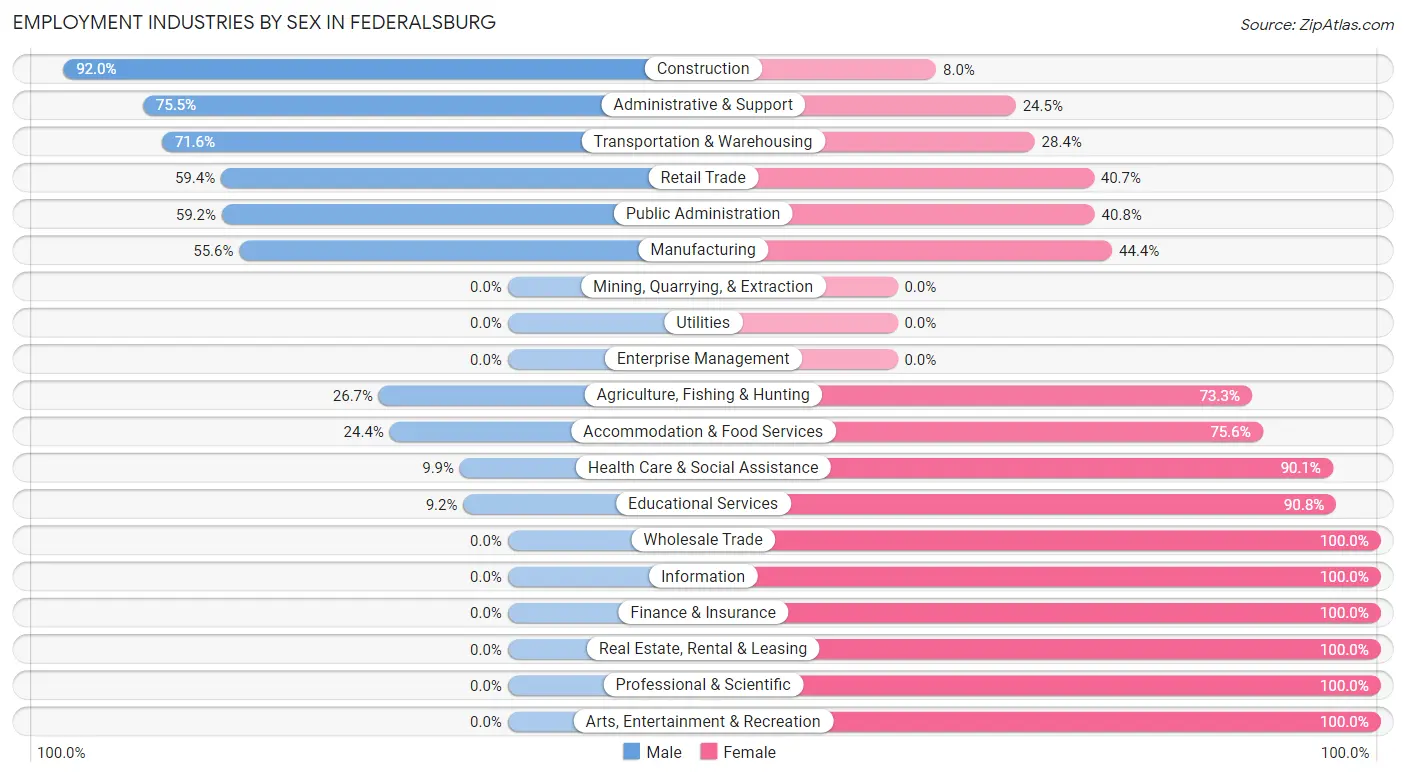
Employment Industries by Sex in Federalsburg
The Federalsburg industries that see more men than women are Construction (92.0%), Administrative & Support (75.5%), and Transportation & Warehousing (71.6%), whereas the industries that tend to have a higher number of women are Wholesale Trade (100.0%), Information (100.0%), and Finance & Insurance (100.0%).
| Industry | Male | Female |
| Agriculture, Fishing & Hunting | 8 (26.7%) | 22 (73.3%) |
| Mining, Quarrying, & Extraction | 0 (0.0%) | 0 (0.0%) |
| Construction | 69 (92.0%) | 6 (8.0%) |
| Manufacturing | 40 (55.6%) | 32 (44.4%) |
| Wholesale Trade | 0 (0.0%) | 4 (100.0%) |
| Retail Trade | 73 (59.4%) | 50 (40.6%) |
| Transportation & Warehousing | 58 (71.6%) | 23 (28.4%) |
| Utilities | 0 (0.0%) | 0 (0.0%) |
| Information | 0 (0.0%) | 7 (100.0%) |
| Finance & Insurance | 0 (0.0%) | 2 (100.0%) |
| Real Estate, Rental & Leasing | 0 (0.0%) | 3 (100.0%) |
| Professional & Scientific | 0 (0.0%) | 23 (100.0%) |
| Enterprise Management | 0 (0.0%) | 0 (0.0%) |
| Administrative & Support | 37 (75.5%) | 12 (24.5%) |
| Educational Services | 15 (9.2%) | 148 (90.8%) |
| Health Care & Social Assistance | 22 (9.9%) | 200 (90.1%) |
| Arts, Entertainment & Recreation | 0 (0.0%) | 4 (100.0%) |
| Accommodation & Food Services | 22 (24.4%) | 68 (75.6%) |
| Public Administration | 29 (59.2%) | 20 (40.8%) |
| Total | 375 (35.7%) | 676 (64.3%) |
Education in Federalsburg
School Enrollment in Federalsburg
The most common levels of schooling among the 841 students in Federalsburg are college / undergraduate (211 | 25.1%), elementary school (184 | 21.9%), and middle school (182 | 21.6%).
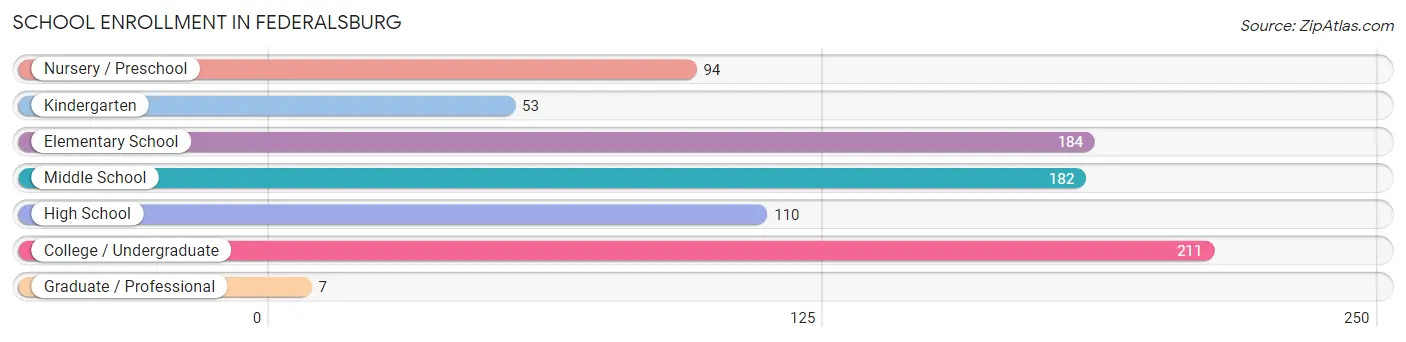
| School Level | # Students | % Students |
| Nursery / Preschool | 94 | 11.2% |
| Kindergarten | 53 | 6.3% |
| Elementary School | 184 | 21.9% |
| Middle School | 182 | 21.6% |
| High School | 110 | 13.1% |
| College / Undergraduate | 211 | 25.1% |
| Graduate / Professional | 7 | 0.8% |
| Total | 841 | 100.0% |
School Enrollment by Age by Funding Source in Federalsburg
Out of a total of 841 students who are enrolled in schools in Federalsburg, 120 (14.3%) attend a private institution, while the remaining 721 (85.7%) are enrolled in public schools. The age group of 18 to 19 year olds has the highest likelihood of being enrolled in private schools, with 19 (82.6% in the age bracket) enrolled. Conversely, the age group of 10 to 14 year olds has the lowest likelihood of being enrolled in a private school, with 205 (100.0% in the age bracket) attending a public institution.
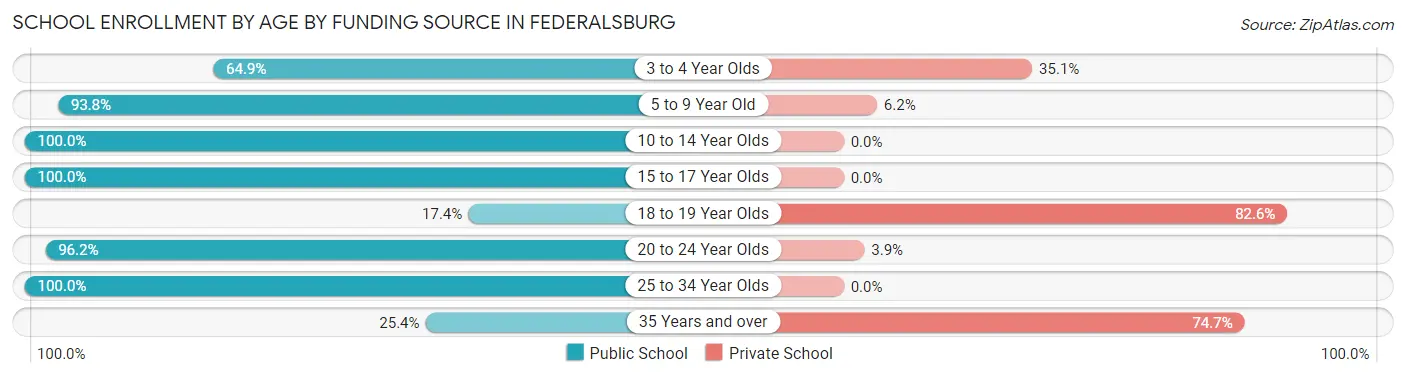
| Age Bracket | Public School | Private School |
| 3 to 4 Year Olds | 61 (64.9%) | 33 (35.1%) |
| 5 to 9 Year Old | 197 (93.8%) | 13 (6.2%) |
| 10 to 14 Year Olds | 205 (100.0%) | 0 (0.0%) |
| 15 to 17 Year Olds | 101 (100.0%) | 0 (0.0%) |
| 18 to 19 Year Olds | 4 (17.4%) | 19 (82.6%) |
| 20 to 24 Year Olds | 50 (96.2%) | 2 (3.8%) |
| 25 to 34 Year Olds | 85 (100.0%) | 0 (0.0%) |
| 35 Years and over | 18 (25.4%) | 53 (74.7%) |
| Total | 721 (85.7%) | 120 (14.3%) |
Educational Attainment by Field of Study in Federalsburg
Education (54 | 36.2%), business (24 | 16.1%), social sciences (21 | 14.1%), bio, nature & agricultural (20 | 13.4%), and science & technology (14 | 9.4%) are the most common fields of study among 149 individuals in Federalsburg who have obtained a bachelor's degree or higher.
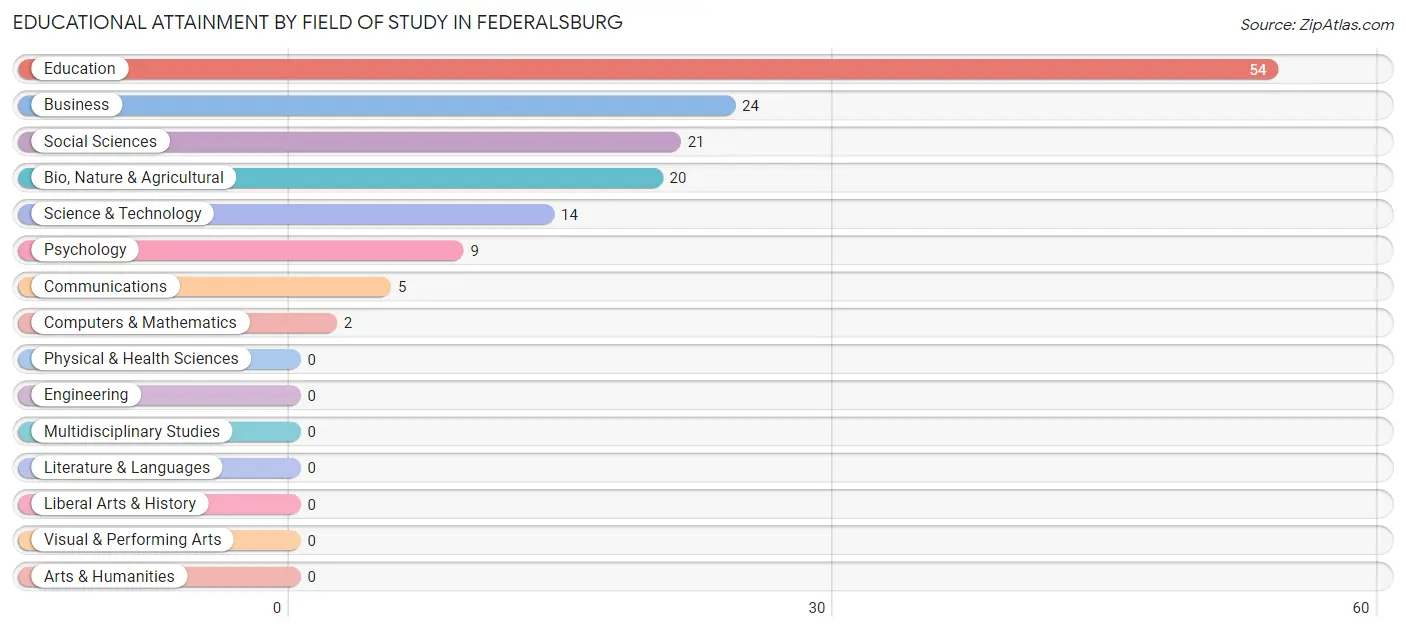
| Field of Study | # Graduates | % Graduates |
| Computers & Mathematics | 2 | 1.3% |
| Bio, Nature & Agricultural | 20 | 13.4% |
| Physical & Health Sciences | 0 | 0.0% |
| Psychology | 9 | 6.0% |
| Social Sciences | 21 | 14.1% |
| Engineering | 0 | 0.0% |
| Multidisciplinary Studies | 0 | 0.0% |
| Science & Technology | 14 | 9.4% |
| Business | 24 | 16.1% |
| Education | 54 | 36.2% |
| Literature & Languages | 0 | 0.0% |
| Liberal Arts & History | 0 | 0.0% |
| Visual & Performing Arts | 0 | 0.0% |
| Communications | 5 | 3.4% |
| Arts & Humanities | 0 | 0.0% |
| Total | 149 | 100.0% |
Transportation & Commute in Federalsburg
Vehicle Availability by Sex in Federalsburg
The most prevalent vehicle ownership categories in Federalsburg are males with 2 vehicles (118, accounting for 31.5%) and females with 2 vehicles (233, making up 18.1%).
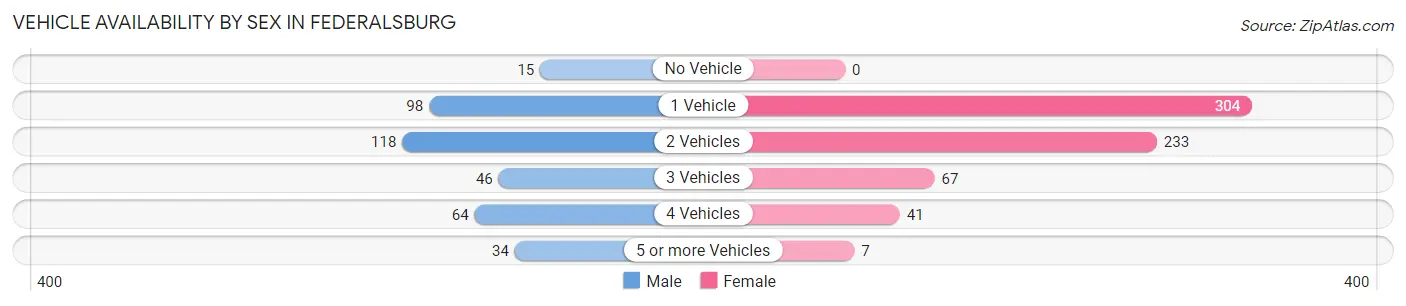
| Vehicles Available | Male | Female |
| No Vehicle | 15 (4.0%) | 0 (0.0%) |
| 1 Vehicle | 98 (26.1%) | 304 (46.6%) |
| 2 Vehicles | 118 (31.5%) | 233 (35.7%) |
| 3 Vehicles | 46 (12.3%) | 67 (10.3%) |
| 4 Vehicles | 64 (17.1%) | 41 (6.3%) |
| 5 or more Vehicles | 34 (9.1%) | 7 (1.1%) |
| Total | 375 (100.0%) | 652 (100.0%) |
Commute Time in Federalsburg
The most frequently occuring commute durations in Federalsburg are 30 to 34 minutes (199 commuters, 20.3%), 20 to 24 minutes (175 commuters, 17.9%), and 40 to 44 minutes (125 commuters, 12.8%).
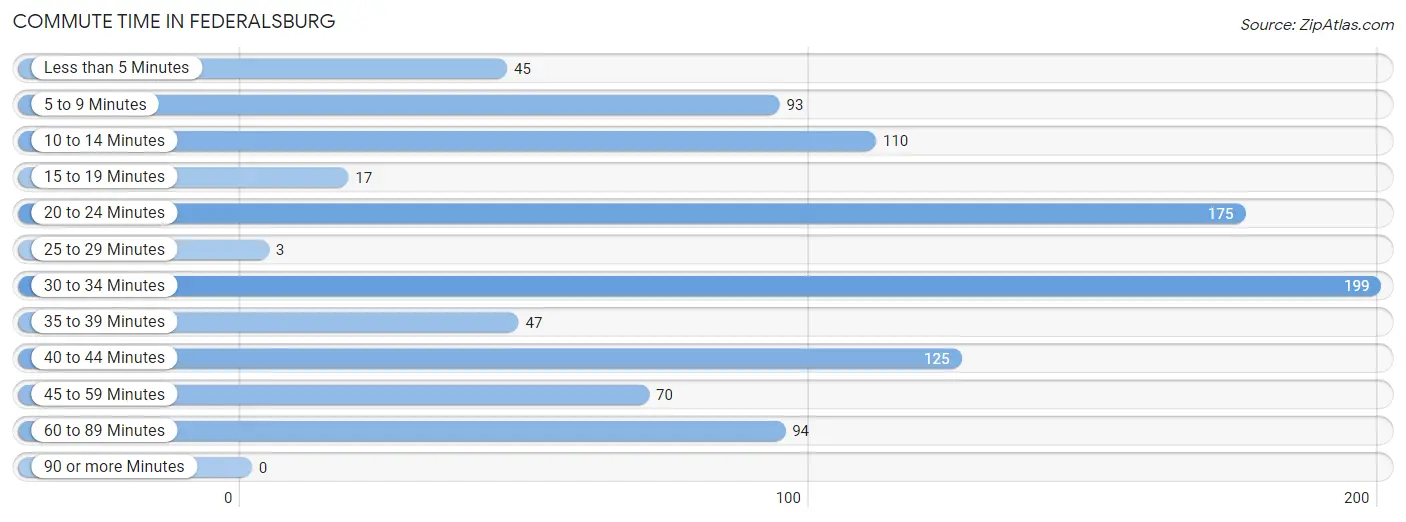
| Commute Time | # Commuters | % Commuters |
| Less than 5 Minutes | 45 | 4.6% |
| 5 to 9 Minutes | 93 | 9.5% |
| 10 to 14 Minutes | 110 | 11.3% |
| 15 to 19 Minutes | 17 | 1.7% |
| 20 to 24 Minutes | 175 | 17.9% |
| 25 to 29 Minutes | 3 | 0.3% |
| 30 to 34 Minutes | 199 | 20.3% |
| 35 to 39 Minutes | 47 | 4.8% |
| 40 to 44 Minutes | 125 | 12.8% |
| 45 to 59 Minutes | 70 | 7.2% |
| 60 to 89 Minutes | 94 | 9.6% |
| 90 or more Minutes | 0 | 0.0% |
Commute Time by Sex in Federalsburg
The most common commute times in Federalsburg are 30 to 34 minutes (79 commuters, 21.6%) for males and 20 to 24 minutes (136 commuters, 22.2%) for females.
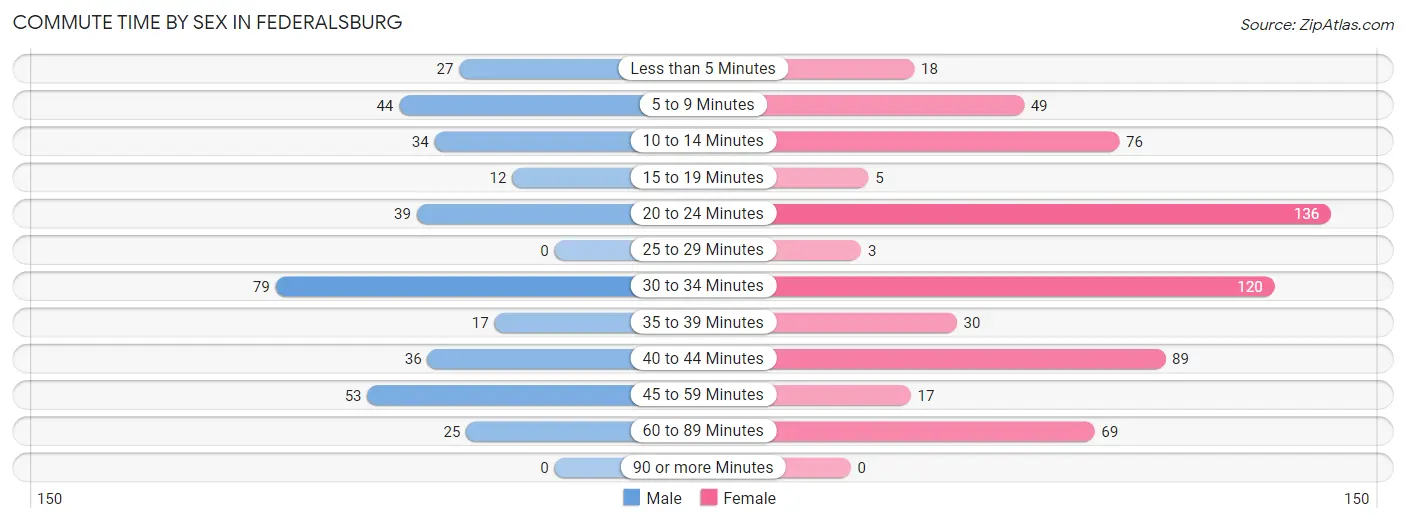
| Commute Time | Male | Female |
| Less than 5 Minutes | 27 (7.4%) | 18 (2.9%) |
| 5 to 9 Minutes | 44 (12.0%) | 49 (8.0%) |
| 10 to 14 Minutes | 34 (9.3%) | 76 (12.4%) |
| 15 to 19 Minutes | 12 (3.3%) | 5 (0.8%) |
| 20 to 24 Minutes | 39 (10.7%) | 136 (22.2%) |
| 25 to 29 Minutes | 0 (0.0%) | 3 (0.5%) |
| 30 to 34 Minutes | 79 (21.6%) | 120 (19.6%) |
| 35 to 39 Minutes | 17 (4.6%) | 30 (4.9%) |
| 40 to 44 Minutes | 36 (9.8%) | 89 (14.5%) |
| 45 to 59 Minutes | 53 (14.5%) | 17 (2.8%) |
| 60 to 89 Minutes | 25 (6.8%) | 69 (11.3%) |
| 90 or more Minutes | 0 (0.0%) | 0 (0.0%) |
Time of Departure to Work by Sex in Federalsburg
The most frequent times of departure to work in Federalsburg are 6:00 AM to 6:29 AM (99, 27.1%) for males and 4:00 PM to 11:59 PM (141, 23.0%) for females.
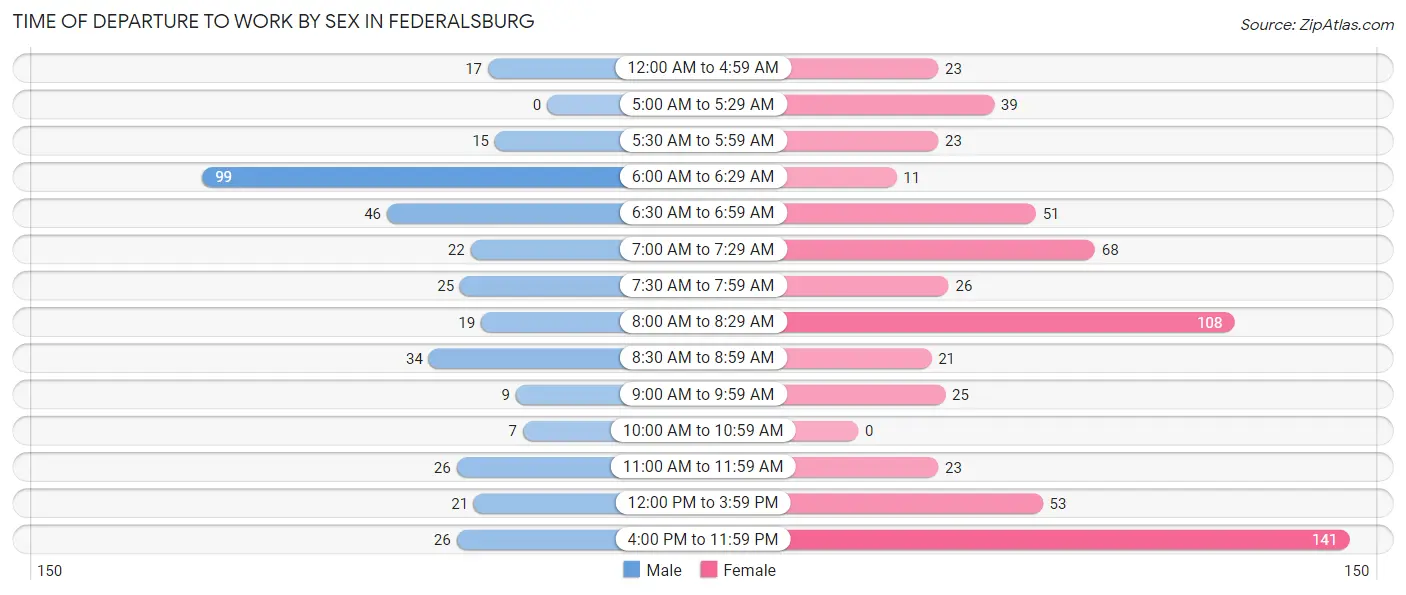
| Time of Departure | Male | Female |
| 12:00 AM to 4:59 AM | 17 (4.6%) | 23 (3.8%) |
| 5:00 AM to 5:29 AM | 0 (0.0%) | 39 (6.4%) |
| 5:30 AM to 5:59 AM | 15 (4.1%) | 23 (3.8%) |
| 6:00 AM to 6:29 AM | 99 (27.1%) | 11 (1.8%) |
| 6:30 AM to 6:59 AM | 46 (12.6%) | 51 (8.3%) |
| 7:00 AM to 7:29 AM | 22 (6.0%) | 68 (11.1%) |
| 7:30 AM to 7:59 AM | 25 (6.8%) | 26 (4.3%) |
| 8:00 AM to 8:29 AM | 19 (5.2%) | 108 (17.6%) |
| 8:30 AM to 8:59 AM | 34 (9.3%) | 21 (3.4%) |
| 9:00 AM to 9:59 AM | 9 (2.5%) | 25 (4.1%) |
| 10:00 AM to 10:59 AM | 7 (1.9%) | 0 (0.0%) |
| 11:00 AM to 11:59 AM | 26 (7.1%) | 23 (3.8%) |
| 12:00 PM to 3:59 PM | 21 (5.7%) | 53 (8.7%) |
| 4:00 PM to 11:59 PM | 26 (7.1%) | 141 (23.0%) |
| Total | 366 (100.0%) | 612 (100.0%) |
Housing Occupancy in Federalsburg
Occupancy by Ownership in Federalsburg
Of the total 1,067 dwellings in Federalsburg, owner-occupied units account for 428 (40.1%), while renter-occupied units make up 639 (59.9%).
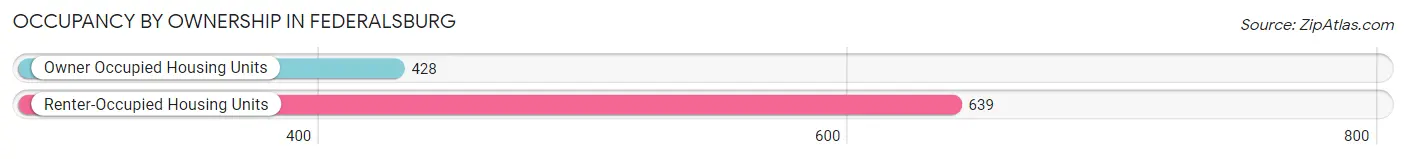
| Occupancy | # Housing Units | % Housing Units |
| Owner Occupied Housing Units | 428 | 40.1% |
| Renter-Occupied Housing Units | 639 | 59.9% |
| Total Occupied Housing Units | 1,067 | 100.0% |
Occupancy by Household Size in Federalsburg
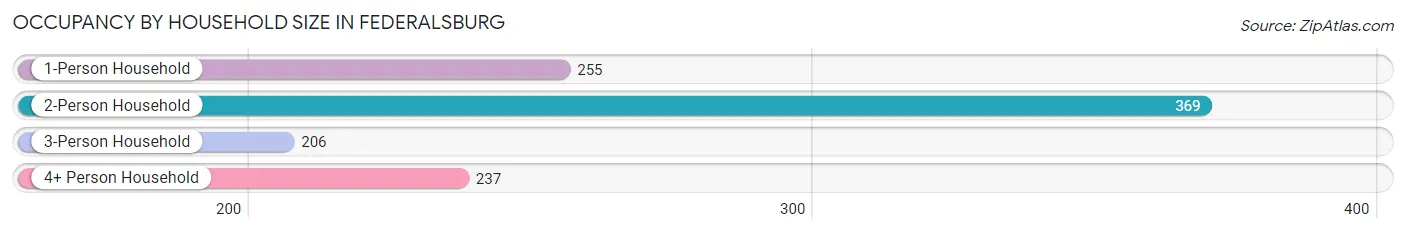
| Household Size | # Housing Units | % Housing Units |
| 1-Person Household | 255 | 23.9% |
| 2-Person Household | 369 | 34.6% |
| 3-Person Household | 206 | 19.3% |
| 4+ Person Household | 237 | 22.2% |
| Total Housing Units | 1,067 | 100.0% |
Occupancy by Ownership by Household Size in Federalsburg
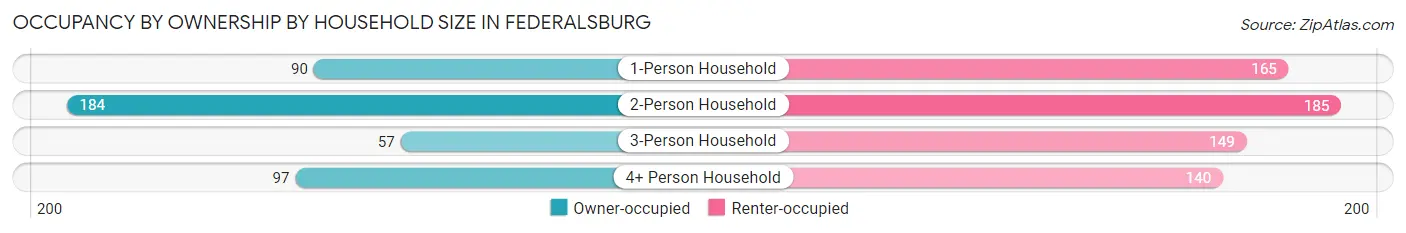
| Household Size | Owner-occupied | Renter-occupied |
| 1-Person Household | 90 (35.3%) | 165 (64.7%) |
| 2-Person Household | 184 (49.9%) | 185 (50.1%) |
| 3-Person Household | 57 (27.7%) | 149 (72.3%) |
| 4+ Person Household | 97 (40.9%) | 140 (59.1%) |
| Total Housing Units | 428 (40.1%) | 639 (59.9%) |
Occupancy by Educational Attainment in Federalsburg
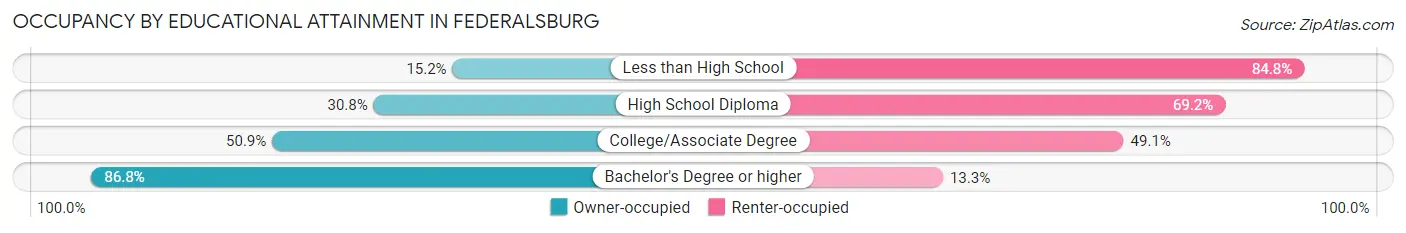
| Household Size | Owner-occupied | Renter-occupied |
| Less than High School | 22 (15.2%) | 123 (84.8%) |
| High School Diploma | 143 (30.8%) | 321 (69.2%) |
| College/Associate Degree | 191 (50.9%) | 184 (49.1%) |
| Bachelor's Degree or higher | 72 (86.8%) | 11 (13.3%) |
Occupancy by Age of Householder in Federalsburg
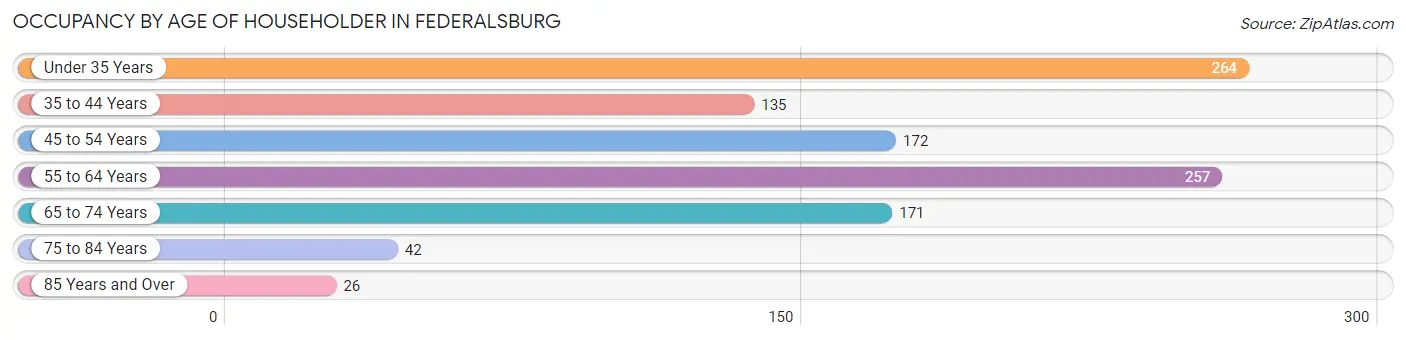
| Age Bracket | # Households | % Households |
| Under 35 Years | 264 | 24.7% |
| 35 to 44 Years | 135 | 12.7% |
| 45 to 54 Years | 172 | 16.1% |
| 55 to 64 Years | 257 | 24.1% |
| 65 to 74 Years | 171 | 16.0% |
| 75 to 84 Years | 42 | 3.9% |
| 85 Years and Over | 26 | 2.4% |
| Total | 1,067 | 100.0% |
Housing Finances in Federalsburg
Median Income by Occupancy in Federalsburg
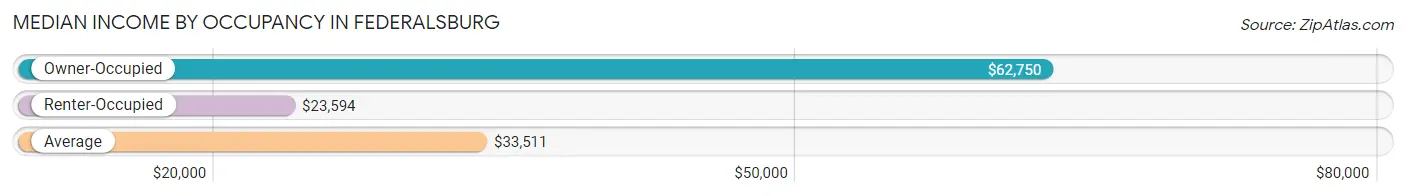
| Occupancy Type | # Households | Median Income |
| Owner-Occupied | 428 (40.1%) | $62,750 |
| Renter-Occupied | 639 (59.9%) | $23,594 |
| Average | 1,067 (100.0%) | $33,511 |
Occupancy by Householder Income Bracket in Federalsburg
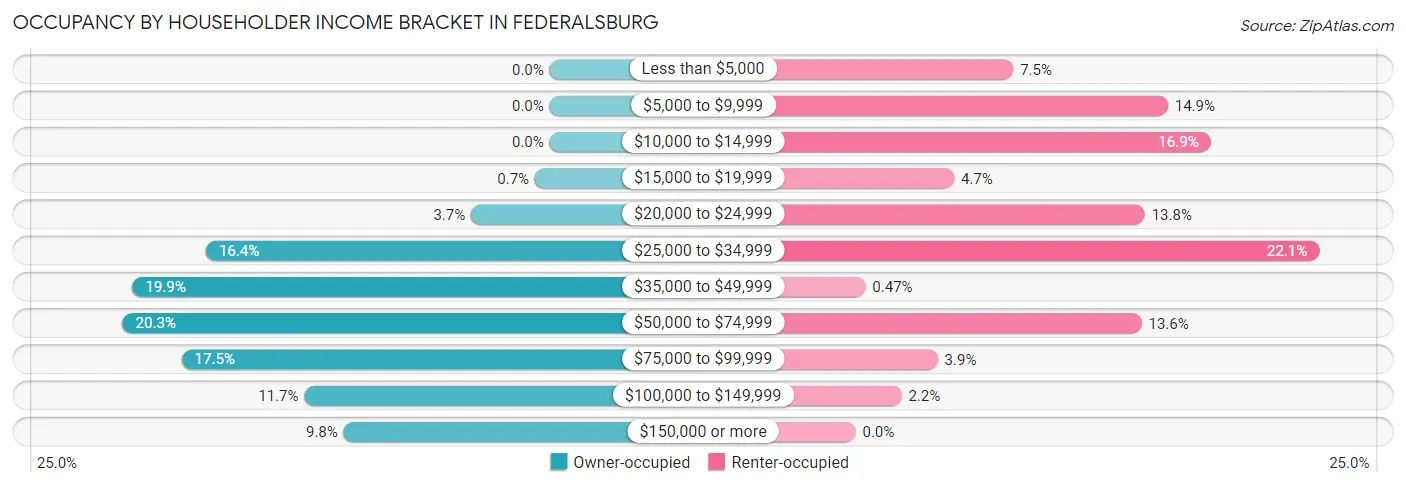
| Income Bracket | Owner-occupied | Renter-occupied |
| Less than $5,000 | 0 (0.0%) | 48 (7.5%) |
| $5,000 to $9,999 | 0 (0.0%) | 95 (14.9%) |
| $10,000 to $14,999 | 0 (0.0%) | 108 (16.9%) |
| $15,000 to $19,999 | 3 (0.7%) | 30 (4.7%) |
| $20,000 to $24,999 | 16 (3.7%) | 88 (13.8%) |
| $25,000 to $34,999 | 70 (16.4%) | 141 (22.1%) |
| $35,000 to $49,999 | 85 (19.9%) | 3 (0.5%) |
| $50,000 to $74,999 | 87 (20.3%) | 87 (13.6%) |
| $75,000 to $99,999 | 75 (17.5%) | 25 (3.9%) |
| $100,000 to $149,999 | 50 (11.7%) | 14 (2.2%) |
| $150,000 or more | 42 (9.8%) | 0 (0.0%) |
| Total | 428 (100.0%) | 639 (100.0%) |
Monthly Housing Cost Tiers in Federalsburg
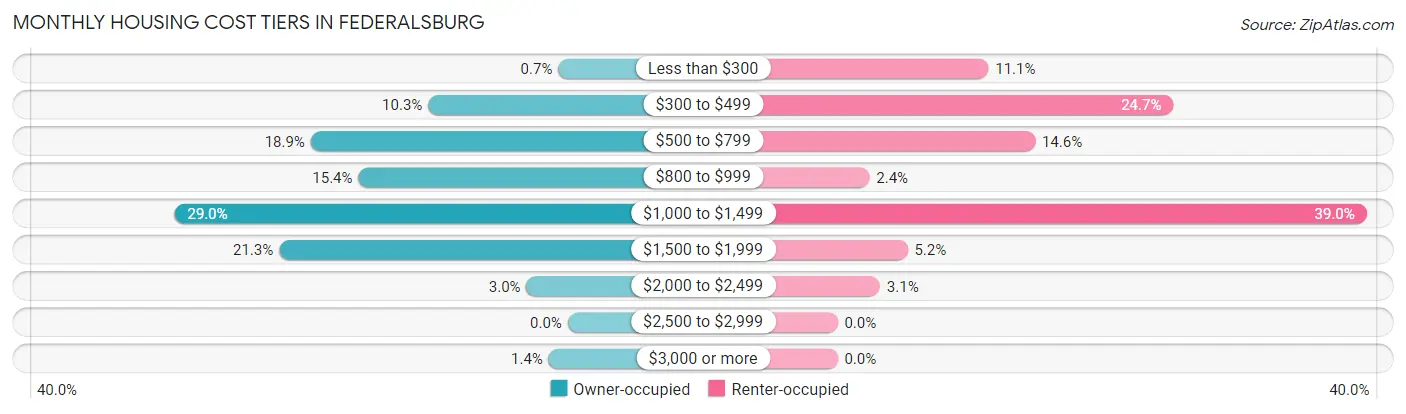
| Monthly Cost | Owner-occupied | Renter-occupied |
| Less than $300 | 3 (0.7%) | 71 (11.1%) |
| $300 to $499 | 44 (10.3%) | 158 (24.7%) |
| $500 to $799 | 81 (18.9%) | 93 (14.5%) |
| $800 to $999 | 66 (15.4%) | 15 (2.4%) |
| $1,000 to $1,499 | 124 (29.0%) | 249 (39.0%) |
| $1,500 to $1,999 | 91 (21.3%) | 33 (5.2%) |
| $2,000 to $2,499 | 13 (3.0%) | 20 (3.1%) |
| $2,500 to $2,999 | 0 (0.0%) | 0 (0.0%) |
| $3,000 or more | 6 (1.4%) | 0 (0.0%) |
| Total | 428 (100.0%) | 639 (100.0%) |
Physical Housing Characteristics in Federalsburg
Housing Structures in Federalsburg
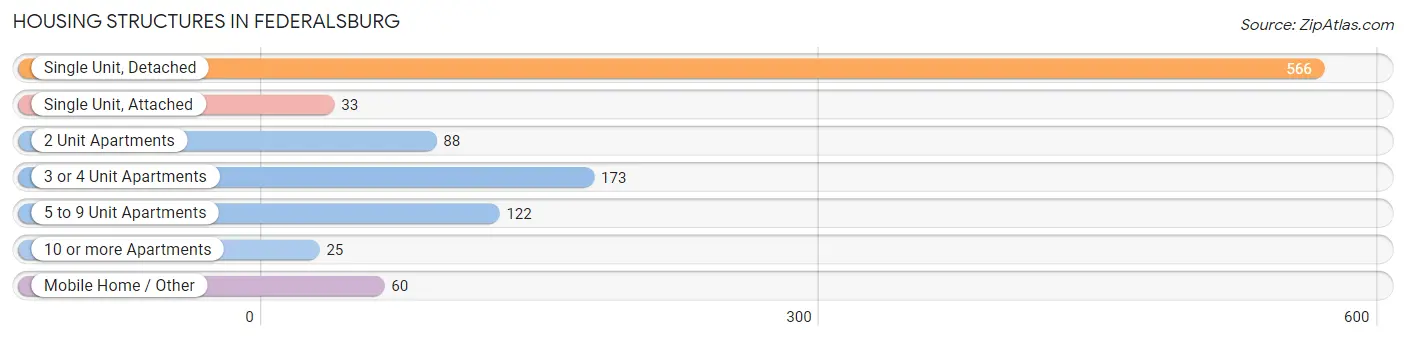
| Structure Type | # Housing Units | % Housing Units |
| Single Unit, Detached | 566 | 53.0% |
| Single Unit, Attached | 33 | 3.1% |
| 2 Unit Apartments | 88 | 8.3% |
| 3 or 4 Unit Apartments | 173 | 16.2% |
| 5 to 9 Unit Apartments | 122 | 11.4% |
| 10 or more Apartments | 25 | 2.3% |
| Mobile Home / Other | 60 | 5.6% |
| Total | 1,067 | 100.0% |
Housing Structures by Occupancy in Federalsburg
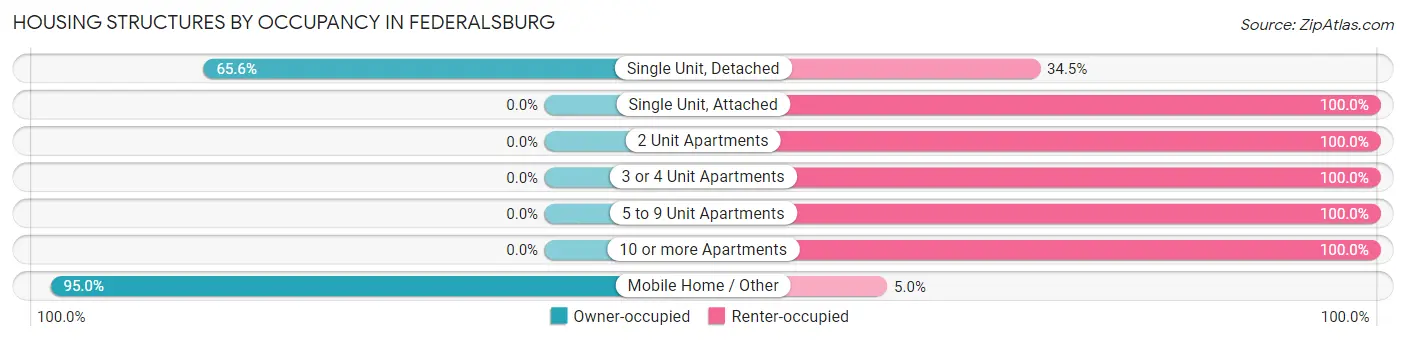
| Structure Type | Owner-occupied | Renter-occupied |
| Single Unit, Detached | 371 (65.5%) | 195 (34.4%) |
| Single Unit, Attached | 0 (0.0%) | 33 (100.0%) |
| 2 Unit Apartments | 0 (0.0%) | 88 (100.0%) |
| 3 or 4 Unit Apartments | 0 (0.0%) | 173 (100.0%) |
| 5 to 9 Unit Apartments | 0 (0.0%) | 122 (100.0%) |
| 10 or more Apartments | 0 (0.0%) | 25 (100.0%) |
| Mobile Home / Other | 57 (95.0%) | 3 (5.0%) |
| Total | 428 (40.1%) | 639 (59.9%) |
Housing Structures by Number of Rooms in Federalsburg
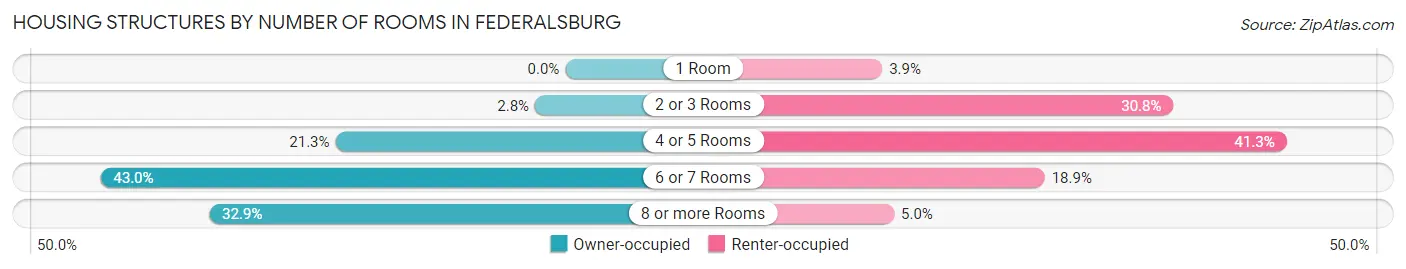
| Number of Rooms | Owner-occupied | Renter-occupied |
| 1 Room | 0 (0.0%) | 25 (3.9%) |
| 2 or 3 Rooms | 12 (2.8%) | 197 (30.8%) |
| 4 or 5 Rooms | 91 (21.3%) | 264 (41.3%) |
| 6 or 7 Rooms | 184 (43.0%) | 121 (18.9%) |
| 8 or more Rooms | 141 (32.9%) | 32 (5.0%) |
| Total | 428 (100.0%) | 639 (100.0%) |
Housing Structure by Heating Type in Federalsburg
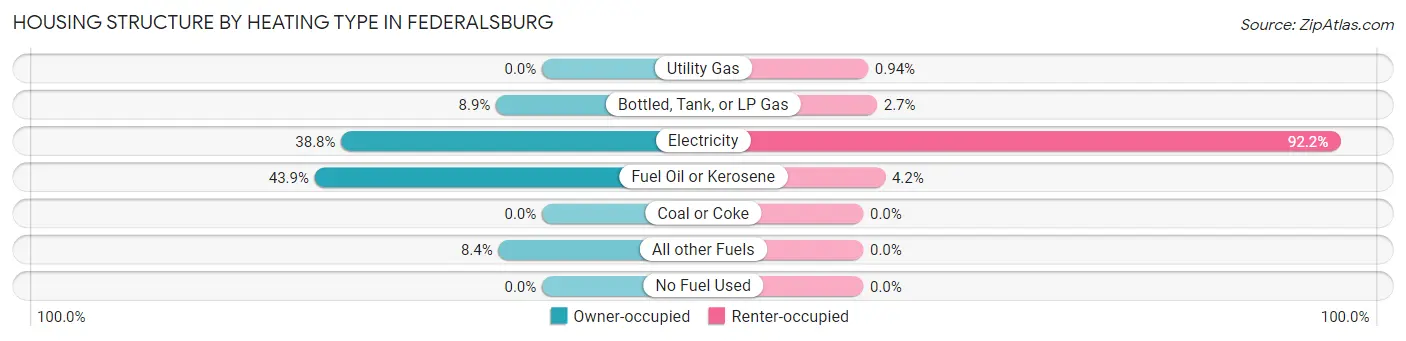
| Heating Type | Owner-occupied | Renter-occupied |
| Utility Gas | 0 (0.0%) | 6 (0.9%) |
| Bottled, Tank, or LP Gas | 38 (8.9%) | 17 (2.7%) |
| Electricity | 166 (38.8%) | 589 (92.2%) |
| Fuel Oil or Kerosene | 188 (43.9%) | 27 (4.2%) |
| Coal or Coke | 0 (0.0%) | 0 (0.0%) |
| All other Fuels | 36 (8.4%) | 0 (0.0%) |
| No Fuel Used | 0 (0.0%) | 0 (0.0%) |
| Total | 428 (100.0%) | 639 (100.0%) |
Household Vehicle Usage in Federalsburg
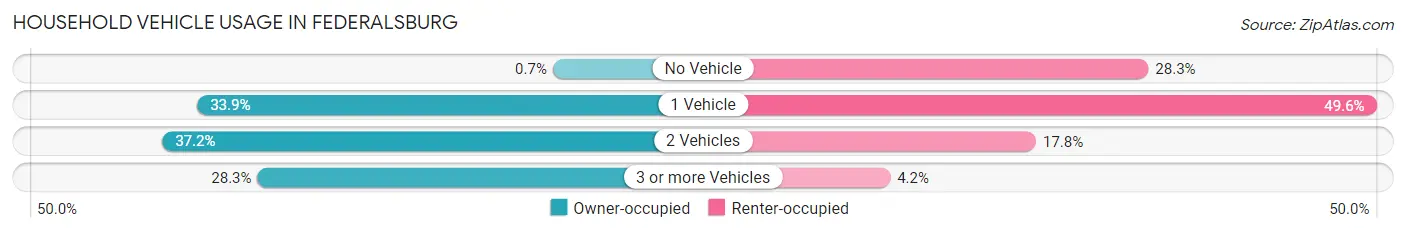
| Vehicles per Household | Owner-occupied | Renter-occupied |
| No Vehicle | 3 (0.7%) | 181 (28.3%) |
| 1 Vehicle | 145 (33.9%) | 317 (49.6%) |
| 2 Vehicles | 159 (37.1%) | 114 (17.8%) |
| 3 or more Vehicles | 121 (28.3%) | 27 (4.2%) |
| Total | 428 (100.0%) | 639 (100.0%) |
Real Estate & Mortgages in Federalsburg
Real Estate and Mortgage Overview in Federalsburg
| Characteristic | Without Mortgage | With Mortgage |
| Housing Units | 185 | 243 |
| Median Property Value | $108,000 | $131,000 |
| Median Household Income | - | - |
| Monthly Housing Costs | $655 | $6 |
| Real Estate Taxes | $1,718 | $9 |
Property Value by Mortgage Status in Federalsburg
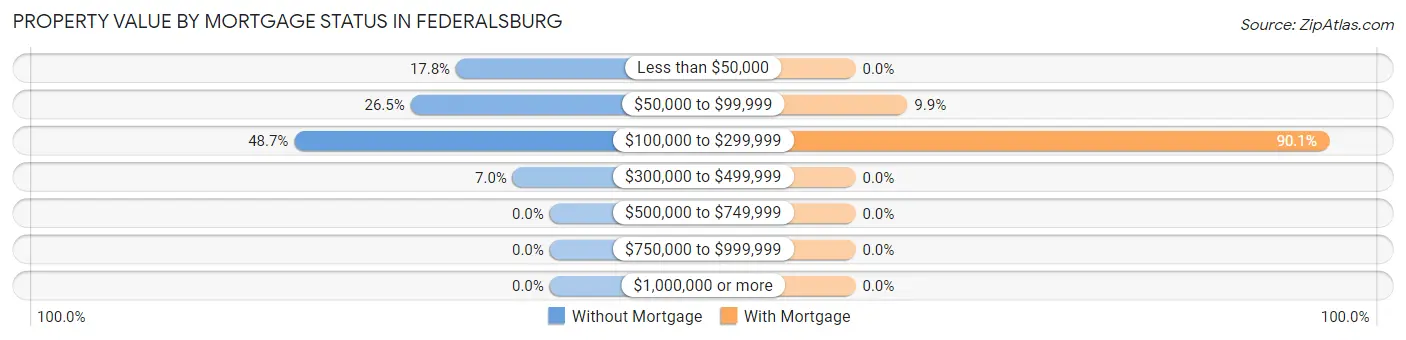
| Property Value | Without Mortgage | With Mortgage |
| Less than $50,000 | 33 (17.8%) | 0 (0.0%) |
| $50,000 to $99,999 | 49 (26.5%) | 24 (9.9%) |
| $100,000 to $299,999 | 90 (48.6%) | 219 (90.1%) |
| $300,000 to $499,999 | 13 (7.0%) | 0 (0.0%) |
| $500,000 to $749,999 | 0 (0.0%) | 0 (0.0%) |
| $750,000 to $999,999 | 0 (0.0%) | 0 (0.0%) |
| $1,000,000 or more | 0 (0.0%) | 0 (0.0%) |
| Total | 185 (100.0%) | 243 (100.0%) |
Household Income by Mortgage Status in Federalsburg
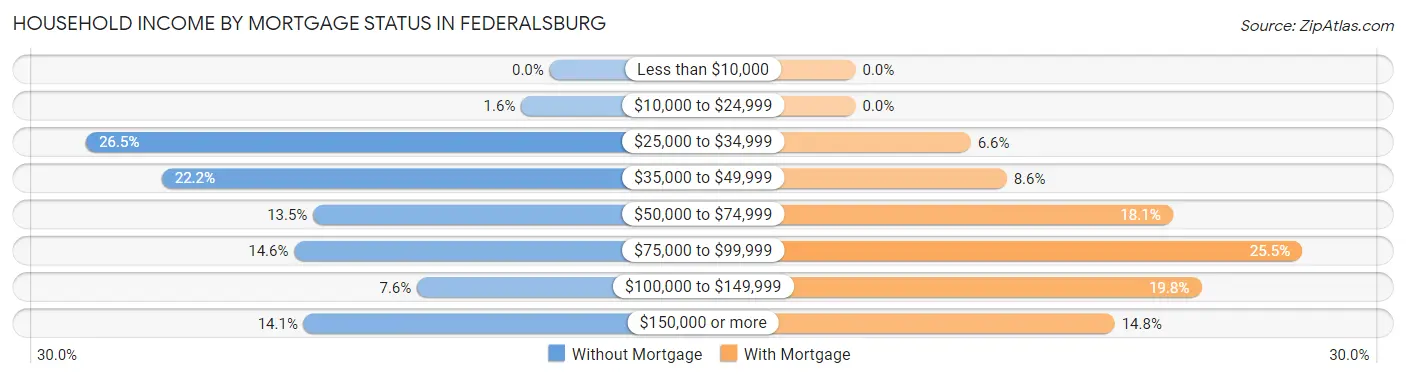
| Household Income | Without Mortgage | With Mortgage |
| Less than $10,000 | 0 (0.0%) | 0 (0.0%) |
| $10,000 to $24,999 | 3 (1.6%) | 0 (0.0%) |
| $25,000 to $34,999 | 49 (26.5%) | 16 (6.6%) |
| $35,000 to $49,999 | 41 (22.2%) | 21 (8.6%) |
| $50,000 to $74,999 | 25 (13.5%) | 44 (18.1%) |
| $75,000 to $99,999 | 27 (14.6%) | 62 (25.5%) |
| $100,000 to $149,999 | 14 (7.6%) | 48 (19.8%) |
| $150,000 or more | 26 (14.1%) | 36 (14.8%) |
| Total | 185 (100.0%) | 243 (100.0%) |
Property Value to Household Income Ratio in Federalsburg
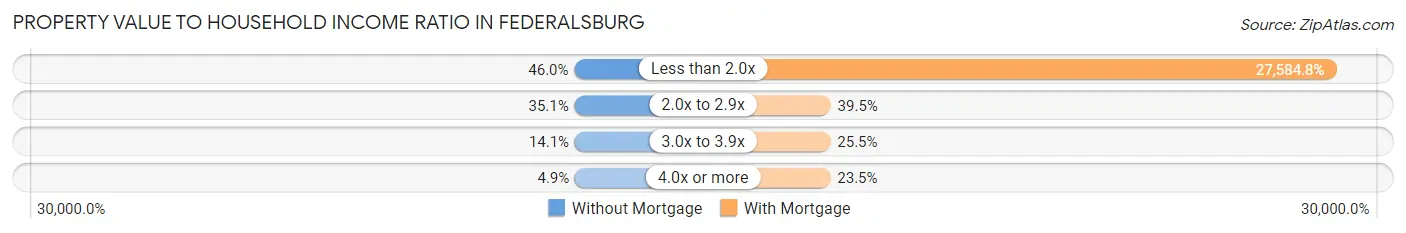
| Value-to-Income Ratio | Without Mortgage | With Mortgage |
| Less than 2.0x | 85 (46.0%) | 67,031 (27,584.8%) |
| 2.0x to 2.9x | 65 (35.1%) | 96 (39.5%) |
| 3.0x to 3.9x | 26 (14.1%) | 62 (25.5%) |
| 4.0x or more | 9 (4.9%) | 57 (23.5%) |
| Total | 185 (100.0%) | 243 (100.0%) |
Real Estate Taxes by Mortgage Status in Federalsburg
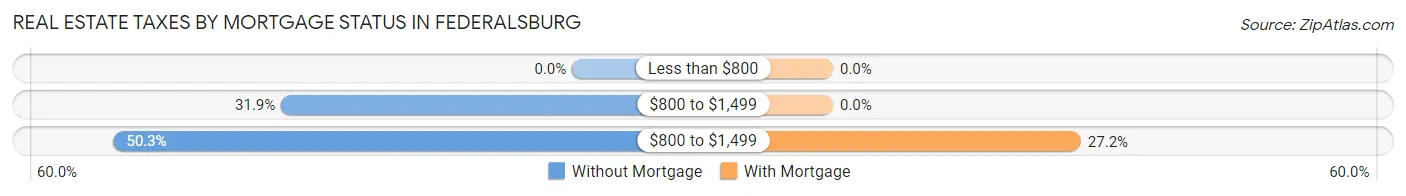
| Property Taxes | Without Mortgage | With Mortgage |
| Less than $800 | 0 (0.0%) | 0 (0.0%) |
| $800 to $1,499 | 59 (31.9%) | 0 (0.0%) |
| $800 to $1,499 | 93 (50.3%) | 66 (27.2%) |
| Total | 185 (100.0%) | 243 (100.0%) |
Health & Disability in Federalsburg
Health Insurance Coverage by Age in Federalsburg
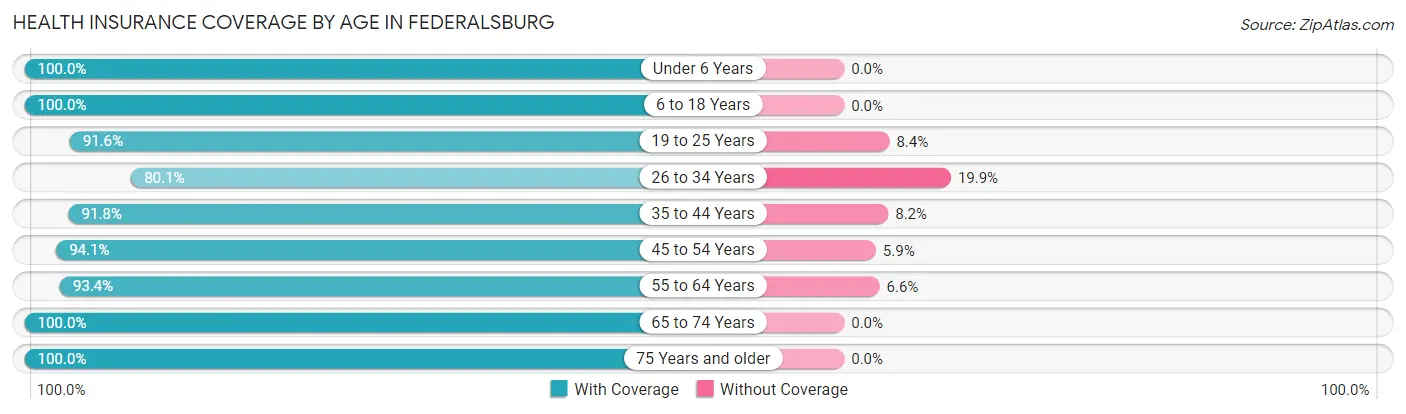
| Age Bracket | With Coverage | Without Coverage |
| Under 6 Years | 272 (100.0%) | 0 (0.0%) |
| 6 to 18 Years | 497 (100.0%) | 0 (0.0%) |
| 19 to 25 Years | 239 (91.6%) | 22 (8.4%) |
| 26 to 34 Years | 298 (80.1%) | 74 (19.9%) |
| 35 to 44 Years | 168 (91.8%) | 15 (8.2%) |
| 45 to 54 Years | 287 (94.1%) | 18 (5.9%) |
| 55 to 64 Years | 426 (93.4%) | 30 (6.6%) |
| 65 to 74 Years | 289 (100.0%) | 0 (0.0%) |
| 75 Years and older | 183 (100.0%) | 0 (0.0%) |
| Total | 2,659 (94.4%) | 159 (5.6%) |
Health Insurance Coverage by Citizenship Status in Federalsburg
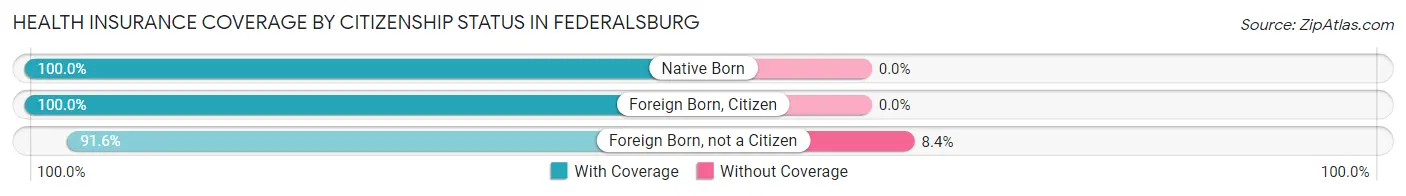
| Citizenship Status | With Coverage | Without Coverage |
| Native Born | 272 (100.0%) | 0 (0.0%) |
| Foreign Born, Citizen | 497 (100.0%) | 0 (0.0%) |
| Foreign Born, not a Citizen | 239 (91.6%) | 22 (8.4%) |
Health Insurance Coverage by Household Income in Federalsburg
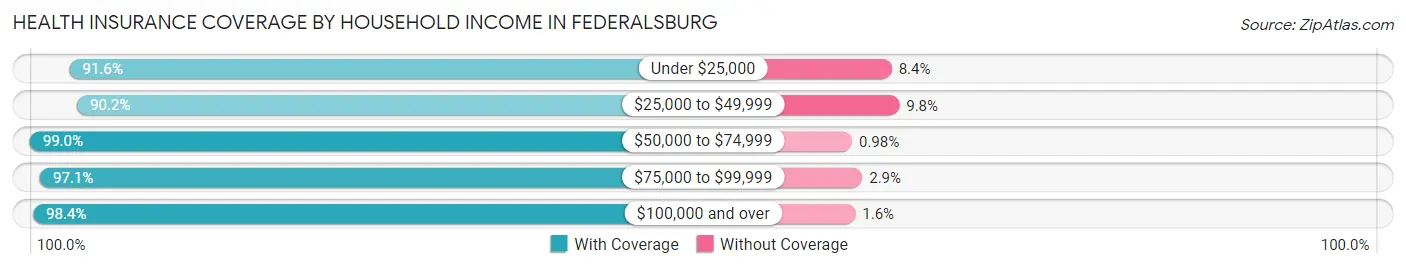
| Household Income | With Coverage | Without Coverage |
| Under $25,000 | 674 (91.6%) | 62 (8.4%) |
| $25,000 to $49,999 | 697 (90.2%) | 76 (9.8%) |
| $50,000 to $74,999 | 607 (99.0%) | 6 (1.0%) |
| $75,000 to $99,999 | 301 (97.1%) | 9 (2.9%) |
| $100,000 and over | 366 (98.4%) | 6 (1.6%) |
Public vs Private Health Insurance Coverage by Age in Federalsburg
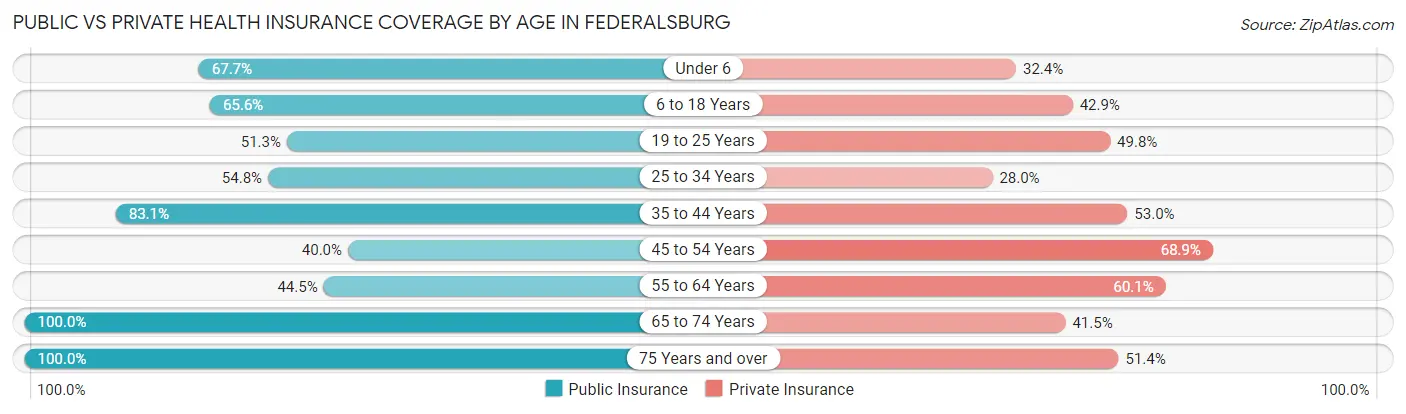
| Age Bracket | Public Insurance | Private Insurance |
| Under 6 | 184 (67.6%) | 88 (32.4%) |
| 6 to 18 Years | 326 (65.6%) | 213 (42.9%) |
| 19 to 25 Years | 134 (51.3%) | 130 (49.8%) |
| 25 to 34 Years | 204 (54.8%) | 104 (28.0%) |
| 35 to 44 Years | 152 (83.1%) | 97 (53.0%) |
| 45 to 54 Years | 122 (40.0%) | 210 (68.9%) |
| 55 to 64 Years | 203 (44.5%) | 274 (60.1%) |
| 65 to 74 Years | 289 (100.0%) | 120 (41.5%) |
| 75 Years and over | 183 (100.0%) | 94 (51.4%) |
| Total | 1,797 (63.8%) | 1,330 (47.2%) |
Disability Status by Sex by Age in Federalsburg
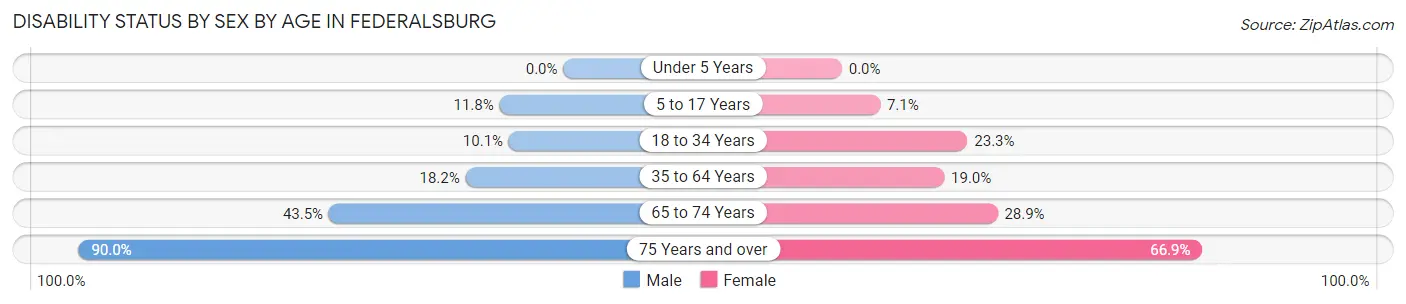
| Age Bracket | Male | Female |
| Under 5 Years | 0 (0.0%) | 0 (0.0%) |
| 5 to 17 Years | 38 (11.8%) | 15 (7.1%) |
| 18 to 34 Years | 18 (10.1%) | 107 (23.3%) |
| 35 to 64 Years | 71 (18.2%) | 105 (19.0%) |
| 65 to 74 Years | 67 (43.5%) | 39 (28.9%) |
| 75 Years and over | 45 (90.0%) | 89 (66.9%) |
Disability Class by Sex by Age in Federalsburg
Disability Class: Hearing Difficulty
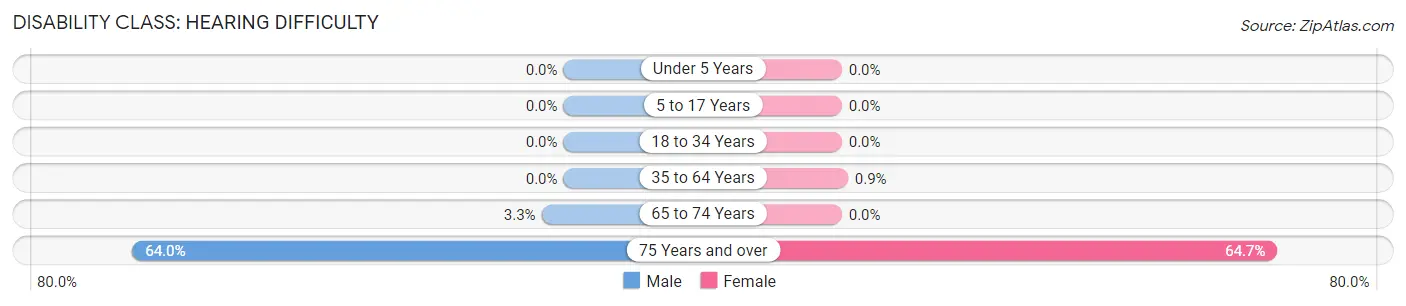
| Age Bracket | Male | Female |
| Under 5 Years | 0 (0.0%) | 0 (0.0%) |
| 5 to 17 Years | 0 (0.0%) | 0 (0.0%) |
| 18 to 34 Years | 0 (0.0%) | 0 (0.0%) |
| 35 to 64 Years | 0 (0.0%) | 5 (0.9%) |
| 65 to 74 Years | 5 (3.3%) | 0 (0.0%) |
| 75 Years and over | 32 (64.0%) | 86 (64.7%) |
Disability Class: Vision Difficulty
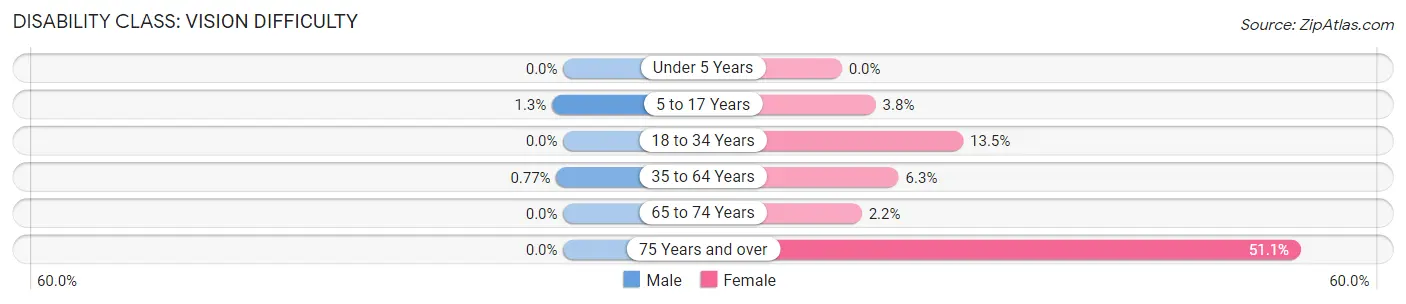
| Age Bracket | Male | Female |
| Under 5 Years | 0 (0.0%) | 0 (0.0%) |
| 5 to 17 Years | 4 (1.3%) | 8 (3.8%) |
| 18 to 34 Years | 0 (0.0%) | 62 (13.5%) |
| 35 to 64 Years | 3 (0.8%) | 35 (6.3%) |
| 65 to 74 Years | 0 (0.0%) | 3 (2.2%) |
| 75 Years and over | 0 (0.0%) | 68 (51.1%) |
Disability Class: Cognitive Difficulty
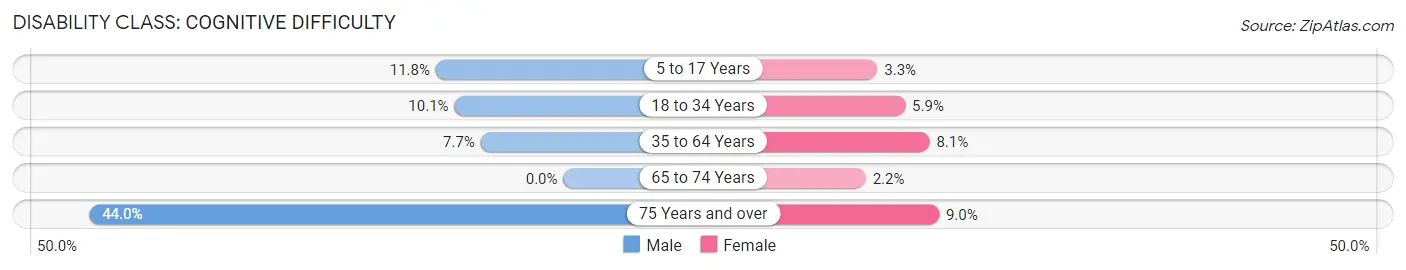
| Age Bracket | Male | Female |
| 5 to 17 Years | 38 (11.8%) | 7 (3.3%) |
| 18 to 34 Years | 18 (10.1%) | 27 (5.9%) |
| 35 to 64 Years | 30 (7.7%) | 45 (8.1%) |
| 65 to 74 Years | 0 (0.0%) | 3 (2.2%) |
| 75 Years and over | 22 (44.0%) | 12 (9.0%) |
Disability Class: Ambulatory Difficulty
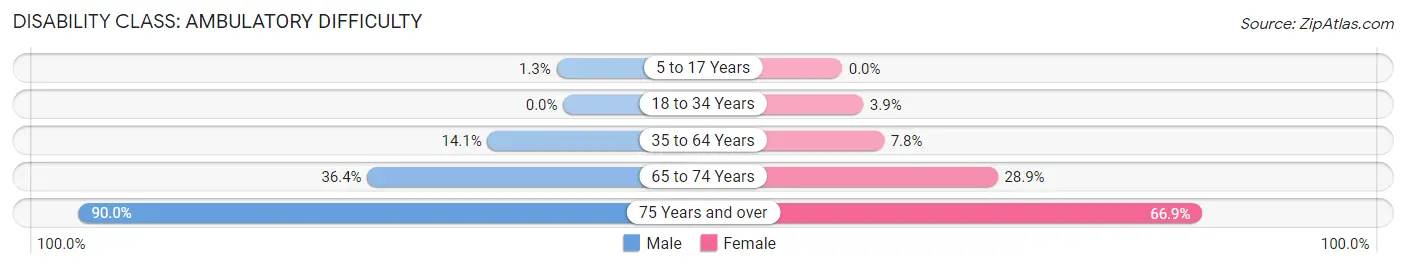
| Age Bracket | Male | Female |
| 5 to 17 Years | 4 (1.3%) | 0 (0.0%) |
| 18 to 34 Years | 0 (0.0%) | 18 (3.9%) |
| 35 to 64 Years | 55 (14.1%) | 43 (7.8%) |
| 65 to 74 Years | 56 (36.4%) | 39 (28.9%) |
| 75 Years and over | 45 (90.0%) | 89 (66.9%) |
Disability Class: Self-Care Difficulty
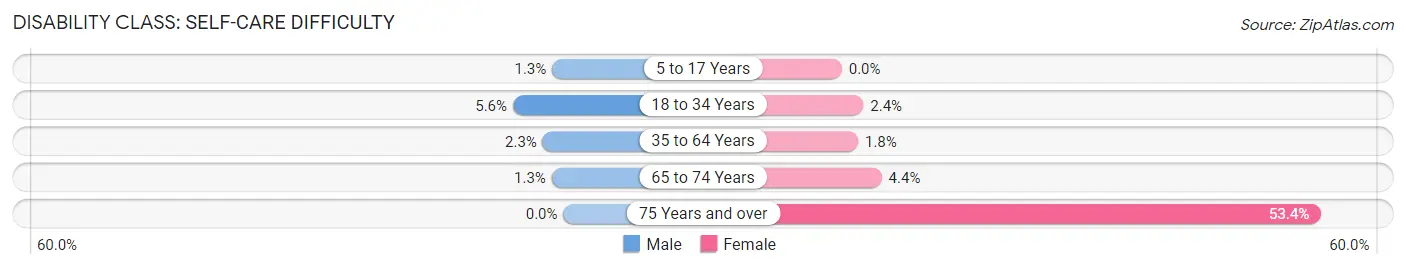
| Age Bracket | Male | Female |
| 5 to 17 Years | 4 (1.3%) | 0 (0.0%) |
| 18 to 34 Years | 10 (5.6%) | 11 (2.4%) |
| 35 to 64 Years | 9 (2.3%) | 10 (1.8%) |
| 65 to 74 Years | 2 (1.3%) | 6 (4.4%) |
| 75 Years and over | 0 (0.0%) | 71 (53.4%) |
Technology Access in Federalsburg
Computing Device Access in Federalsburg
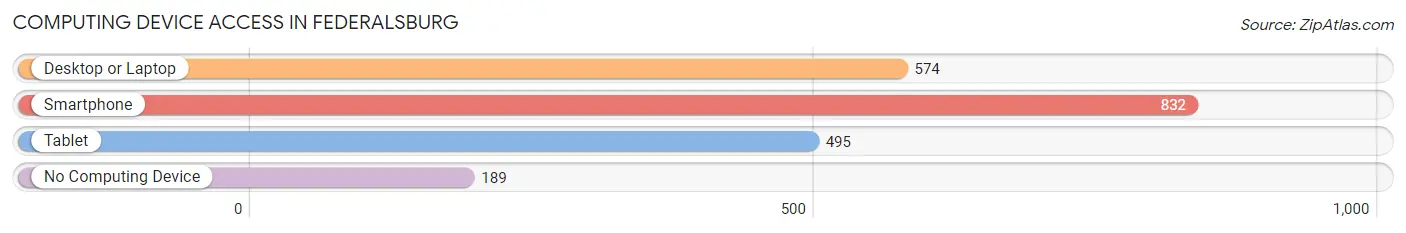
| Device Type | # Households | % Households |
| Desktop or Laptop | 574 | 53.8% |
| Smartphone | 832 | 78.0% |
| Tablet | 495 | 46.4% |
| No Computing Device | 189 | 17.7% |
| Total | 1,067 | 100.0% |
Internet Access in Federalsburg
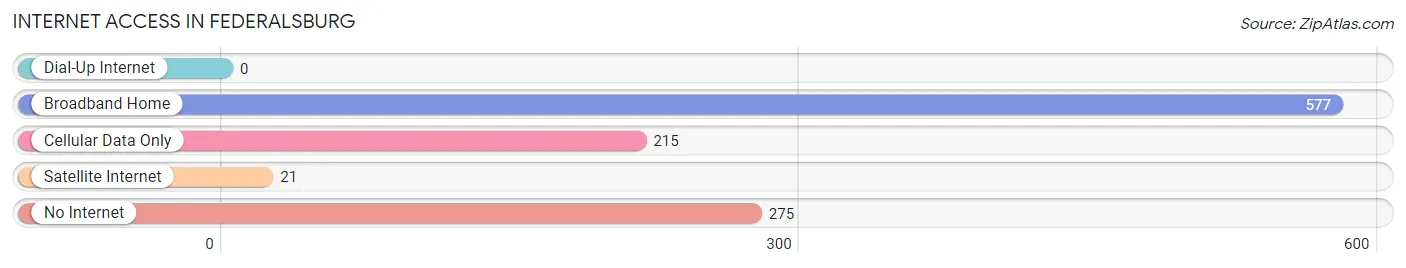
| Internet Type | # Households | % Households |
| Dial-Up Internet | 0 | 0.0% |
| Broadband Home | 577 | 54.1% |
| Cellular Data Only | 215 | 20.2% |
| Satellite Internet | 21 | 2.0% |
| No Internet | 275 | 25.8% |
| Total | 1,067 | 100.0% |
Federalsburg Summary
Federalsburg is a small town located in Caroline County, Maryland, United States. It is situated on the banks of the Choptank River, about halfway between Baltimore and Washington, D.C. The town was founded in 1790 and incorporated in 1867. As of the 2010 census, the population of Federalsburg was 1,622.
History
Federalsburg was founded in 1790 by a group of settlers from Pennsylvania. The town was named after the Federalist Party, which was popular in the area at the time. The town was officially incorporated in 1867.
In the late 19th century, Federalsburg was a major center for the production of lumber and other wood products. The town was also home to several large canning factories, which produced canned fruits and vegetables for the local market.
In the early 20th century, Federalsburg was a major center for the production of poultry and eggs. The town was also home to several large poultry processing plants.
Geography
Federalsburg is located at 38°47'25" North, 75°51'45" West (38.790278, -75.862444). The town is situated on the banks of the Choptank River, about halfway between Baltimore and Washington, D.C.
According to the United States Census Bureau, the town has a total area of 1.2 square miles (3.1 km2), all of it land.
Economy
Federalsburg is a small town with a limited economy. The town is home to several small businesses, including a few restaurants, a grocery store, and a few retail stores. The town is also home to a few manufacturing companies, including a poultry processing plant and a wood products plant.
Demographics
As of the 2010 census, there were 1,622 people, 645 households, and 431 families residing in the town. The population density was 1,346.7 people per square mile (520.2/km2). There were 709 housing units at an average density of 590.8 per square mile (228.3/km2). The racial makeup of the town was 73.2% White, 22.2% African American, 0.2% Native American, 0.7% Asian, 0.1% Pacific Islander, 1.3% from other races, and 2.3% from two or more races. Hispanic or Latino of any race were 3.2% of the population.
There were 645 households, out of which 28.2% had children under the age of 18 living with them, 43.2% were married couples living together, 16.2% had a female householder with no husband present, and 35.3% were non-families. 29.7% of all households were made up of individuals, and 13.2% had someone living alone who was 65 years of age or older. The average household size was 2.50 and the average family size was 3.09.
In the town, the population was spread out, with 24.7% under the age of 18, 8.2% from 18 to 24, 25.7% from 25 to 44, 25.2% from 45 to 64, and 16.2% who were 65 years of age or older. The median age was 38 years. For every 100 females, there were 87.2 males. For every 100 females age 18 and over, there were 81.2 males.
The median income for a household in the town was $35,938, and the median income for a family was $41,250. Males had a median income of $31,250 versus $25,000 for females. The per capita income for the town was $17,845. About 11.2% of families and 14.2% of the population were below the poverty line, including 19.2% of those under age 18 and 10.2% of those age 65 or over.
Common Questions
What is Per Capita Income in Federalsburg?
Per Capita income in Federalsburg is $19,145.
What is the Median Family Income in Federalsburg?
Median Family Income in Federalsburg is $37,656.
What is the Median Household income in Federalsburg?
Median Household Income in Federalsburg is $33,511.
What is Income or Wage Gap in Federalsburg?
Income or Wage Gap in Federalsburg is 25.3%.
Women in Federalsburg earn 74.7 cents for every dollar earned by a man.
What is Family Income Deficit in Federalsburg?
Family Income Deficit in Federalsburg is $9,595.
Families that are below poverty line in Federalsburg earn $9,595 less on average than the poverty threshold level.
What is Inequality or Gini Index in Federalsburg?
Inequality or Gini Index in Federalsburg is 0.46.
What is the Total Population of Federalsburg?
Total Population of Federalsburg is 2,818.
What is the Total Male Population of Federalsburg?
Total Male Population of Federalsburg is 1,180.
What is the Total Female Population of Federalsburg?
Total Female Population of Federalsburg is 1,638.
What is the Ratio of Males per 100 Females in Federalsburg?
There are 72.04 Males per 100 Females in Federalsburg.
What is the Ratio of Females per 100 Males in Federalsburg?
There are 138.81 Females per 100 Males in Federalsburg.
What is the Median Population Age in Federalsburg?
Median Population Age in Federalsburg is 36.4 Years.
What is the Average Family Size in Federalsburg
Average Family Size in Federalsburg is 3.1 People.
What is the Average Household Size in Federalsburg
Average Household Size in Federalsburg is 2.6 People.
How Large is the Labor Force in Federalsburg?
There are 1,136 People in the Labor Forcein in Federalsburg.
What is the Percentage of People in the Labor Force in Federalsburg?
54.2% of People are in the Labor Force in Federalsburg.
What is the Unemployment Rate in Federalsburg?
Unemployment Rate in Federalsburg is 7.4%.