Oxon Hill, MD Map & Demographics
Oxon Hill Map
Oxon Hill Overview
$44,670
PER CAPITA INCOME
$112,031
AVG FAMILY INCOME
$96,510
AVG HOUSEHOLD INCOME
9.2%
WAGE / INCOME GAP [ % ]
90.8¢/ $1
WAGE / INCOME GAP [ $ ]
0.38
INEQUALITY / GINI INDEX
18,526
TOTAL POPULATION
8,901
MALE POPULATION
9,625
FEMALE POPULATION
92.48
MALES / 100 FEMALES
108.13
FEMALES / 100 MALES
44.5
MEDIAN AGE
3.3
AVG FAMILY SIZE
2.5
AVG HOUSEHOLD SIZE
10,730
LABOR FORCE [ PEOPLE ]
69.3%
PERCENT IN LABOR FORCE
7.1%
UNEMPLOYMENT RATE
Oxon Hill Zip Codes
Income in Oxon Hill
Income Overview in Oxon Hill
Per Capita Income in Oxon Hill is $44,670, while median incomes of families and households are $112,031 and $96,510 respectively.
| Characteristic | Number | Measure |
| Per Capita Income | 18,526 | $44,670 |
| Median Family Income | 4,349 | $112,031 |
| Mean Family Income | 4,349 | $125,264 |
| Median Household Income | 7,411 | $96,510 |
| Mean Household Income | 7,411 | $108,479 |
| Income Deficit | 4,349 | $0 |
| Wage / Income Gap (%) | 18,526 | 9.25% |
| Wage / Income Gap ($) | 18,526 | 90.75¢ per $1 |
| Gini / Inequality Index | 18,526 | 0.38 |
Earnings by Sex in Oxon Hill
Average Earnings in Oxon Hill are $52,188, $50,583 for men and $55,736 for women, a difference of 9.2%.
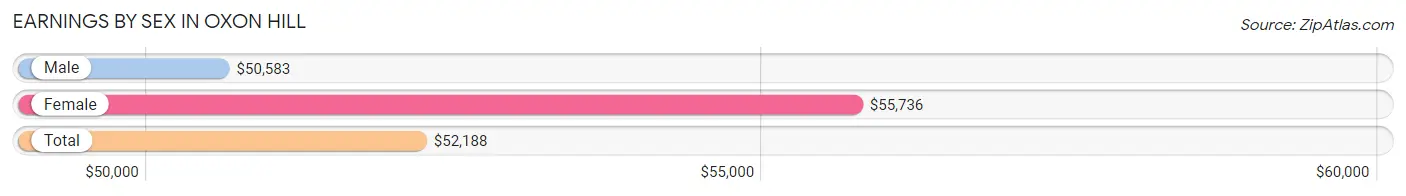
| Sex | Number | Average Earnings |
| Male | 5,427 (51.0%) | $50,583 |
| Female | 5,207 (49.0%) | $55,736 |
| Total | 10,634 (100.0%) | $52,188 |
Earnings by Sex by Income Bracket in Oxon Hill
The most common earnings brackets in Oxon Hill are $75,000 to $99,999 for men (882 | 16.3%) and $100,000+ for women (1,008 | 19.4%).
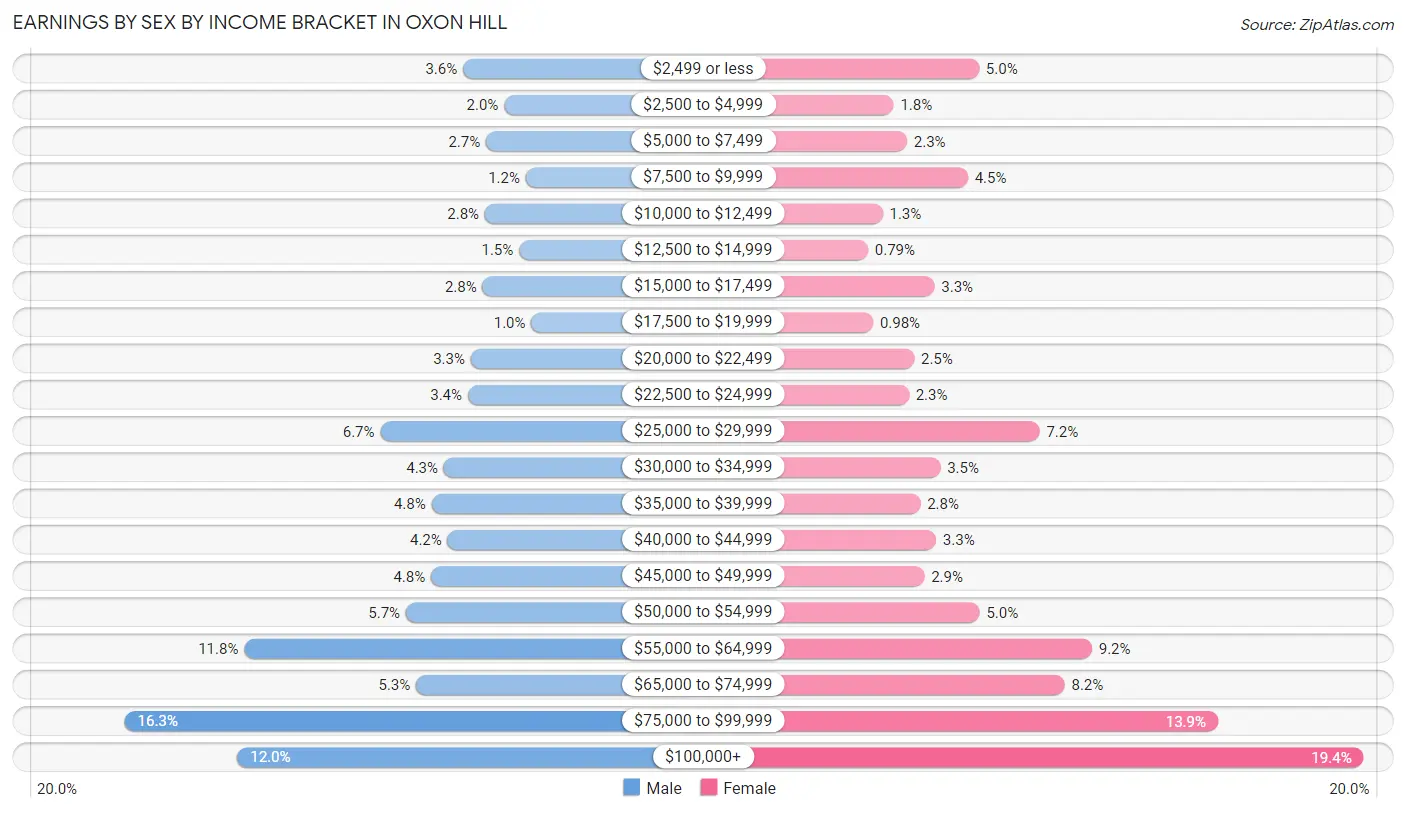
| Income | Male | Female |
| $2,499 or less | 194 (3.6%) | 258 (5.0%) |
| $2,500 to $4,999 | 110 (2.0%) | 91 (1.8%) |
| $5,000 to $7,499 | 147 (2.7%) | 117 (2.2%) |
| $7,500 to $9,999 | 66 (1.2%) | 236 (4.5%) |
| $10,000 to $12,499 | 149 (2.8%) | 70 (1.3%) |
| $12,500 to $14,999 | 80 (1.5%) | 41 (0.8%) |
| $15,000 to $17,499 | 154 (2.8%) | 171 (3.3%) |
| $17,500 to $19,999 | 55 (1.0%) | 51 (1.0%) |
| $20,000 to $22,499 | 178 (3.3%) | 131 (2.5%) |
| $22,500 to $24,999 | 184 (3.4%) | 121 (2.3%) |
| $25,000 to $29,999 | 362 (6.7%) | 376 (7.2%) |
| $30,000 to $34,999 | 233 (4.3%) | 182 (3.5%) |
| $35,000 to $39,999 | 258 (4.8%) | 143 (2.8%) |
| $40,000 to $44,999 | 225 (4.2%) | 174 (3.3%) |
| $45,000 to $49,999 | 259 (4.8%) | 151 (2.9%) |
| $50,000 to $54,999 | 310 (5.7%) | 259 (5.0%) |
| $55,000 to $64,999 | 639 (11.8%) | 478 (9.2%) |
| $65,000 to $74,999 | 289 (5.3%) | 425 (8.2%) |
| $75,000 to $99,999 | 882 (16.3%) | 724 (13.9%) |
| $100,000+ | 653 (12.0%) | 1,008 (19.4%) |
| Total | 5,427 (100.0%) | 5,207 (100.0%) |
Earnings by Sex by Educational Attainment in Oxon Hill
Average earnings in Oxon Hill are $52,412 for men and $62,932 for women, a difference of 16.7%. Men with an educational attainment of graduate degree enjoy the highest average annual earnings of $106,765, while those with high school diploma education earn the least with $38,293. Women with an educational attainment of graduate degree earn the most with the average annual earnings of $102,965, while those with less than high school education have the smallest earnings of $26,356.
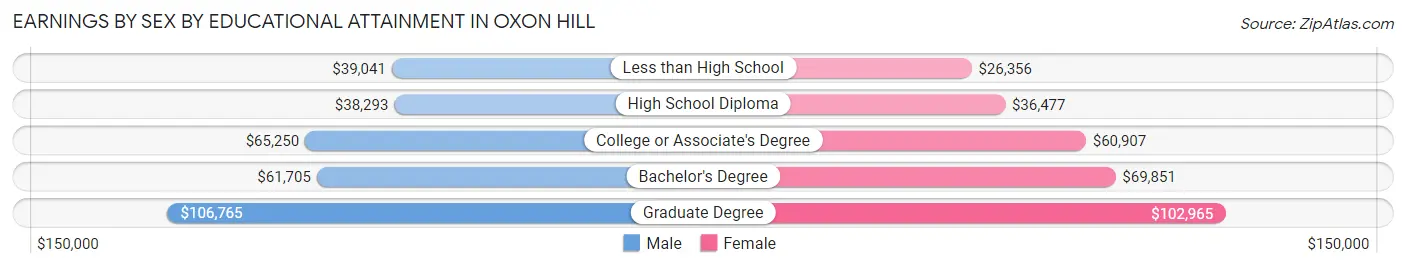
| Educational Attainment | Male Income | Female Income |
| Less than High School | $39,041 | $26,356 |
| High School Diploma | $38,293 | $36,477 |
| College or Associate's Degree | $65,250 | $60,907 |
| Bachelor's Degree | $61,705 | $69,851 |
| Graduate Degree | $106,765 | $102,965 |
| Total | $52,412 | $62,932 |
Family Income in Oxon Hill
Family Income Brackets in Oxon Hill
According to the Oxon Hill family income data, there are 1,213 families falling into the $100,000 to $149,999 income range, which is the most common income bracket and makes up 27.9% of all families. Conversely, the $10,000 to $14,999 income bracket is the least frequent group with only 39 families (0.9%) belonging to this category.
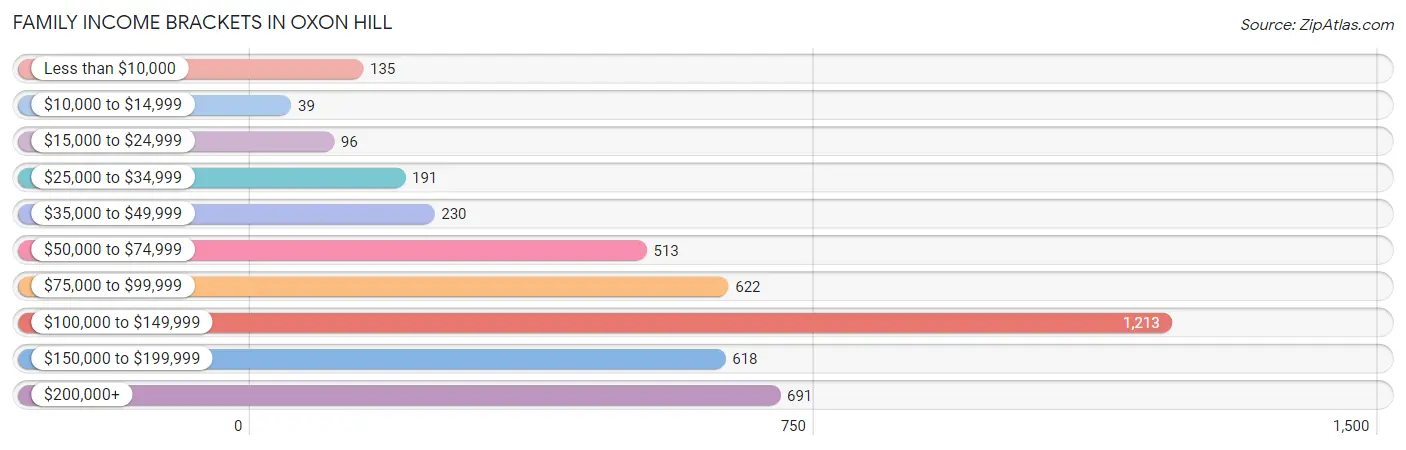
| Income Bracket | # Families | % Families |
| Less than $10,000 | 135 | 3.1% |
| $10,000 to $14,999 | 39 | 0.9% |
| $15,000 to $24,999 | 96 | 2.2% |
| $25,000 to $34,999 | 191 | 4.4% |
| $35,000 to $49,999 | 230 | 5.3% |
| $50,000 to $74,999 | 513 | 11.8% |
| $75,000 to $99,999 | 622 | 14.3% |
| $100,000 to $149,999 | 1,213 | 27.9% |
| $150,000 to $199,999 | 618 | 14.2% |
| $200,000+ | 691 | 15.9% |
Family Income by Famaliy Size in Oxon Hill
4-person families (691 | 15.9%) account for the highest median family income in Oxon Hill with $195,729 per family, while 4-person families (691 | 15.9%) have the highest median income of $48,932 per family member.
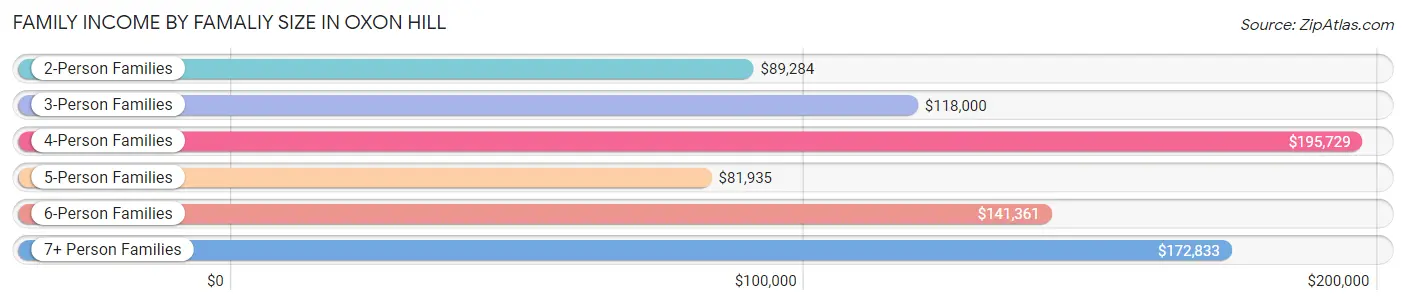
| Income Bracket | # Families | Median Income |
| 2-Person Families | 2,033 (46.8%) | $89,284 |
| 3-Person Families | 962 (22.1%) | $118,000 |
| 4-Person Families | 691 (15.9%) | $195,729 |
| 5-Person Families | 284 (6.5%) | $81,935 |
| 6-Person Families | 215 (4.9%) | $141,361 |
| 7+ Person Families | 164 (3.8%) | $172,833 |
| Total | 4,349 (100.0%) | $112,031 |
Family Income by Number of Earners in Oxon Hill
The median family income in Oxon Hill is $112,031, with families comprising 3+ earners (850) having the highest median family income of $177,907, while families with no earners (550) have the lowest median family income of $66,111, accounting for 19.5% and 12.7% of families, respectively.
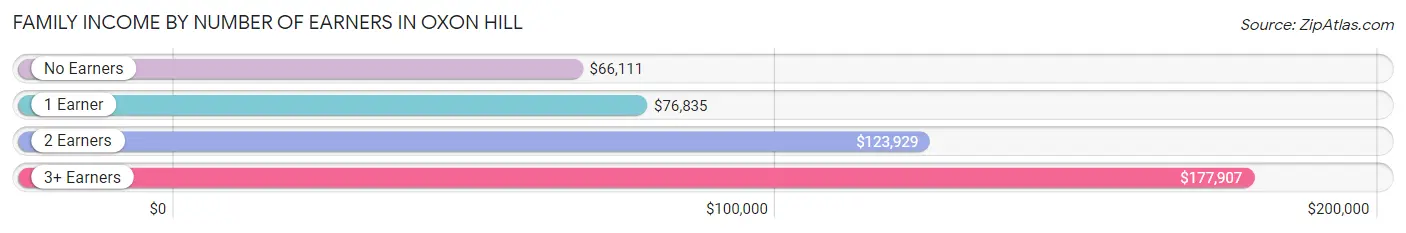
| Number of Earners | # Families | Median Income |
| No Earners | 550 (12.7%) | $66,111 |
| 1 Earner | 1,273 (29.3%) | $76,835 |
| 2 Earners | 1,676 (38.5%) | $123,929 |
| 3+ Earners | 850 (19.5%) | $177,907 |
| Total | 4,349 (100.0%) | $112,031 |
Household Income in Oxon Hill
Household Income Brackets in Oxon Hill
With 1,823 households falling in the category, the $100,000 to $149,999 income range is the most frequent in Oxon Hill, accounting for 24.6% of all households. In contrast, only 156 households (2.1%) fall into the $10,000 to $14,999 income bracket, making it the least populous group.
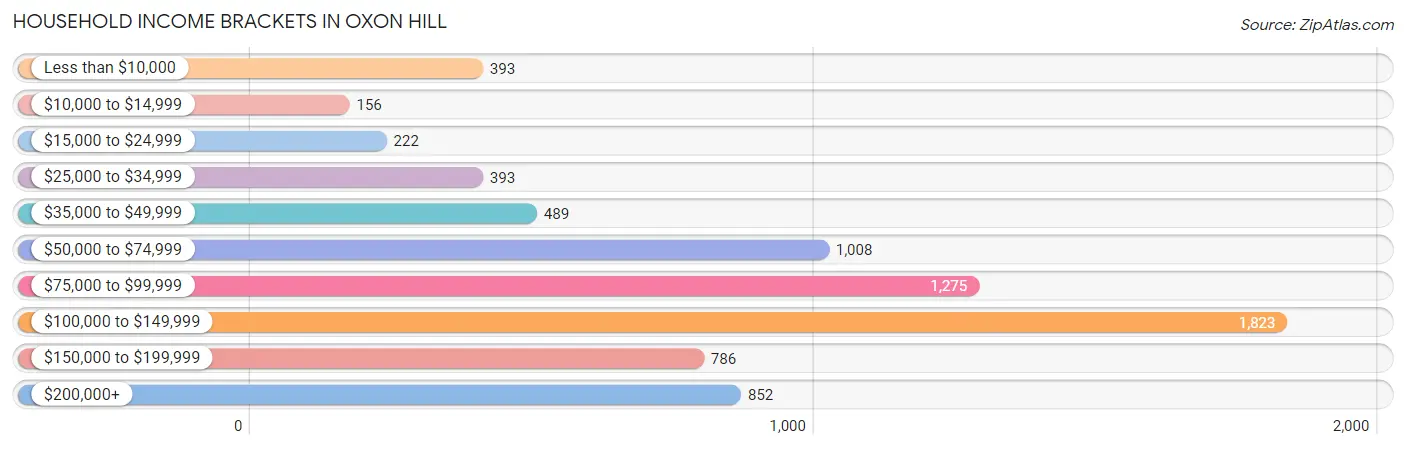
| Income Bracket | # Households | % Households |
| Less than $10,000 | 393 | 5.3% |
| $10,000 to $14,999 | 156 | 2.1% |
| $15,000 to $24,999 | 222 | 3.0% |
| $25,000 to $34,999 | 393 | 5.3% |
| $35,000 to $49,999 | 489 | 6.6% |
| $50,000 to $74,999 | 1,008 | 13.6% |
| $75,000 to $99,999 | 1,275 | 17.2% |
| $100,000 to $149,999 | 1,823 | 24.6% |
| $150,000 to $199,999 | 786 | 10.6% |
| $200,000+ | 852 | 11.5% |
Household Income by Householder Age in Oxon Hill
The median household income in Oxon Hill is $96,510, with the highest median household income of $112,527 found in the 45 to 64 years age bracket for the primary householder. A total of 3,096 households (41.8%) fall into this category. Meanwhile, the 15 to 24 years age bracket for the primary householder has the lowest median household income of $0, with 141 households (1.9%) in this group.
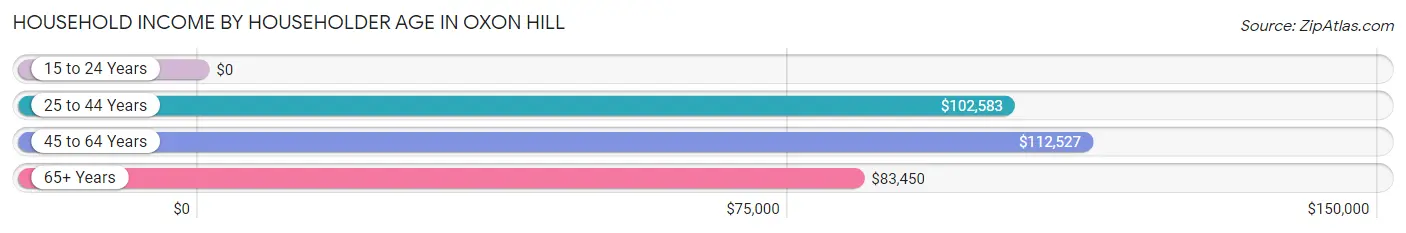
| Income Bracket | # Households | Median Income |
| 15 to 24 Years | 141 (1.9%) | $0 |
| 25 to 44 Years | 1,599 (21.6%) | $102,583 |
| 45 to 64 Years | 3,096 (41.8%) | $112,527 |
| 65+ Years | 2,575 (34.7%) | $83,450 |
| Total | 7,411 (100.0%) | $96,510 |
Poverty in Oxon Hill
Income Below Poverty by Sex and Age in Oxon Hill
With 6.5% poverty level for males and 11.2% for females among the residents of Oxon Hill, 15 year old males and 15 year old females are the most vulnerable to poverty, with 29 males (28.7%) and 53 females (44.2%) in their respective age groups living below the poverty level.
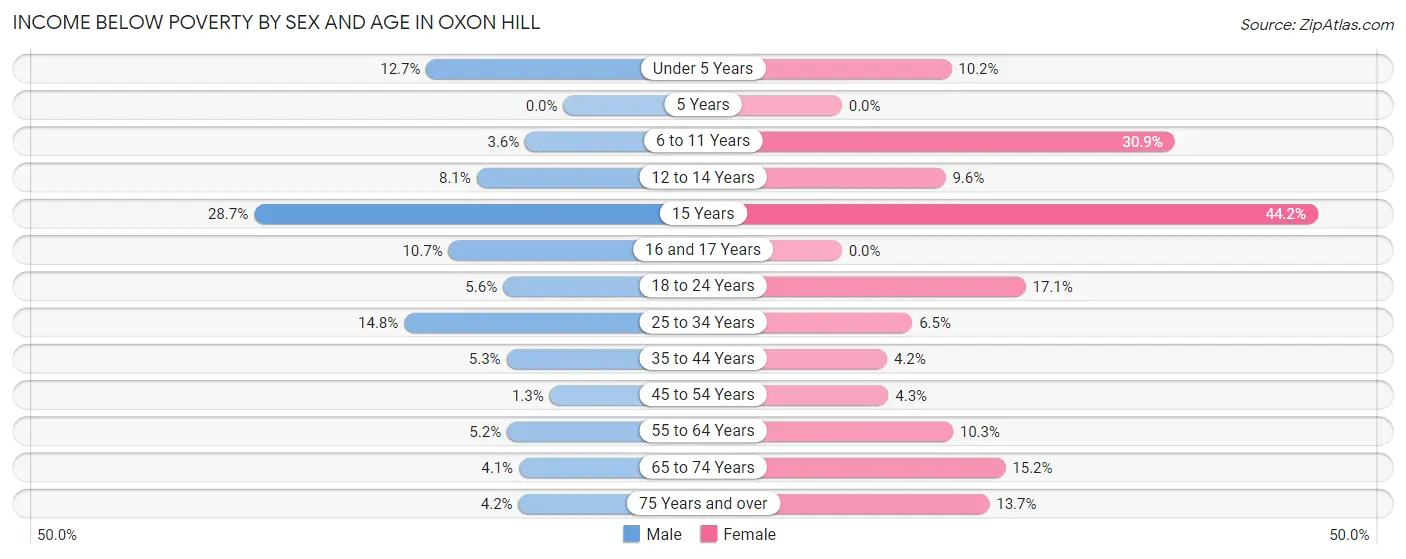
| Age Bracket | Male | Female |
| Under 5 Years | 72 (12.7%) | 71 (10.2%) |
| 5 Years | 0 (0.0%) | 0 (0.0%) |
| 6 to 11 Years | 15 (3.5%) | 156 (30.9%) |
| 12 to 14 Years | 19 (8.1%) | 15 (9.6%) |
| 15 Years | 29 (28.7%) | 53 (44.2%) |
| 16 and 17 Years | 26 (10.7%) | 0 (0.0%) |
| 18 to 24 Years | 32 (5.6%) | 136 (17.1%) |
| 25 to 34 Years | 161 (14.8%) | 74 (6.5%) |
| 35 to 44 Years | 66 (5.3%) | 45 (4.2%) |
| 45 to 54 Years | 18 (1.3%) | 61 (4.3%) |
| 55 to 64 Years | 58 (5.2%) | 147 (10.3%) |
| 65 to 74 Years | 43 (4.1%) | 208 (15.2%) |
| 75 Years and over | 28 (4.2%) | 101 (13.7%) |
| Total | 567 (6.5%) | 1,067 (11.2%) |
Income Above Poverty by Sex and Age in Oxon Hill
According to the poverty statistics in Oxon Hill, males aged 5 years and females aged 5 years are the age groups that are most secure financially, with 100.0% of males and 100.0% of females in these age groups living above the poverty line.
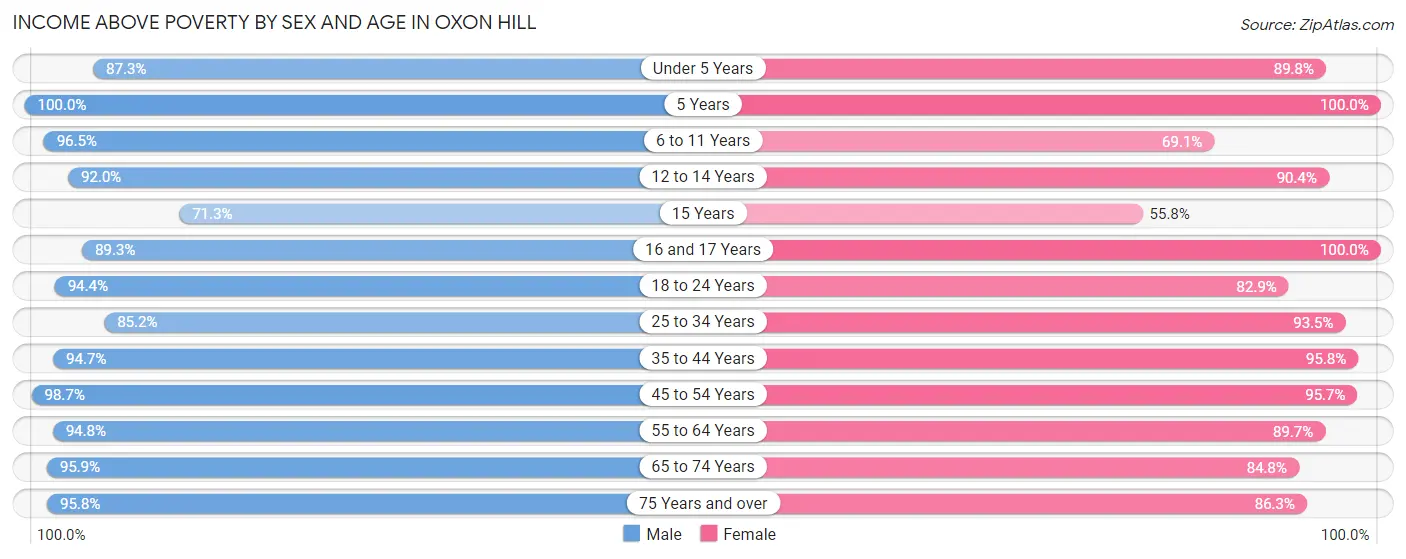
| Age Bracket | Male | Female |
| Under 5 Years | 494 (87.3%) | 627 (89.8%) |
| 5 Years | 30 (100.0%) | 11 (100.0%) |
| 6 to 11 Years | 408 (96.5%) | 349 (69.1%) |
| 12 to 14 Years | 217 (91.9%) | 141 (90.4%) |
| 15 Years | 72 (71.3%) | 67 (55.8%) |
| 16 and 17 Years | 218 (89.3%) | 134 (100.0%) |
| 18 to 24 Years | 539 (94.4%) | 661 (82.9%) |
| 25 to 34 Years | 928 (85.2%) | 1,057 (93.5%) |
| 35 to 44 Years | 1,183 (94.7%) | 1,030 (95.8%) |
| 45 to 54 Years | 1,391 (98.7%) | 1,350 (95.7%) |
| 55 to 64 Years | 1,050 (94.8%) | 1,280 (89.7%) |
| 65 to 74 Years | 1,001 (95.9%) | 1,162 (84.8%) |
| 75 Years and over | 644 (95.8%) | 637 (86.3%) |
| Total | 8,175 (93.5%) | 8,506 (88.8%) |
Income Below Poverty Among Married-Couple Families in Oxon Hill
The poverty statistics for married-couple families in Oxon Hill show that 3.2% or 86 of the total 2,731 families live below the poverty line. Families with 3 or 4 children have the highest poverty rate of 19.3%, comprising of 29 families. On the other hand, families with no children have the lowest poverty rate of 1.5%, which includes 25 families.
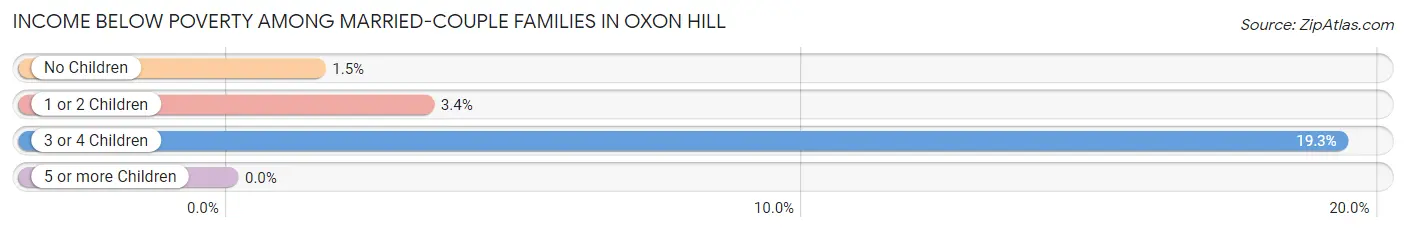
| Children | Above Poverty | Below Poverty |
| No Children | 1,618 (98.5%) | 25 (1.5%) |
| 1 or 2 Children | 906 (96.6%) | 32 (3.4%) |
| 3 or 4 Children | 121 (80.7%) | 29 (19.3%) |
| 5 or more Children | 0 (0.0%) | 0 (0.0%) |
| Total | 2,645 (96.9%) | 86 (3.2%) |
Income Below Poverty Among Single-Parent Households in Oxon Hill
According to the poverty data in Oxon Hill, 4.0% or 18 single-father households and 13.6% or 159 single-mother households are living below the poverty line. Among single-father households, those with 1 or 2 children have the highest poverty rate, with 18 households (10.1%) experiencing poverty. Likewise, among single-mother households, those with 5 or more children have the highest poverty rate, with 15 households (100.0%) falling below the poverty line.
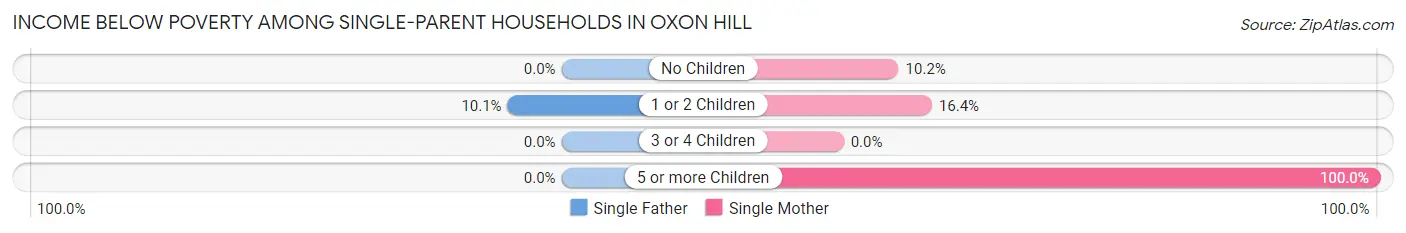
| Children | Single Father | Single Mother |
| No Children | 0 (0.0%) | 72 (10.2%) |
| 1 or 2 Children | 18 (10.1%) | 72 (16.4%) |
| 3 or 4 Children | 0 (0.0%) | 0 (0.0%) |
| 5 or more Children | 0 (0.0%) | 15 (100.0%) |
| Total | 18 (4.0%) | 159 (13.6%) |
Income Below Poverty Among Married-Couple vs Single-Parent Households in Oxon Hill
The poverty data for Oxon Hill shows that 86 of the married-couple family households (3.2%) and 177 of the single-parent households (10.9%) are living below the poverty level. Within the married-couple family households, those with 3 or 4 children have the highest poverty rate, with 29 households (19.3%) falling below the poverty line. Among the single-parent households, those with 5 or more children have the highest poverty rate, with 15 household (40.5%) living below poverty.
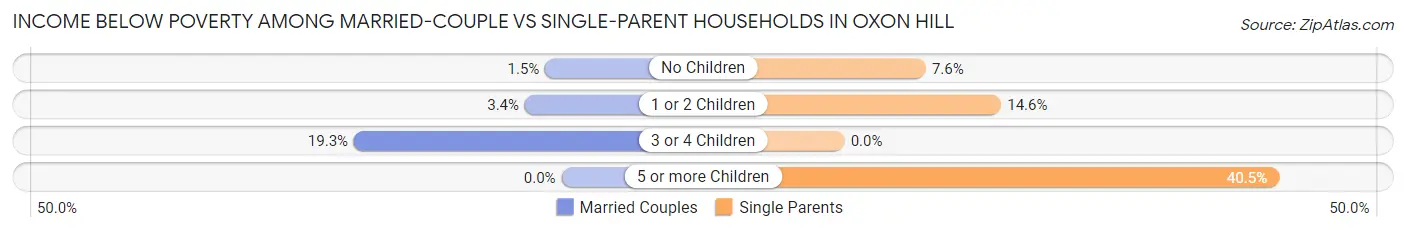
| Children | Married-Couple Families | Single-Parent Households |
| No Children | 25 (1.5%) | 72 (7.6%) |
| 1 or 2 Children | 32 (3.4%) | 90 (14.6%) |
| 3 or 4 Children | 29 (19.3%) | 0 (0.0%) |
| 5 or more Children | 0 (0.0%) | 15 (40.5%) |
| Total | 86 (3.2%) | 177 (10.9%) |
Race in Oxon Hill
The most populous races in Oxon Hill are Black / African American (13,072 | 70.6%), Hispanic or Latino (3,703 | 20.0%), and Some other Race (2,806 | 15.1%).
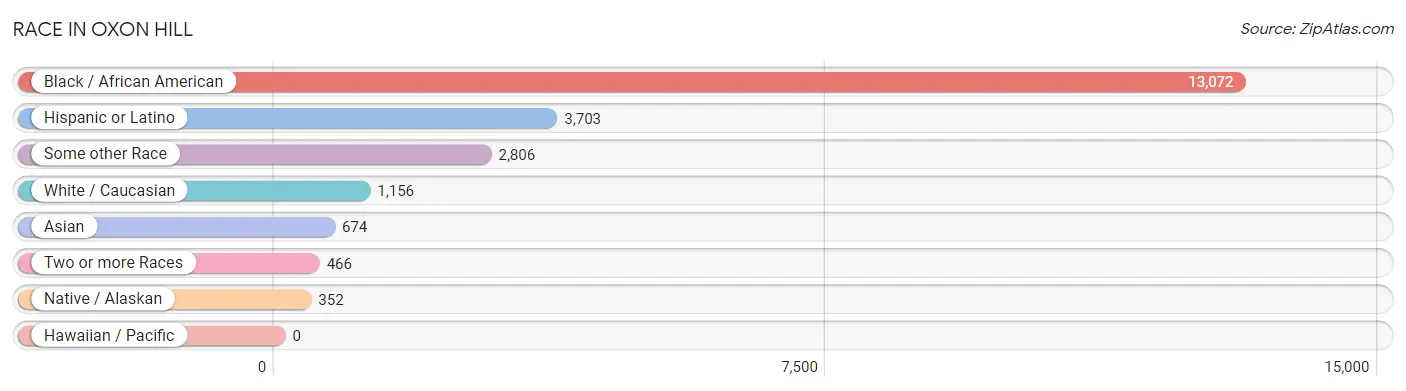
| Race | # Population | % Population |
| Asian | 674 | 3.6% |
| Black / African American | 13,072 | 70.6% |
| Hawaiian / Pacific | 0 | 0.0% |
| Hispanic or Latino | 3,703 | 20.0% |
| Native / Alaskan | 352 | 1.9% |
| White / Caucasian | 1,156 | 6.2% |
| Two or more Races | 466 | 2.5% |
| Some other Race | 2,806 | 15.1% |
| Total | 18,526 | 100.0% |
Ancestry in Oxon Hill
The most populous ancestries reported in Oxon Hill are Central American (2,878 | 15.5%), Salvadoran (1,853 | 10.0%), Korean (672 | 3.6%), Guatemalan (608 | 3.3%), and American (455 | 2.5%), together accounting for 34.9% of all Oxon Hill residents.
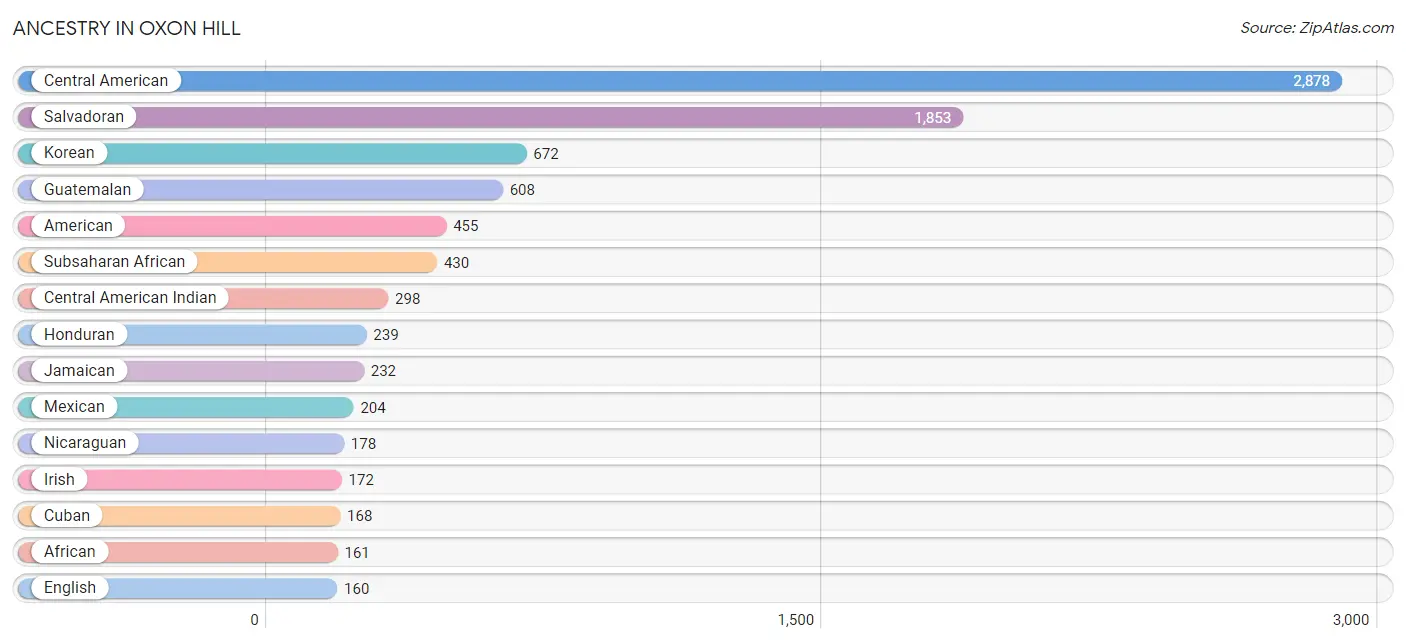
| Ancestry | # Population | % Population |
| African | 161 | 0.9% |
| American | 455 | 2.5% |
| Arab | 59 | 0.3% |
| Argentinean | 28 | 0.2% |
| Bahamian | 40 | 0.2% |
| Bhutanese | 45 | 0.2% |
| Bolivian | 10 | 0.1% |
| British | 17 | 0.1% |
| Burmese | 84 | 0.4% |
| Cape Verdean | 10 | 0.1% |
| Central American | 2,878 | 15.5% |
| Central American Indian | 298 | 1.6% |
| Cherokee | 60 | 0.3% |
| Chippewa | 9 | 0.1% |
| Cuban | 168 | 0.9% |
| Danish | 15 | 0.1% |
| Dominican | 15 | 0.1% |
| Dutch | 8 | 0.0% |
| Ecuadorian | 7 | 0.0% |
| English | 160 | 0.9% |
| Ethiopian | 40 | 0.2% |
| French | 9 | 0.1% |
| German | 148 | 0.8% |
| Ghanaian | 75 | 0.4% |
| Guamanian / Chamorro | 12 | 0.1% |
| Guatemalan | 608 | 3.3% |
| Guyanese | 33 | 0.2% |
| Haitian | 27 | 0.2% |
| Honduran | 239 | 1.3% |
| Hungarian | 9 | 0.1% |
| Indian (Asian) | 34 | 0.2% |
| Irish | 172 | 0.9% |
| Italian | 85 | 0.5% |
| Jamaican | 232 | 1.3% |
| Korean | 672 | 3.6% |
| Liberian | 19 | 0.1% |
| Mexican | 204 | 1.1% |
| Moroccan | 59 | 0.3% |
| Nicaraguan | 178 | 1.0% |
| Nigerian | 48 | 0.3% |
| Peruvian | 18 | 0.1% |
| Polish | 117 | 0.6% |
| Puerto Rican | 38 | 0.2% |
| Russian | 1 | 0.0% |
| Salvadoran | 1,853 | 10.0% |
| Scotch-Irish | 62 | 0.3% |
| Scottish | 105 | 0.6% |
| Sierra Leonean | 15 | 0.1% |
| Slovak | 6 | 0.0% |
| South American | 63 | 0.3% |
| South American Indian | 10 | 0.1% |
| Sri Lankan | 28 | 0.2% |
| Subsaharan African | 430 | 2.3% |
| Swedish | 7 | 0.0% |
| Thai | 55 | 0.3% |
| Trinidadian and Tobagonian | 26 | 0.1% |
| Turkish | 9 | 0.1% |
| Ugandan | 1 | 0.0% |
| West Indian | 11 | 0.1% |
| Yugoslavian | 5 | 0.0% | View All 60 Rows |
Immigrants in Oxon Hill
The most numerous immigrant groups reported in Oxon Hill came from Latin America (2,446 | 13.2%), Central America (1,915 | 10.3%), El Salvador (977 | 5.3%), Asia (640 | 3.5%), and South Eastern Asia (590 | 3.2%), together accounting for 35.4% of all Oxon Hill residents.
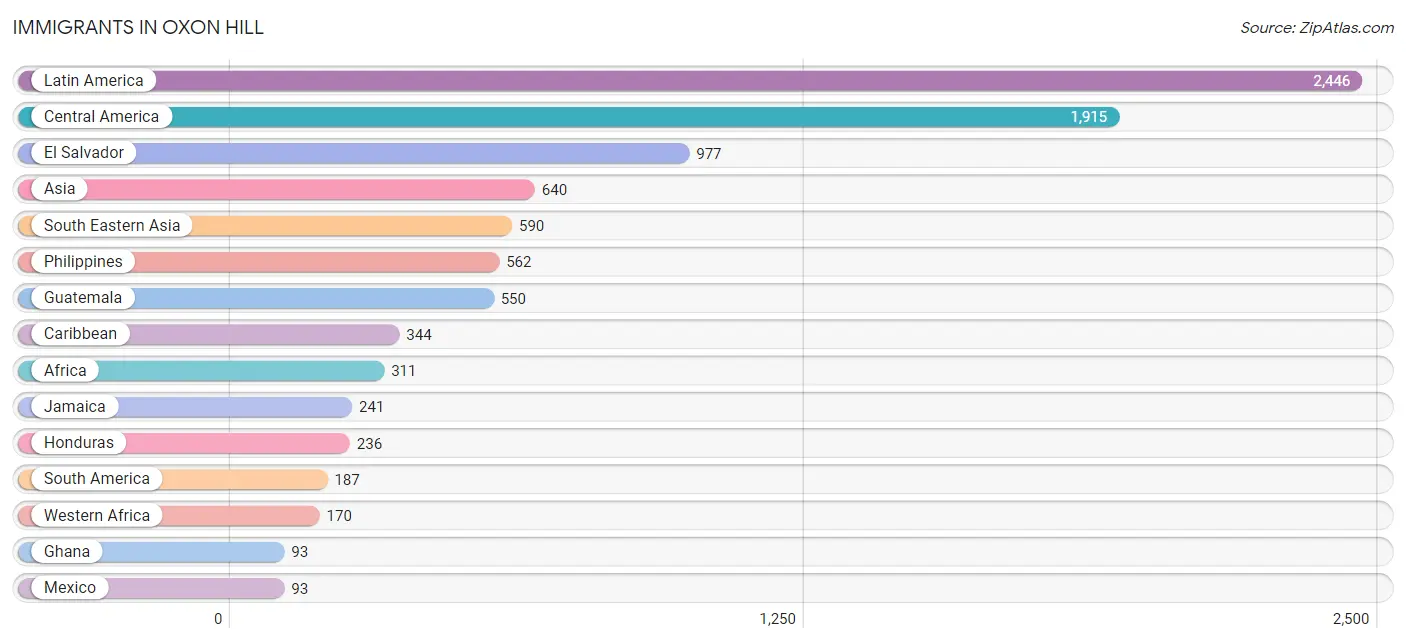
| Immigration Origin | # Population | % Population |
| Africa | 311 | 1.7% |
| Argentina | 21 | 0.1% |
| Asia | 640 | 3.5% |
| Bahamas | 40 | 0.2% |
| Brazil | 9 | 0.1% |
| Cameroon | 45 | 0.2% |
| Caribbean | 344 | 1.9% |
| Central America | 1,915 | 10.3% |
| Colombia | 8 | 0.0% |
| Cuba | 13 | 0.1% |
| Eastern Africa | 90 | 0.5% |
| Eastern Asia | 41 | 0.2% |
| Ecuador | 81 | 0.4% |
| El Salvador | 977 | 5.3% |
| Ethiopia | 89 | 0.5% |
| Ghana | 93 | 0.5% |
| Guatemala | 550 | 3.0% |
| Guyana | 50 | 0.3% |
| Honduras | 236 | 1.3% |
| Jamaica | 241 | 1.3% |
| Japan | 11 | 0.1% |
| Korea | 30 | 0.2% |
| Latin America | 2,446 | 13.2% |
| Liberia | 21 | 0.1% |
| Mexico | 93 | 0.5% |
| Middle Africa | 45 | 0.2% |
| Nicaragua | 59 | 0.3% |
| Nigeria | 41 | 0.2% |
| Peru | 18 | 0.1% |
| Philippines | 562 | 3.0% |
| South Africa | 6 | 0.0% |
| South America | 187 | 1.0% |
| South Eastern Asia | 590 | 3.2% |
| St. Vincent and the Grenadines | 24 | 0.1% |
| Trinidad and Tobago | 26 | 0.1% |
| Turkey | 9 | 0.1% |
| Uganda | 1 | 0.0% |
| Vietnam | 28 | 0.2% |
| Western Africa | 170 | 0.9% |
| Western Asia | 9 | 0.1% | View All 40 Rows |
Sex and Age in Oxon Hill
Sex and Age in Oxon Hill
The most populous age groups in Oxon Hill are 40 to 44 Years (845 | 9.5%) for men and 45 to 49 Years (876 | 9.1%) for women.
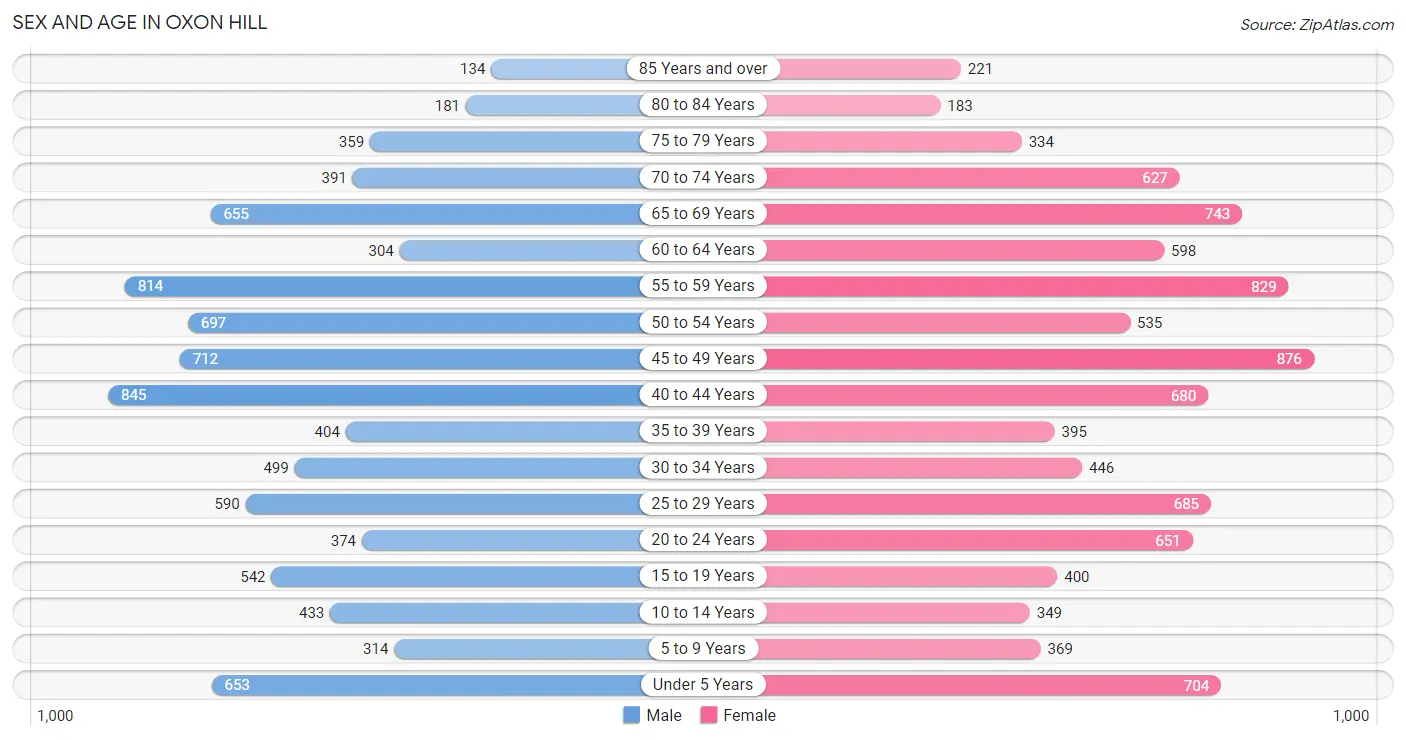
| Age Bracket | Male | Female |
| Under 5 Years | 653 (7.3%) | 704 (7.3%) |
| 5 to 9 Years | 314 (3.5%) | 369 (3.8%) |
| 10 to 14 Years | 433 (4.9%) | 349 (3.6%) |
| 15 to 19 Years | 542 (6.1%) | 400 (4.2%) |
| 20 to 24 Years | 374 (4.2%) | 651 (6.8%) |
| 25 to 29 Years | 590 (6.6%) | 685 (7.1%) |
| 30 to 34 Years | 499 (5.6%) | 446 (4.6%) |
| 35 to 39 Years | 404 (4.5%) | 395 (4.1%) |
| 40 to 44 Years | 845 (9.5%) | 680 (7.1%) |
| 45 to 49 Years | 712 (8.0%) | 876 (9.1%) |
| 50 to 54 Years | 697 (7.8%) | 535 (5.6%) |
| 55 to 59 Years | 814 (9.1%) | 829 (8.6%) |
| 60 to 64 Years | 304 (3.4%) | 598 (6.2%) |
| 65 to 69 Years | 655 (7.4%) | 743 (7.7%) |
| 70 to 74 Years | 391 (4.4%) | 627 (6.5%) |
| 75 to 79 Years | 359 (4.0%) | 334 (3.5%) |
| 80 to 84 Years | 181 (2.0%) | 183 (1.9%) |
| 85 Years and over | 134 (1.5%) | 221 (2.3%) |
| Total | 8,901 (100.0%) | 9,625 (100.0%) |
Families and Households in Oxon Hill
Median Family Size in Oxon Hill
The median family size in Oxon Hill is 3.26 persons per family, with married-couple families (2,731 | 62.8%) accounting for the largest median family size of 3.53 persons per family. On the other hand, single female/mother families (1,169 | 26.9%) represent the smallest median family size with 2.69 persons per family.
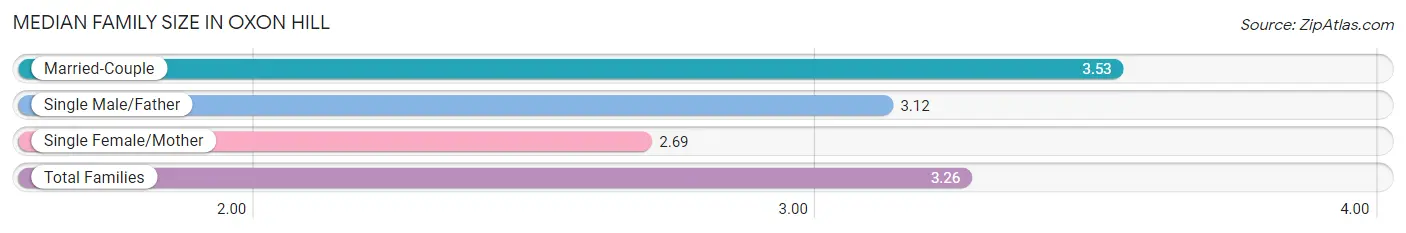
| Family Type | # Families | Family Size |
| Married-Couple | 2,731 (62.8%) | 3.53 |
| Single Male/Father | 449 (10.3%) | 3.12 |
| Single Female/Mother | 1,169 (26.9%) | 2.69 |
| Total Families | 4,349 (100.0%) | 3.26 |
Median Household Size in Oxon Hill
The median household size in Oxon Hill is 2.50 persons per household, with married-couple households (2,731 | 36.8%) accounting for the largest median household size of 3.62 persons per household. non-family households (3,062 | 41.3%) represent the smallest median household size with 1.22 persons per household.
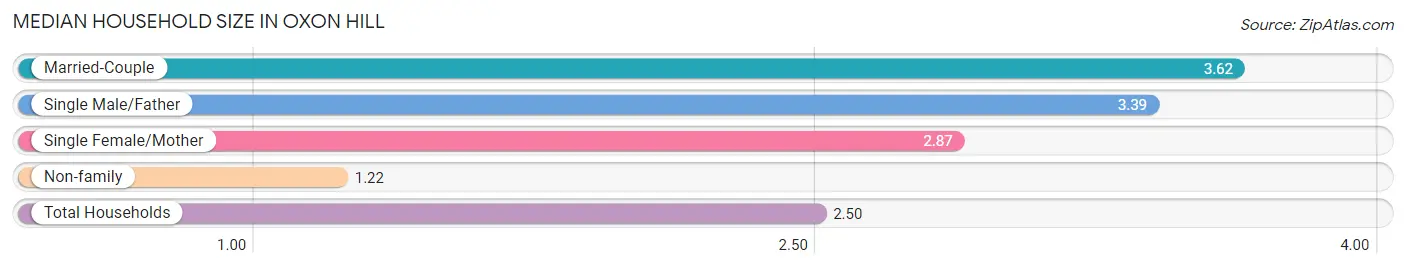
| Household Type | # Households | Household Size |
| Married-Couple | 2,731 (36.8%) | 3.62 |
| Single Male/Father | 449 (6.1%) | 3.39 |
| Single Female/Mother | 1,169 (15.8%) | 2.87 |
| Non-family | 3,062 (41.3%) | 1.22 |
| Total Households | 7,411 (100.0%) | 2.50 |
Household Size by Marriage Status in Oxon Hill
Out of a total of 7,411 households in Oxon Hill, 4,349 (58.7%) are family households, while 3,062 (41.3%) are nonfamily households. The most numerous type of family households are 2-person households, comprising 1,735, and the most common type of nonfamily households are 1-person households, comprising 2,708.
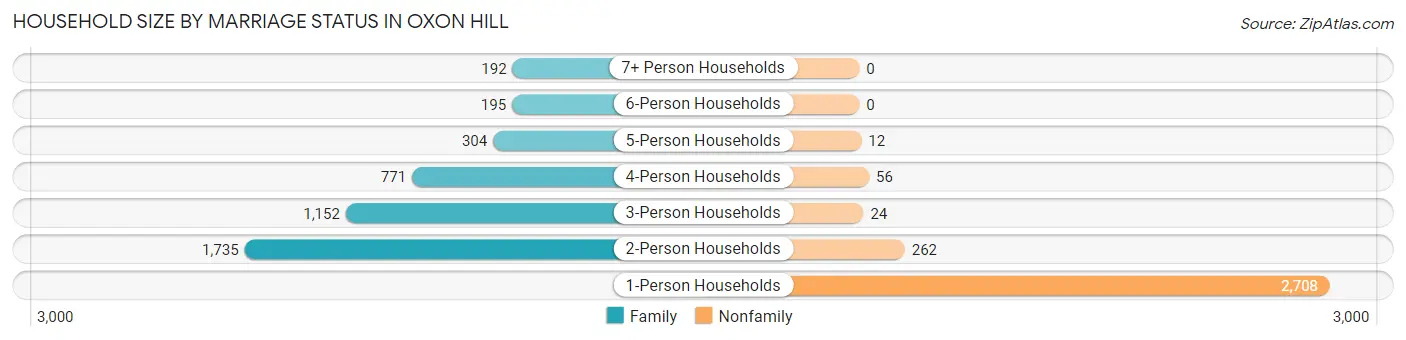
| Household Size | Family Households | Nonfamily Households |
| 1-Person Households | - | 2,708 (36.5%) |
| 2-Person Households | 1,735 (23.4%) | 262 (3.5%) |
| 3-Person Households | 1,152 (15.5%) | 24 (0.3%) |
| 4-Person Households | 771 (10.4%) | 56 (0.8%) |
| 5-Person Households | 304 (4.1%) | 12 (0.2%) |
| 6-Person Households | 195 (2.6%) | 0 (0.0%) |
| 7+ Person Households | 192 (2.6%) | 0 (0.0%) |
| Total | 4,349 (58.7%) | 3,062 (41.3%) |
Female Fertility in Oxon Hill
Fertility by Age in Oxon Hill
Average fertility rate in Oxon Hill is 64.0 births per 1,000 women. Women in the age bracket of 35 to 50 years have the highest fertility rate with 93.0 births per 1,000 women. Women in the age bracket of 35 to 50 years acount for 71.8% of all women with births.
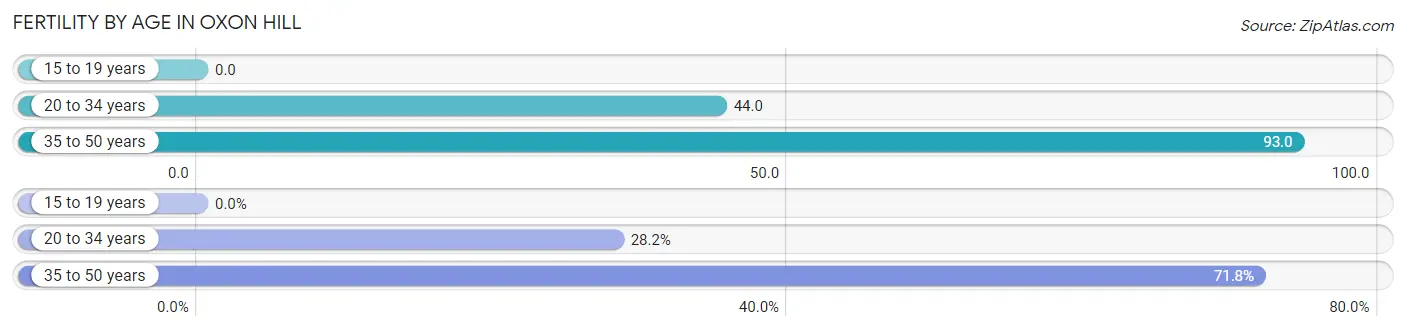
| Age Bracket | Women with Births | Births / 1,000 Women |
| 15 to 19 years | 0 (0.0%) | 0.0 |
| 20 to 34 years | 79 (28.2%) | 44.0 |
| 35 to 50 years | 201 (71.8%) | 93.0 |
| Total | 280 (100.0%) | 64.0 |
Fertility by Age by Marriage Status in Oxon Hill
76.8% of women with births (280) in Oxon Hill are married. The highest percentage of unmarried women with births falls into 20 to 34 years age bracket with 73.4% of them unmarried at the time of birth, while the lowest percentage of unmarried women with births belong to 35 to 50 years age bracket with 3.5% of them unmarried.
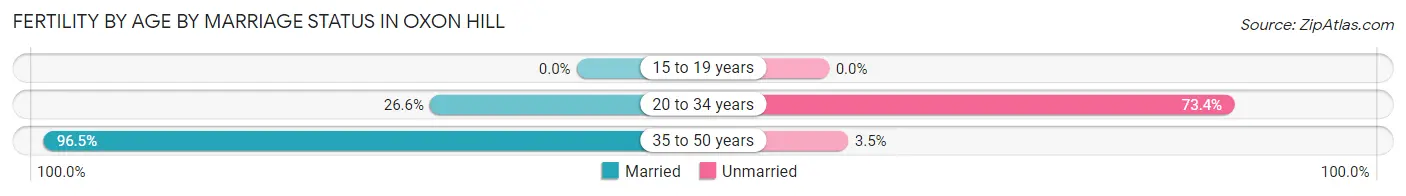
| Age Bracket | Married | Unmarried |
| 15 to 19 years | 0 (0.0%) | 0 (0.0%) |
| 20 to 34 years | 21 (26.6%) | 58 (73.4%) |
| 35 to 50 years | 194 (96.5%) | 7 (3.5%) |
| Total | 215 (76.8%) | 65 (23.2%) |
Fertility by Education in Oxon Hill
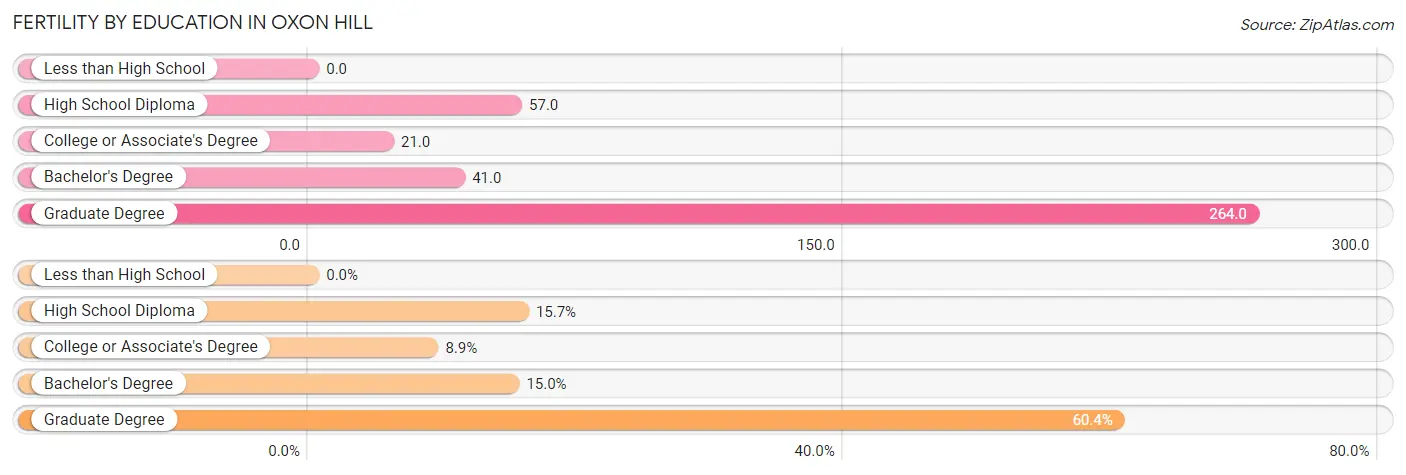
| Educational Attainment | Women with Births | Births / 1,000 Women |
| Less than High School | 0 (0.0%) | 0.0 |
| High School Diploma | 44 (15.7%) | 57.0 |
| College or Associate's Degree | 25 (8.9%) | 21.0 |
| Bachelor's Degree | 42 (15.0%) | 41.0 |
| Graduate Degree | 169 (60.4%) | 264.0 |
| Total | 280 (100.0%) | 64.0 |
Fertility by Education by Marriage Status in Oxon Hill
23.2% of women with births in Oxon Hill are unmarried. Women with the educational attainment of graduate degree are most likely to be married with 95.9% of them married at childbirth, while women with the educational attainment of bachelor's degree are least likely to be married with 100.0% of them unmarried at childbirth.
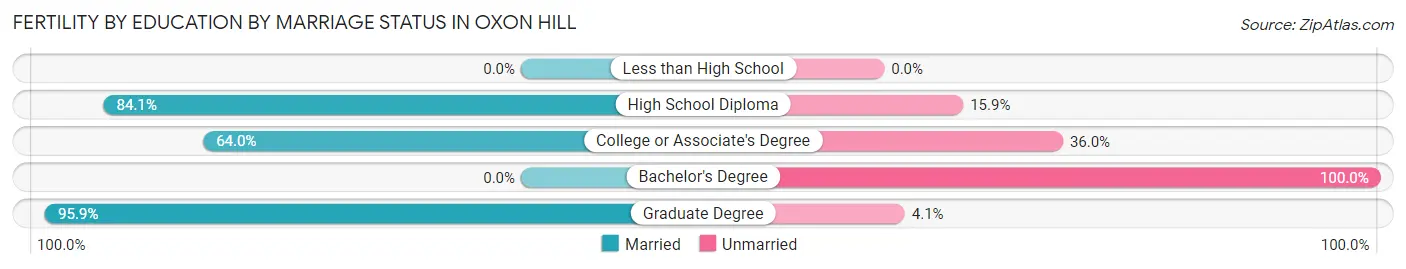
| Educational Attainment | Married | Unmarried |
| Less than High School | 0 (0.0%) | 0 (0.0%) |
| High School Diploma | 37 (84.1%) | 7 (15.9%) |
| College or Associate's Degree | 16 (64.0%) | 9 (36.0%) |
| Bachelor's Degree | 0 (0.0%) | 42 (100.0%) |
| Graduate Degree | 162 (95.9%) | 7 (4.1%) |
| Total | 215 (76.8%) | 65 (23.2%) |
Employment Characteristics in Oxon Hill
Employment by Class of Employer in Oxon Hill
Among the 9,734 employed individuals in Oxon Hill, private company employees (5,524 | 56.8%), federal government employees (1,770 | 18.2%), and local government employees (743 | 7.6%) make up the most common classes of employment.
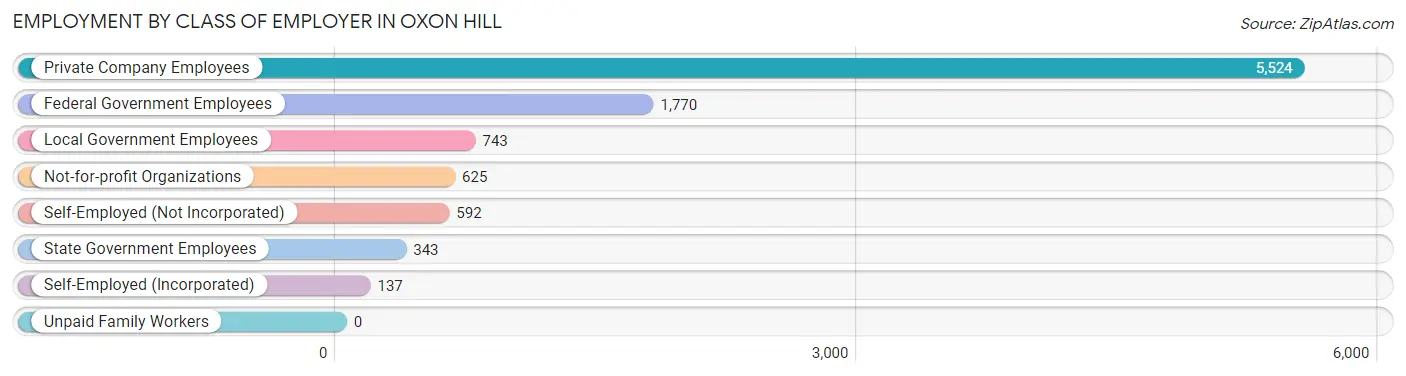
| Employer Class | # Employees | % Employees |
| Private Company Employees | 5,524 | 56.8% |
| Self-Employed (Incorporated) | 137 | 1.4% |
| Self-Employed (Not Incorporated) | 592 | 6.1% |
| Not-for-profit Organizations | 625 | 6.4% |
| Local Government Employees | 743 | 7.6% |
| State Government Employees | 343 | 3.5% |
| Federal Government Employees | 1,770 | 18.2% |
| Unpaid Family Workers | 0 | 0.0% |
| Total | 9,734 | 100.0% |
Employment Status by Age in Oxon Hill
According to the labor force statistics for Oxon Hill, out of the total population over 16 years of age (15,483), 69.3% or 10,730 individuals are in the labor force, with 7.1% or 762 of them unemployed. The age group with the highest labor force participation rate is 30 to 34 years, with 90.6% or 856 individuals in the labor force. Within the labor force, the 16 to 19 years age range has the highest percentage of unemployed individuals, with 20.7% or 62 of them being unemployed.
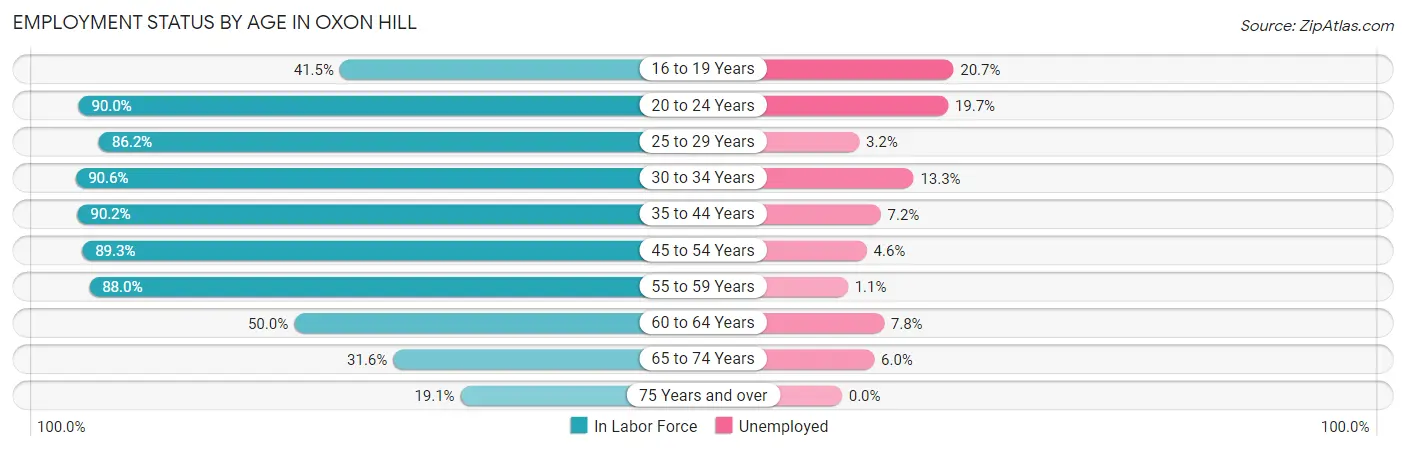
| Age Bracket | In Labor Force | Unemployed |
| 16 to 19 Years | 299 (41.5%) | 62 (20.7%) |
| 20 to 24 Years | 922 (90.0%) | 182 (19.7%) |
| 25 to 29 Years | 1,099 (86.2%) | 35 (3.2%) |
| 30 to 34 Years | 856 (90.6%) | 114 (13.3%) |
| 35 to 44 Years | 2,096 (90.2%) | 151 (7.2%) |
| 45 to 54 Years | 2,518 (89.3%) | 116 (4.6%) |
| 55 to 59 Years | 1,446 (88.0%) | 16 (1.1%) |
| 60 to 64 Years | 451 (50.0%) | 35 (7.8%) |
| 65 to 74 Years | 763 (31.6%) | 46 (6.0%) |
| 75 Years and over | 270 (19.1%) | 0 (0.0%) |
| Total | 10,730 (69.3%) | 762 (7.1%) |
Employment Status by Educational Attainment in Oxon Hill
According to labor force statistics for Oxon Hill, 85.4% of individuals (8,462) out of the total population between 25 and 64 years of age (9,909) are in the labor force, with 5.5% or 465 of them being unemployed. The group with the highest labor force participation rate are those with the educational attainment of bachelor's degree or higher, with 92.1% or 2,931 individuals in the labor force. Within the labor force, individuals with college / associate degree education have the highest percentage of unemployment, with 9.0% or 230 of them being unemployed.
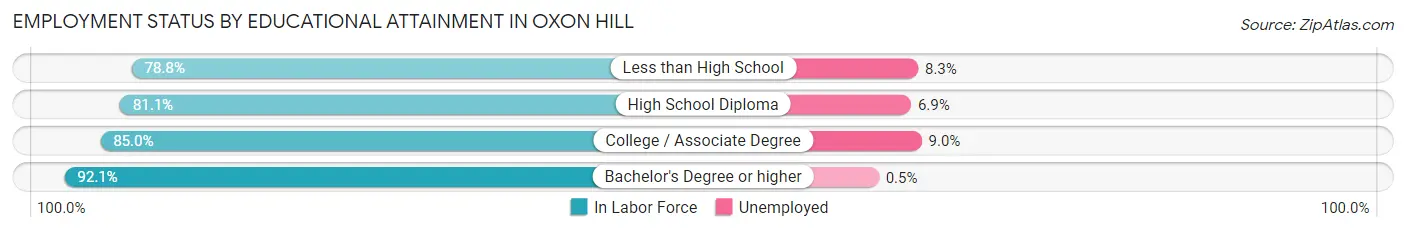
| Educational Attainment | In Labor Force | Unemployed |
| Less than High School | 1,239 (78.8%) | 130 (8.3%) |
| High School Diploma | 1,740 (81.1%) | 148 (6.9%) |
| College / Associate Degree | 2,558 (85.0%) | 271 (9.0%) |
| Bachelor's Degree or higher | 2,931 (92.1%) | 16 (0.5%) |
| Total | 8,462 (85.4%) | 545 (5.5%) |
Employment Occupations by Sex in Oxon Hill
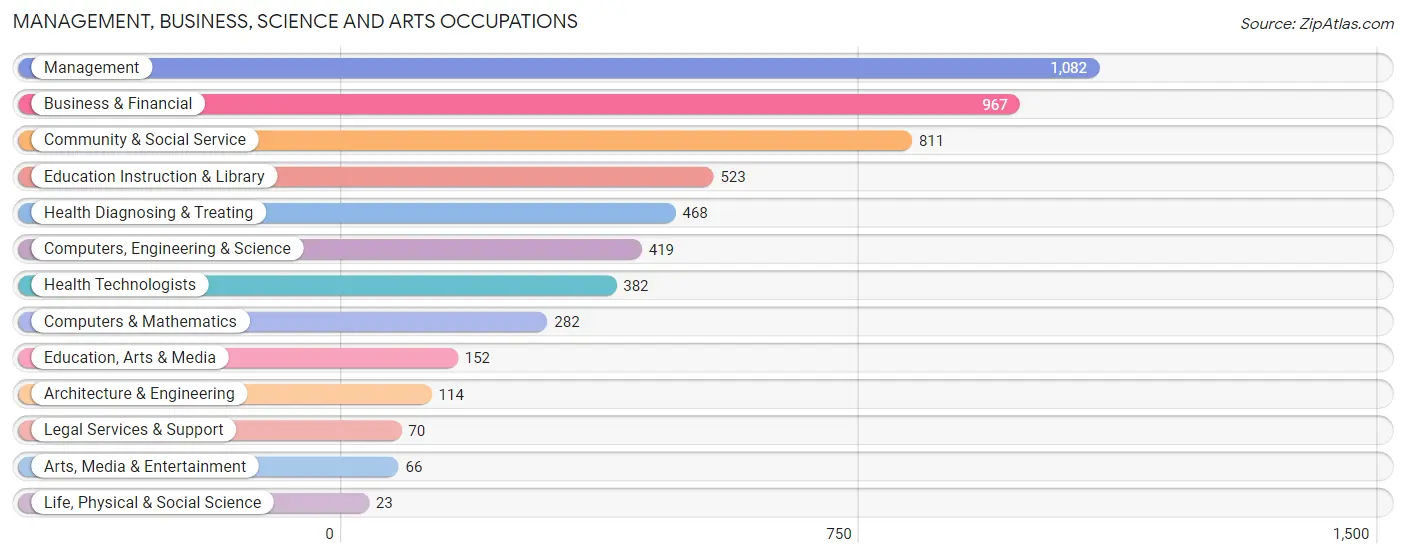
Management, Business, Science and Arts Occupations
The most common Management, Business, Science and Arts occupations in Oxon Hill are Management (1,082 | 10.9%), Business & Financial (967 | 9.8%), Community & Social Service (811 | 8.2%), Education Instruction & Library (523 | 5.3%), and Health Diagnosing & Treating (468 | 4.7%).
Management, Business, Science and Arts Occupations by Sex
Within the Management, Business, Science and Arts occupations in Oxon Hill, the most male-oriented occupations are Arts, Media & Entertainment (86.4%), Computers & Mathematics (51.1%), and Computers, Engineering & Science (45.1%), while the most female-oriented occupations are Health Technologists (91.6%), Health Diagnosing & Treating (87.8%), and Business & Financial (86.1%).
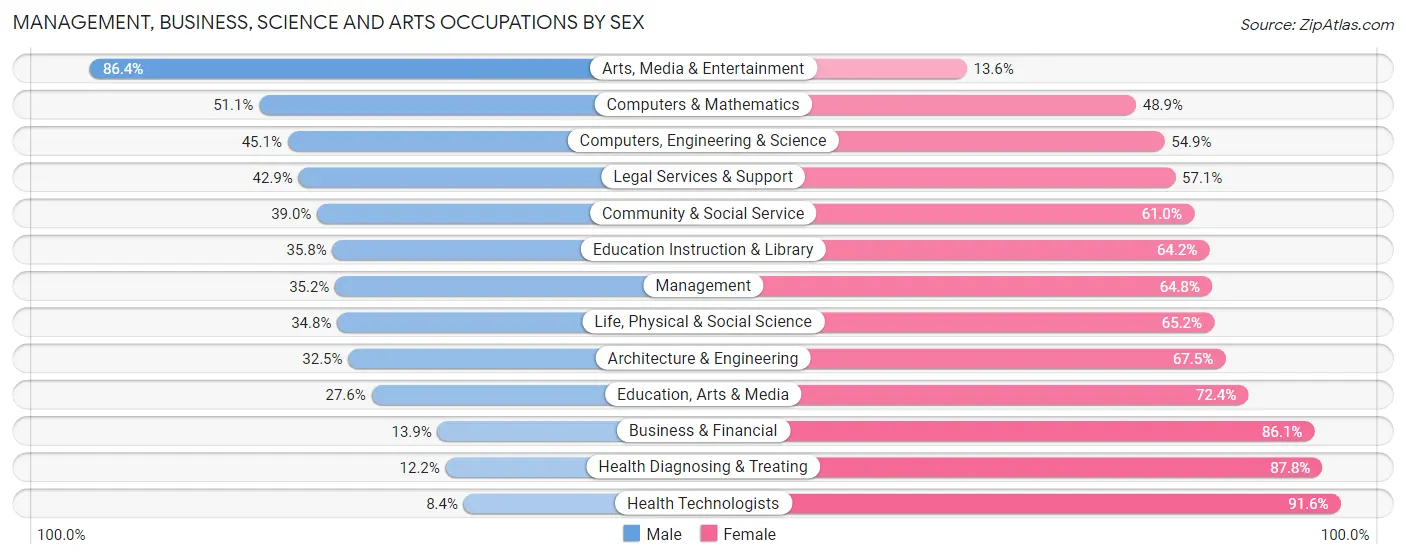
| Occupation | Male | Female |
| Management | 381 (35.2%) | 701 (64.8%) |
| Business & Financial | 134 (13.9%) | 833 (86.1%) |
| Computers, Engineering & Science | 189 (45.1%) | 230 (54.9%) |
| Computers & Mathematics | 144 (51.1%) | 138 (48.9%) |
| Architecture & Engineering | 37 (32.5%) | 77 (67.5%) |
| Life, Physical & Social Science | 8 (34.8%) | 15 (65.2%) |
| Community & Social Service | 316 (39.0%) | 495 (61.0%) |
| Education, Arts & Media | 42 (27.6%) | 110 (72.4%) |
| Legal Services & Support | 30 (42.9%) | 40 (57.1%) |
| Education Instruction & Library | 187 (35.8%) | 336 (64.2%) |
| Arts, Media & Entertainment | 57 (86.4%) | 9 (13.6%) |
| Health Diagnosing & Treating | 57 (12.2%) | 411 (87.8%) |
| Health Technologists | 32 (8.4%) | 350 (91.6%) |
| Total (Category) | 1,077 (28.7%) | 2,670 (71.3%) |
| Total (Overall) | 4,986 (50.3%) | 4,927 (49.7%) |
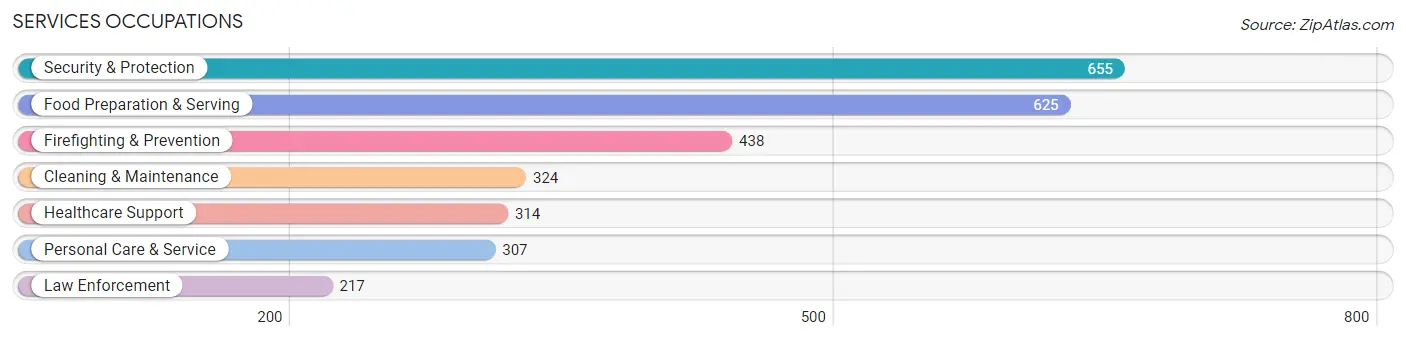
Services Occupations
The most common Services occupations in Oxon Hill are Security & Protection (655 | 6.6%), Food Preparation & Serving (625 | 6.3%), Firefighting & Prevention (438 | 4.4%), Cleaning & Maintenance (324 | 3.3%), and Healthcare Support (314 | 3.2%).
Services Occupations by Sex
Within the Services occupations in Oxon Hill, the most male-oriented occupations are Firefighting & Prevention (82.2%), Security & Protection (72.5%), and Cleaning & Maintenance (62.0%), while the most female-oriented occupations are Personal Care & Service (68.7%), Healthcare Support (68.1%), and Law Enforcement (47.0%).
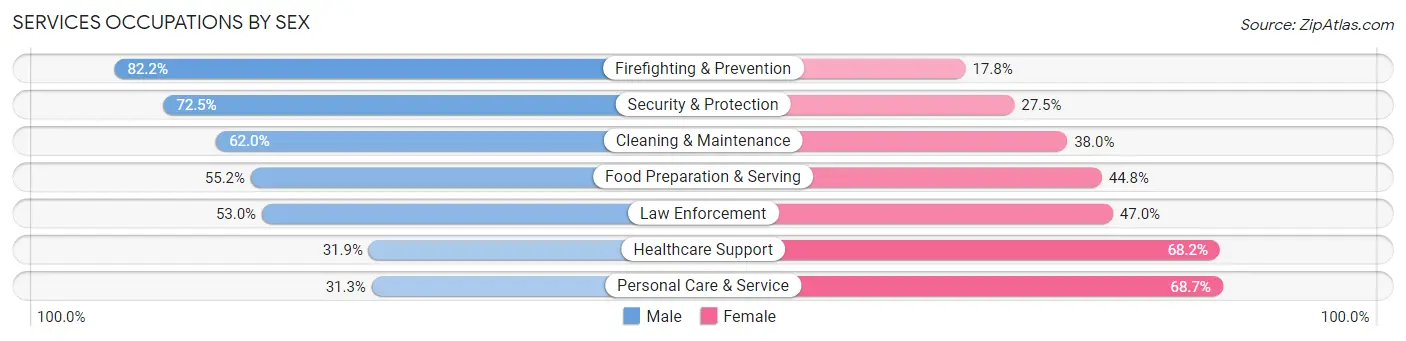
| Occupation | Male | Female |
| Healthcare Support | 100 (31.9%) | 214 (68.1%) |
| Security & Protection | 475 (72.5%) | 180 (27.5%) |
| Firefighting & Prevention | 360 (82.2%) | 78 (17.8%) |
| Law Enforcement | 115 (53.0%) | 102 (47.0%) |
| Food Preparation & Serving | 345 (55.2%) | 280 (44.8%) |
| Cleaning & Maintenance | 201 (62.0%) | 123 (38.0%) |
| Personal Care & Service | 96 (31.3%) | 211 (68.7%) |
| Total (Category) | 1,217 (54.7%) | 1,008 (45.3%) |
| Total (Overall) | 4,986 (50.3%) | 4,927 (49.7%) |
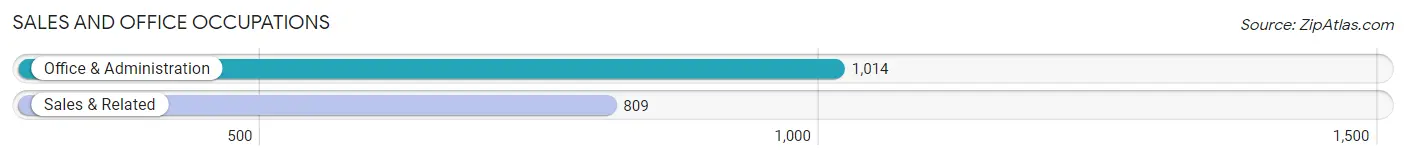
Sales and Office Occupations
The most common Sales and Office occupations in Oxon Hill are Office & Administration (1,014 | 10.2%), and Sales & Related (809 | 8.2%).
Sales and Office Occupations by Sex
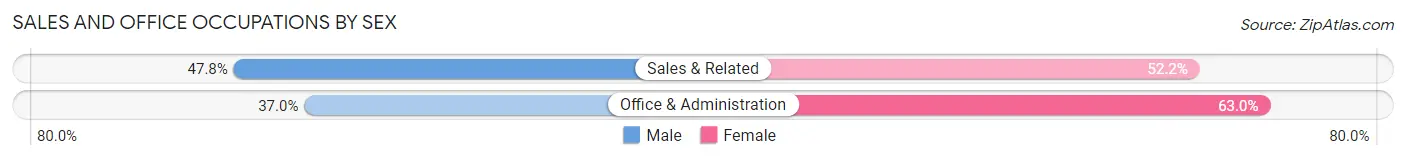
| Occupation | Male | Female |
| Sales & Related | 387 (47.8%) | 422 (52.2%) |
| Office & Administration | 375 (37.0%) | 639 (63.0%) |
| Total (Category) | 762 (41.8%) | 1,061 (58.2%) |
| Total (Overall) | 4,986 (50.3%) | 4,927 (49.7%) |
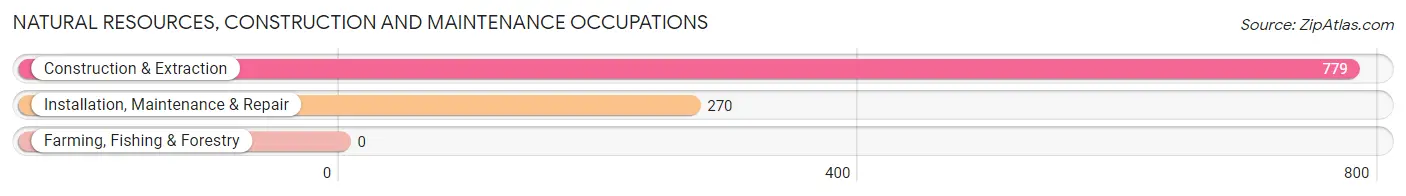
Natural Resources, Construction and Maintenance Occupations
The most common Natural Resources, Construction and Maintenance occupations in Oxon Hill are Construction & Extraction (779 | 7.9%), and Installation, Maintenance & Repair (270 | 2.7%).
Natural Resources, Construction and Maintenance Occupations by Sex
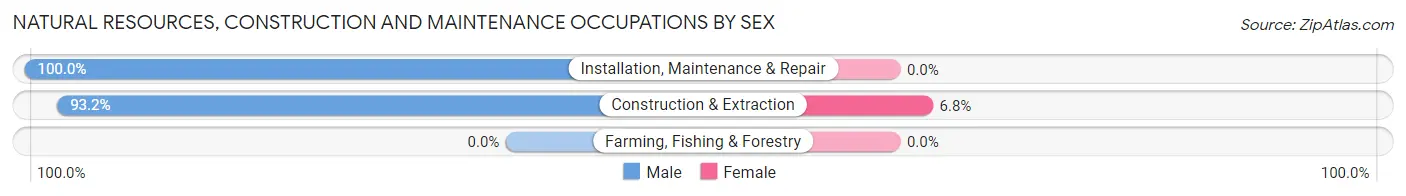
| Occupation | Male | Female |
| Farming, Fishing & Forestry | 0 (0.0%) | 0 (0.0%) |
| Construction & Extraction | 726 (93.2%) | 53 (6.8%) |
| Installation, Maintenance & Repair | 270 (100.0%) | 0 (0.0%) |
| Total (Category) | 996 (95.0%) | 53 (5.1%) |
| Total (Overall) | 4,986 (50.3%) | 4,927 (49.7%) |
Production, Transportation and Moving Occupations
The most common Production, Transportation and Moving occupations in Oxon Hill are Transportation (690 | 7.0%), Production (279 | 2.8%), and Material Moving (100 | 1.0%).
Production, Transportation and Moving Occupations by Sex
| Occupation | Male | Female |
| Production | 204 (73.1%) | 75 (26.9%) |
| Transportation | 640 (92.7%) | 50 (7.2%) |
| Material Moving | 90 (90.0%) | 10 (10.0%) |
| Total (Category) | 934 (87.4%) | 135 (12.6%) |
| Total (Overall) | 4,986 (50.3%) | 4,927 (49.7%) |
Employment Industries by Sex in Oxon Hill
Employment Industries in Oxon Hill
The major employment industries in Oxon Hill include Public Administration (1,518 | 15.3%), Health Care & Social Assistance (1,206 | 12.2%), Educational Services (967 | 9.8%), Construction (959 | 9.7%), and Retail Trade (798 | 8.1%).
Employment Industries by Sex in Oxon Hill
The Oxon Hill industries that see more men than women are Construction (92.4%), Transportation & Warehousing (86.3%), and Arts, Entertainment & Recreation (73.2%), whereas the industries that tend to have a higher number of women are Information (100.0%), Manufacturing (75.5%), and Health Care & Social Assistance (73.1%).
| Industry | Male | Female |
| Agriculture, Fishing & Hunting | 0 (0.0%) | 0 (0.0%) |
| Mining, Quarrying, & Extraction | 0 (0.0%) | 0 (0.0%) |
| Construction | 886 (92.4%) | 73 (7.6%) |
| Manufacturing | 13 (24.5%) | 40 (75.5%) |
| Wholesale Trade | 67 (72.0%) | 26 (28.0%) |
| Retail Trade | 438 (54.9%) | 360 (45.1%) |
| Transportation & Warehousing | 647 (86.3%) | 103 (13.7%) |
| Utilities | 44 (36.4%) | 77 (63.6%) |
| Information | 0 (0.0%) | 81 (100.0%) |
| Finance & Insurance | 63 (27.9%) | 163 (72.1%) |
| Real Estate, Rental & Leasing | 148 (45.0%) | 181 (55.0%) |
| Professional & Scientific | 287 (40.8%) | 416 (59.2%) |
| Enterprise Management | 0 (0.0%) | 0 (0.0%) |
| Administrative & Support | 333 (55.0%) | 272 (45.0%) |
| Educational Services | 303 (31.3%) | 664 (68.7%) |
| Health Care & Social Assistance | 325 (27.0%) | 881 (73.1%) |
| Arts, Entertainment & Recreation | 276 (73.2%) | 101 (26.8%) |
| Accommodation & Food Services | 268 (55.7%) | 213 (44.3%) |
| Public Administration | 554 (36.5%) | 964 (63.5%) |
| Total | 4,986 (50.3%) | 4,927 (49.7%) |
Education in Oxon Hill
School Enrollment in Oxon Hill
The most common levels of schooling among the 3,438 students in Oxon Hill are college / undergraduate (1,054 | 30.7%), high school (788 | 22.9%), and elementary school (628 | 18.3%).
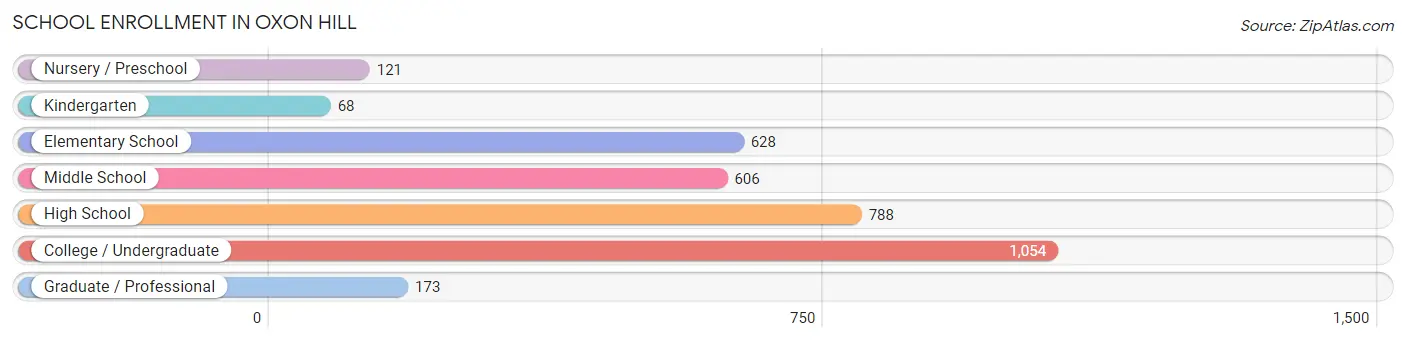
| School Level | # Students | % Students |
| Nursery / Preschool | 121 | 3.5% |
| Kindergarten | 68 | 2.0% |
| Elementary School | 628 | 18.3% |
| Middle School | 606 | 17.6% |
| High School | 788 | 22.9% |
| College / Undergraduate | 1,054 | 30.7% |
| Graduate / Professional | 173 | 5.0% |
| Total | 3,438 | 100.0% |
School Enrollment by Age by Funding Source in Oxon Hill
Out of a total of 3,438 students who are enrolled in schools in Oxon Hill, 392 (11.4%) attend a private institution, while the remaining 3,046 (88.6%) are enrolled in public schools. The age group of 25 to 34 year olds has the highest likelihood of being enrolled in private schools, with 56 (28.1% in the age bracket) enrolled. Conversely, the age group of 18 to 19 year olds has the lowest likelihood of being enrolled in a private school, with 289 (100.0% in the age bracket) attending a public institution.
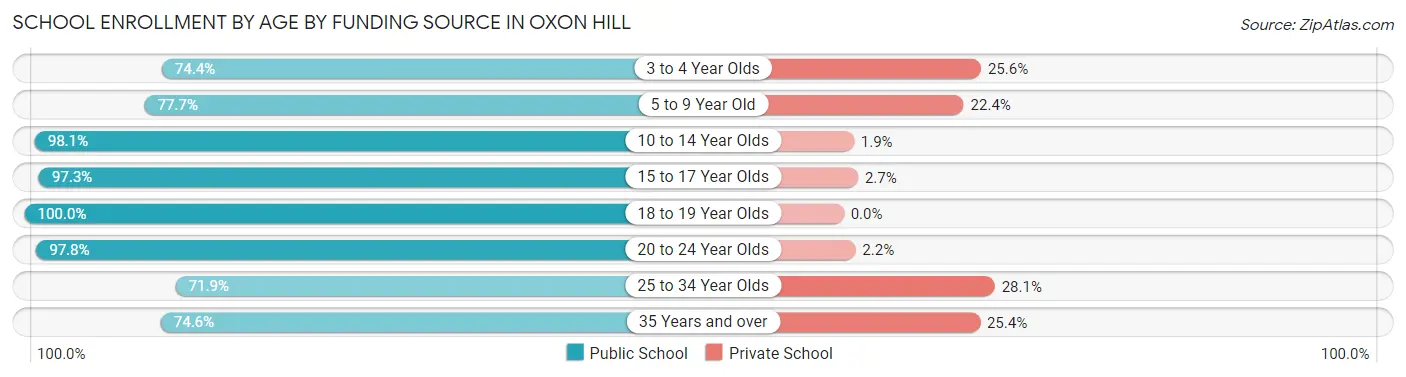
| Age Bracket | Public School | Private School |
| 3 to 4 Year Olds | 96 (74.4%) | 33 (25.6%) |
| 5 to 9 Year Old | 469 (77.6%) | 135 (22.4%) |
| 10 to 14 Year Olds | 723 (98.1%) | 14 (1.9%) |
| 15 to 17 Year Olds | 583 (97.3%) | 16 (2.7%) |
| 18 to 19 Year Olds | 289 (100.0%) | 0 (0.0%) |
| 20 to 24 Year Olds | 357 (97.8%) | 8 (2.2%) |
| 25 to 34 Year Olds | 143 (71.9%) | 56 (28.1%) |
| 35 Years and over | 385 (74.6%) | 131 (25.4%) |
| Total | 3,046 (88.6%) | 392 (11.4%) |
Educational Attainment by Field of Study in Oxon Hill
Business (1,155 | 26.2%), science & technology (536 | 12.2%), education (367 | 8.3%), computers & mathematics (362 | 8.2%), and communications (310 | 7.0%) are the most common fields of study among 4,403 individuals in Oxon Hill who have obtained a bachelor's degree or higher.
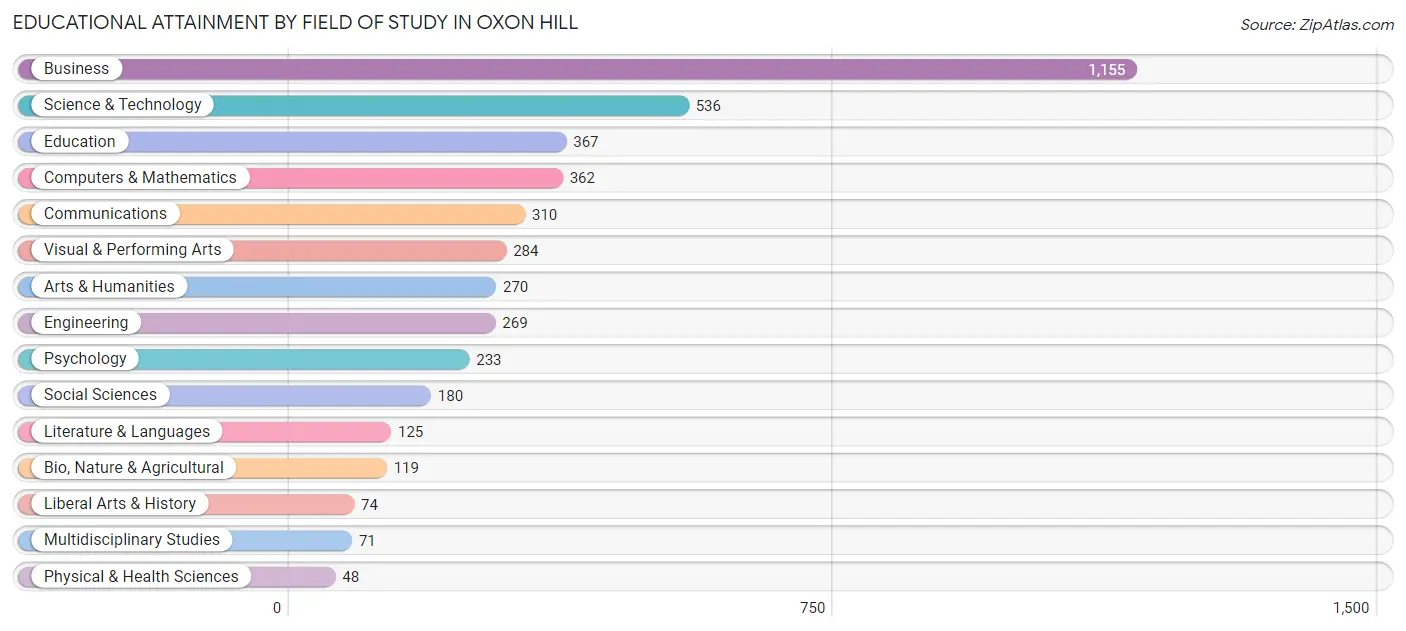
| Field of Study | # Graduates | % Graduates |
| Computers & Mathematics | 362 | 8.2% |
| Bio, Nature & Agricultural | 119 | 2.7% |
| Physical & Health Sciences | 48 | 1.1% |
| Psychology | 233 | 5.3% |
| Social Sciences | 180 | 4.1% |
| Engineering | 269 | 6.1% |
| Multidisciplinary Studies | 71 | 1.6% |
| Science & Technology | 536 | 12.2% |
| Business | 1,155 | 26.2% |
| Education | 367 | 8.3% |
| Literature & Languages | 125 | 2.8% |
| Liberal Arts & History | 74 | 1.7% |
| Visual & Performing Arts | 284 | 6.5% |
| Communications | 310 | 7.0% |
| Arts & Humanities | 270 | 6.1% |
| Total | 4,403 | 100.0% |
Transportation & Commute in Oxon Hill
Vehicle Availability by Sex in Oxon Hill
The most prevalent vehicle ownership categories in Oxon Hill are males with 2 vehicles (1,605, accounting for 32.5%) and females with 2 vehicles (1,348, making up 33.5%).
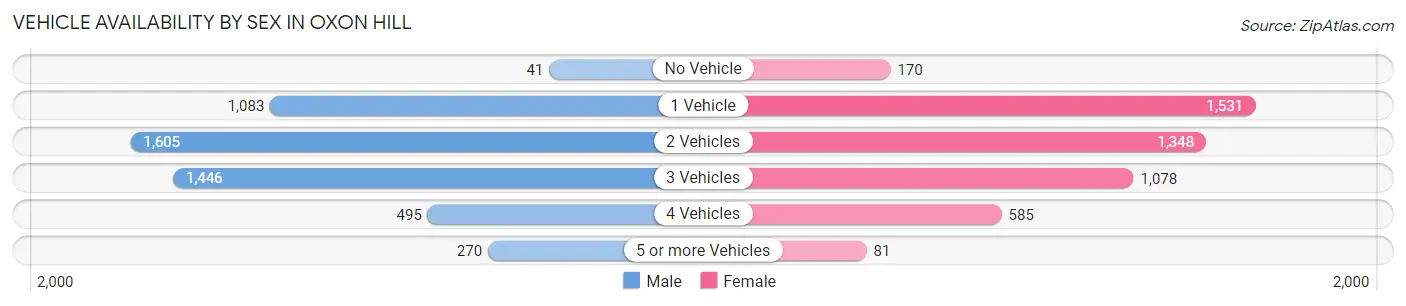
| Vehicles Available | Male | Female |
| No Vehicle | 41 (0.8%) | 170 (3.5%) |
| 1 Vehicle | 1,083 (21.9%) | 1,531 (31.9%) |
| 2 Vehicles | 1,605 (32.5%) | 1,348 (28.1%) |
| 3 Vehicles | 1,446 (29.3%) | 1,078 (22.5%) |
| 4 Vehicles | 495 (10.0%) | 585 (12.2%) |
| 5 or more Vehicles | 270 (5.5%) | 81 (1.7%) |
| Total | 4,940 (100.0%) | 4,793 (100.0%) |
Commute Time in Oxon Hill
The most frequently occuring commute durations in Oxon Hill are 45 to 59 minutes (1,977 commuters, 23.4%), 20 to 24 minutes (1,185 commuters, 14.1%), and 60 to 89 minutes (1,180 commuters, 14.0%).
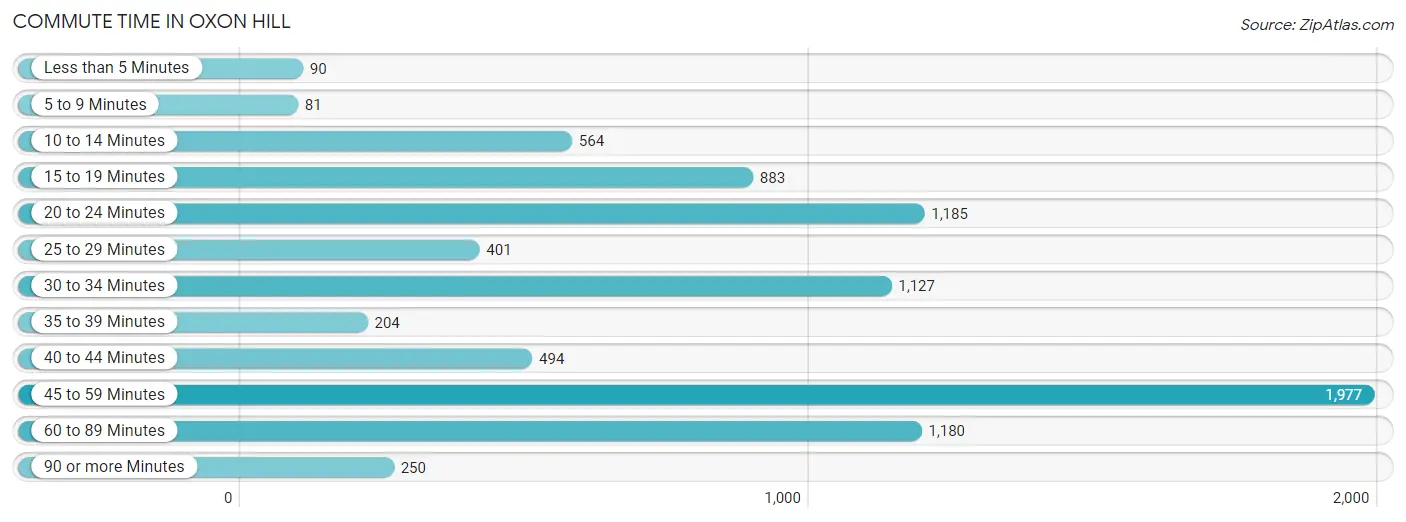
| Commute Time | # Commuters | % Commuters |
| Less than 5 Minutes | 90 | 1.1% |
| 5 to 9 Minutes | 81 | 1.0% |
| 10 to 14 Minutes | 564 | 6.7% |
| 15 to 19 Minutes | 883 | 10.5% |
| 20 to 24 Minutes | 1,185 | 14.1% |
| 25 to 29 Minutes | 401 | 4.8% |
| 30 to 34 Minutes | 1,127 | 13.4% |
| 35 to 39 Minutes | 204 | 2.4% |
| 40 to 44 Minutes | 494 | 5.9% |
| 45 to 59 Minutes | 1,977 | 23.4% |
| 60 to 89 Minutes | 1,180 | 14.0% |
| 90 or more Minutes | 250 | 3.0% |
Commute Time by Sex in Oxon Hill
The most common commute times in Oxon Hill are 45 to 59 minutes (1,113 commuters, 24.4%) for males and 45 to 59 minutes (864 commuters, 22.3%) for females.
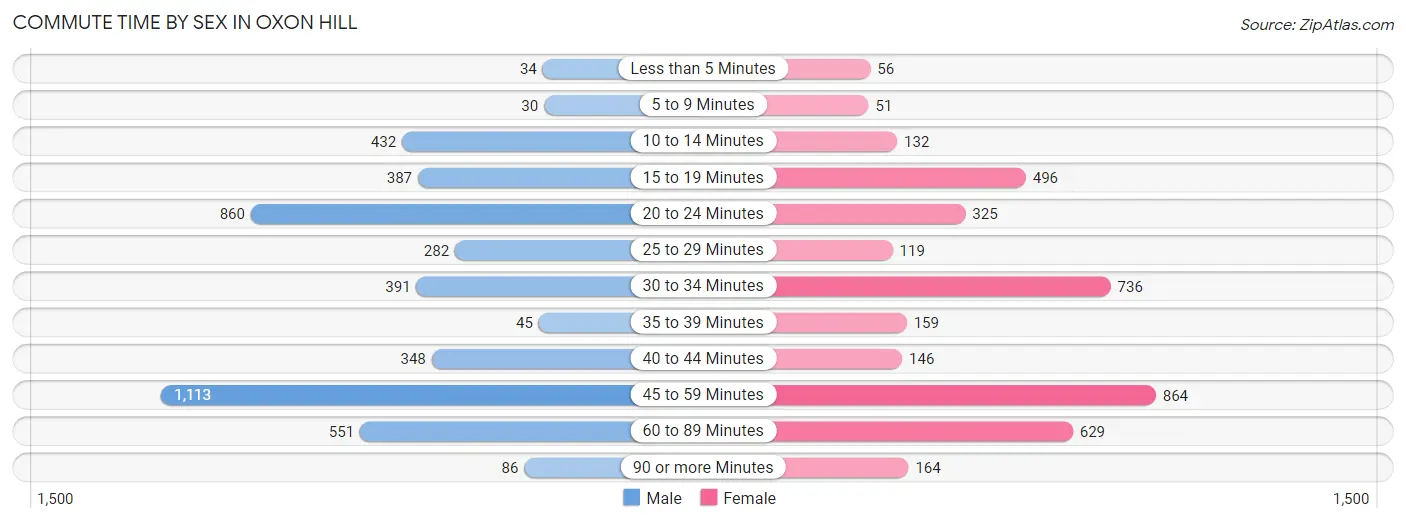
| Commute Time | Male | Female |
| Less than 5 Minutes | 34 (0.7%) | 56 (1.4%) |
| 5 to 9 Minutes | 30 (0.7%) | 51 (1.3%) |
| 10 to 14 Minutes | 432 (9.5%) | 132 (3.4%) |
| 15 to 19 Minutes | 387 (8.5%) | 496 (12.8%) |
| 20 to 24 Minutes | 860 (18.9%) | 325 (8.4%) |
| 25 to 29 Minutes | 282 (6.2%) | 119 (3.1%) |
| 30 to 34 Minutes | 391 (8.6%) | 736 (19.0%) |
| 35 to 39 Minutes | 45 (1.0%) | 159 (4.1%) |
| 40 to 44 Minutes | 348 (7.6%) | 146 (3.8%) |
| 45 to 59 Minutes | 1,113 (24.4%) | 864 (22.3%) |
| 60 to 89 Minutes | 551 (12.1%) | 629 (16.2%) |
| 90 or more Minutes | 86 (1.9%) | 164 (4.2%) |
Time of Departure to Work by Sex in Oxon Hill
The most frequent times of departure to work in Oxon Hill are 8:00 AM to 8:29 AM (789, 17.3%) for males and 6:00 AM to 6:29 AM (786, 20.3%) for females.
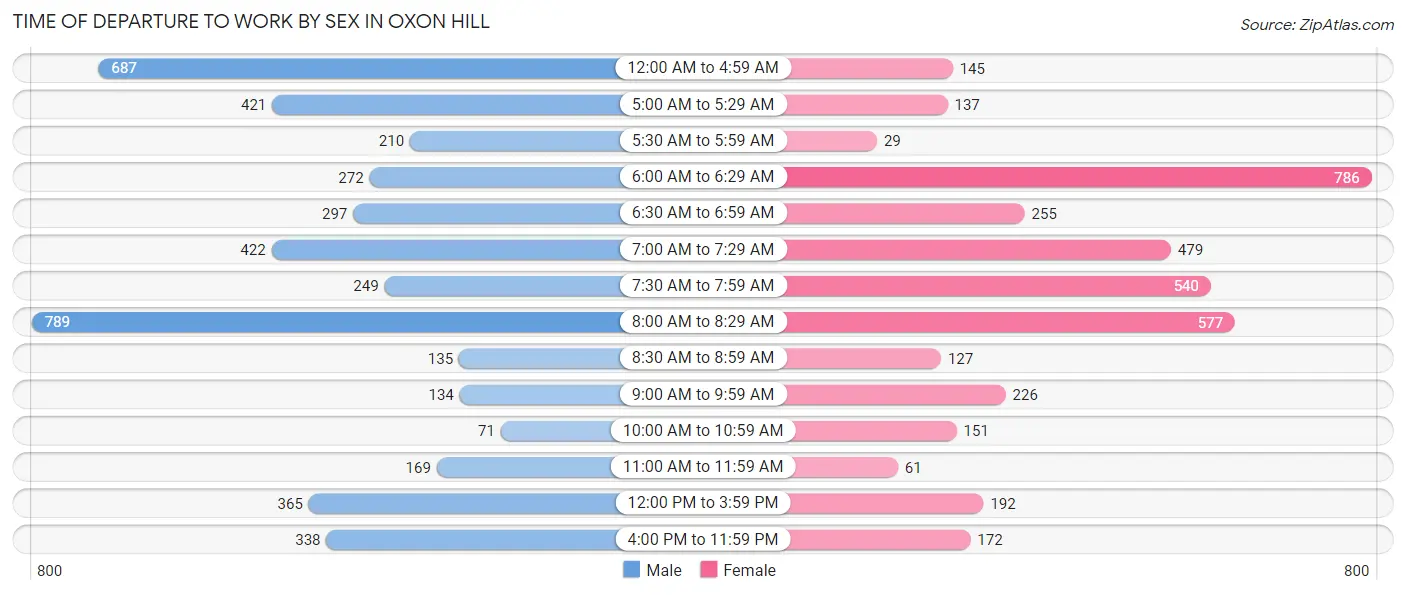
| Time of Departure | Male | Female |
| 12:00 AM to 4:59 AM | 687 (15.1%) | 145 (3.7%) |
| 5:00 AM to 5:29 AM | 421 (9.2%) | 137 (3.5%) |
| 5:30 AM to 5:59 AM | 210 (4.6%) | 29 (0.7%) |
| 6:00 AM to 6:29 AM | 272 (6.0%) | 786 (20.3%) |
| 6:30 AM to 6:59 AM | 297 (6.5%) | 255 (6.6%) |
| 7:00 AM to 7:29 AM | 422 (9.3%) | 479 (12.3%) |
| 7:30 AM to 7:59 AM | 249 (5.5%) | 540 (13.9%) |
| 8:00 AM to 8:29 AM | 789 (17.3%) | 577 (14.9%) |
| 8:30 AM to 8:59 AM | 135 (3.0%) | 127 (3.3%) |
| 9:00 AM to 9:59 AM | 134 (2.9%) | 226 (5.8%) |
| 10:00 AM to 10:59 AM | 71 (1.6%) | 151 (3.9%) |
| 11:00 AM to 11:59 AM | 169 (3.7%) | 61 (1.6%) |
| 12:00 PM to 3:59 PM | 365 (8.0%) | 192 (5.0%) |
| 4:00 PM to 11:59 PM | 338 (7.4%) | 172 (4.4%) |
| Total | 4,559 (100.0%) | 3,877 (100.0%) |
Housing Occupancy in Oxon Hill
Occupancy by Ownership in Oxon Hill
Of the total 7,411 dwellings in Oxon Hill, owner-occupied units account for 4,421 (59.7%), while renter-occupied units make up 2,990 (40.4%).
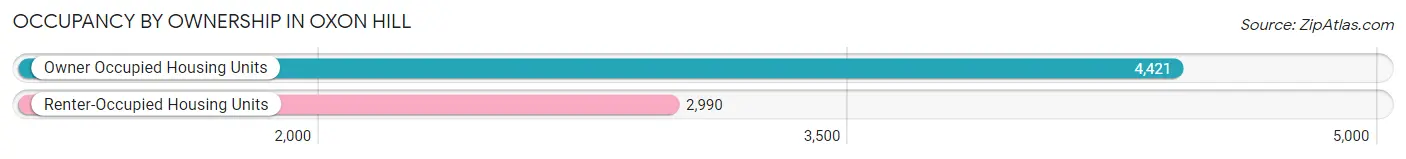
| Occupancy | # Housing Units | % Housing Units |
| Owner Occupied Housing Units | 4,421 | 59.7% |
| Renter-Occupied Housing Units | 2,990 | 40.4% |
| Total Occupied Housing Units | 7,411 | 100.0% |
Occupancy by Household Size in Oxon Hill

| Household Size | # Housing Units | % Housing Units |
| 1-Person Household | 2,708 | 36.5% |
| 2-Person Household | 1,997 | 27.0% |
| 3-Person Household | 1,176 | 15.9% |
| 4+ Person Household | 1,530 | 20.6% |
| Total Housing Units | 7,411 | 100.0% |
Occupancy by Ownership by Household Size in Oxon Hill
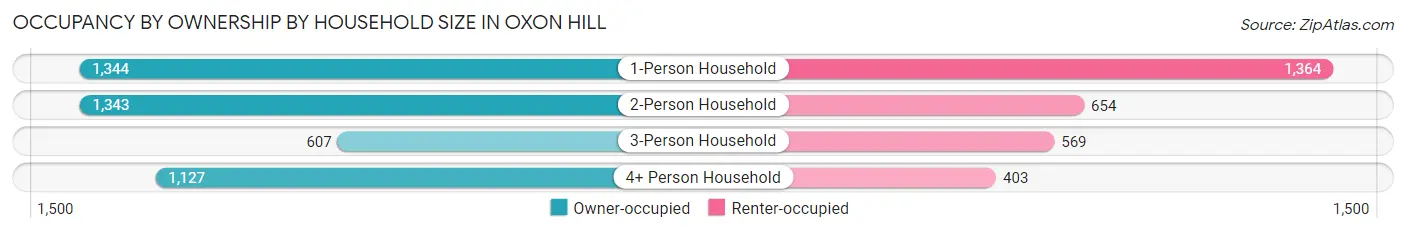
| Household Size | Owner-occupied | Renter-occupied |
| 1-Person Household | 1,344 (49.6%) | 1,364 (50.4%) |
| 2-Person Household | 1,343 (67.2%) | 654 (32.8%) |
| 3-Person Household | 607 (51.6%) | 569 (48.4%) |
| 4+ Person Household | 1,127 (73.7%) | 403 (26.3%) |
| Total Housing Units | 4,421 (59.7%) | 2,990 (40.4%) |
Occupancy by Educational Attainment in Oxon Hill
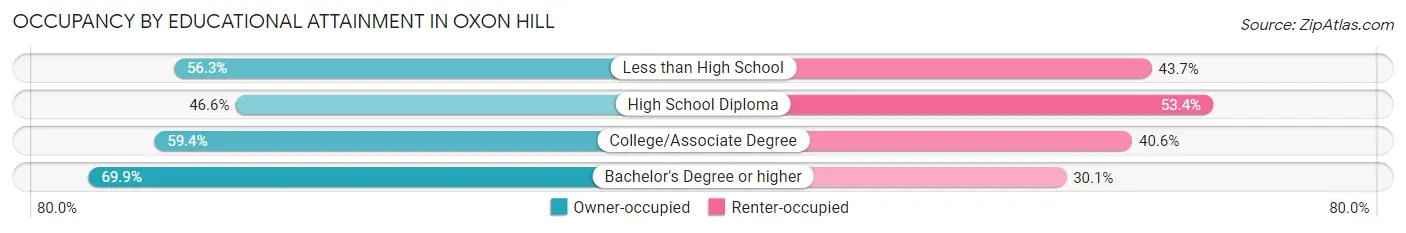
| Household Size | Owner-occupied | Renter-occupied |
| Less than High School | 446 (56.3%) | 346 (43.7%) |
| High School Diploma | 806 (46.6%) | 924 (53.4%) |
| College/Associate Degree | 1,403 (59.4%) | 958 (40.6%) |
| Bachelor's Degree or higher | 1,766 (69.9%) | 762 (30.1%) |
Occupancy by Age of Householder in Oxon Hill
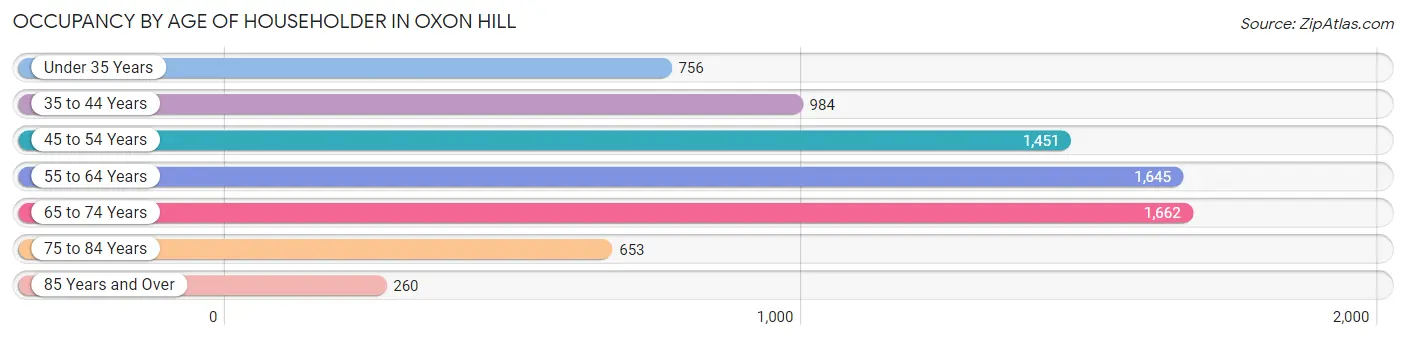
| Age Bracket | # Households | % Households |
| Under 35 Years | 756 | 10.2% |
| 35 to 44 Years | 984 | 13.3% |
| 45 to 54 Years | 1,451 | 19.6% |
| 55 to 64 Years | 1,645 | 22.2% |
| 65 to 74 Years | 1,662 | 22.4% |
| 75 to 84 Years | 653 | 8.8% |
| 85 Years and Over | 260 | 3.5% |
| Total | 7,411 | 100.0% |
Housing Finances in Oxon Hill
Median Income by Occupancy in Oxon Hill
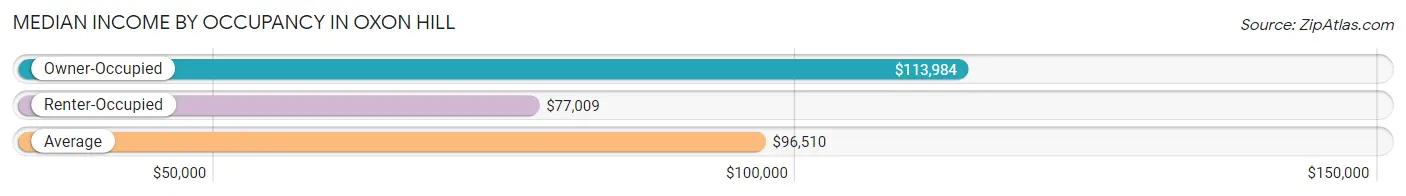
| Occupancy Type | # Households | Median Income |
| Owner-Occupied | 4,421 (59.7%) | $113,984 |
| Renter-Occupied | 2,990 (40.4%) | $77,009 |
| Average | 7,411 (100.0%) | $96,510 |
Occupancy by Householder Income Bracket in Oxon Hill
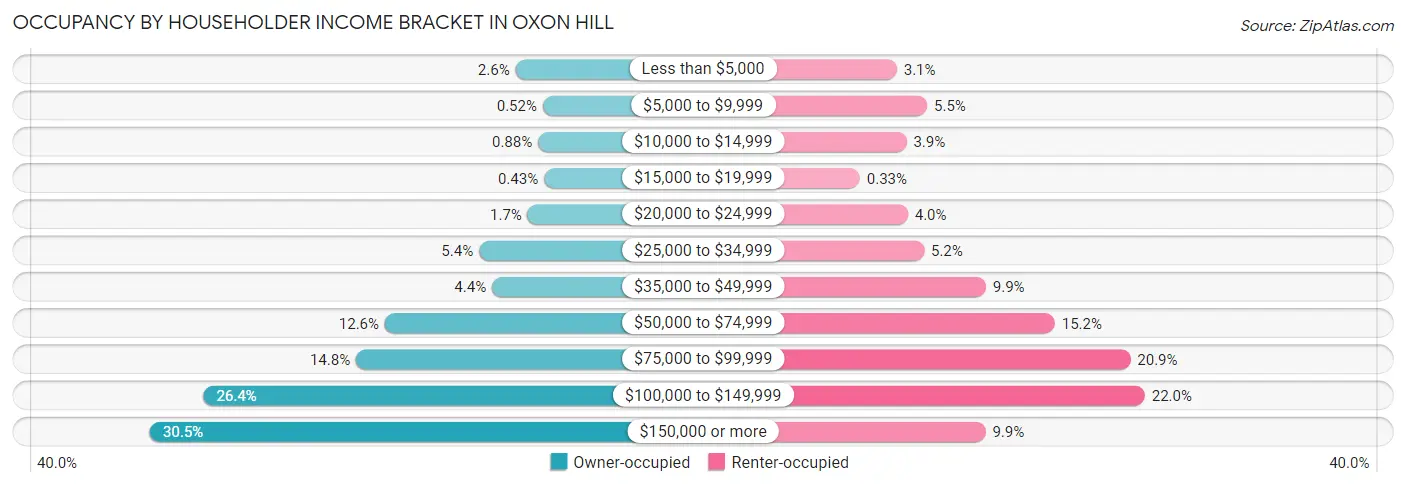
| Income Bracket | Owner-occupied | Renter-occupied |
| Less than $5,000 | 115 (2.6%) | 94 (3.1%) |
| $5,000 to $9,999 | 23 (0.5%) | 163 (5.4%) |
| $10,000 to $14,999 | 39 (0.9%) | 116 (3.9%) |
| $15,000 to $19,999 | 19 (0.4%) | 10 (0.3%) |
| $20,000 to $24,999 | 74 (1.7%) | 119 (4.0%) |
| $25,000 to $34,999 | 238 (5.4%) | 156 (5.2%) |
| $35,000 to $49,999 | 194 (4.4%) | 297 (9.9%) |
| $50,000 to $74,999 | 555 (12.6%) | 454 (15.2%) |
| $75,000 to $99,999 | 652 (14.7%) | 626 (20.9%) |
| $100,000 to $149,999 | 1,166 (26.4%) | 659 (22.0%) |
| $150,000 or more | 1,346 (30.4%) | 296 (9.9%) |
| Total | 4,421 (100.0%) | 2,990 (100.0%) |
Monthly Housing Cost Tiers in Oxon Hill
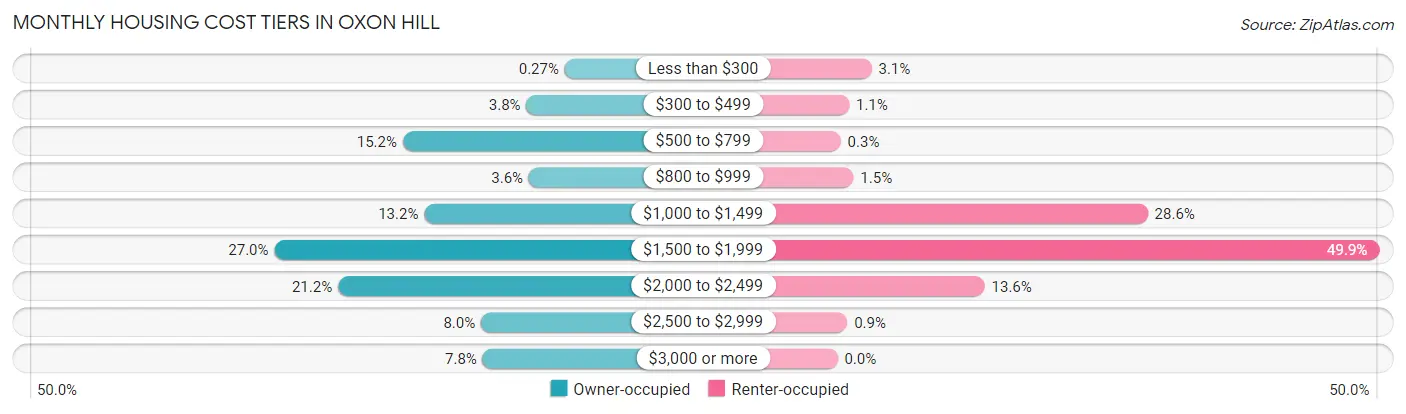
| Monthly Cost | Owner-occupied | Renter-occupied |
| Less than $300 | 12 (0.3%) | 94 (3.1%) |
| $300 to $499 | 168 (3.8%) | 32 (1.1%) |
| $500 to $799 | 671 (15.2%) | 9 (0.3%) |
| $800 to $999 | 158 (3.6%) | 44 (1.5%) |
| $1,000 to $1,499 | 584 (13.2%) | 854 (28.6%) |
| $1,500 to $1,999 | 1,194 (27.0%) | 1,491 (49.9%) |
| $2,000 to $2,499 | 935 (21.1%) | 405 (13.6%) |
| $2,500 to $2,999 | 353 (8.0%) | 27 (0.9%) |
| $3,000 or more | 346 (7.8%) | 0 (0.0%) |
| Total | 4,421 (100.0%) | 2,990 (100.0%) |
Physical Housing Characteristics in Oxon Hill
Housing Structures in Oxon Hill
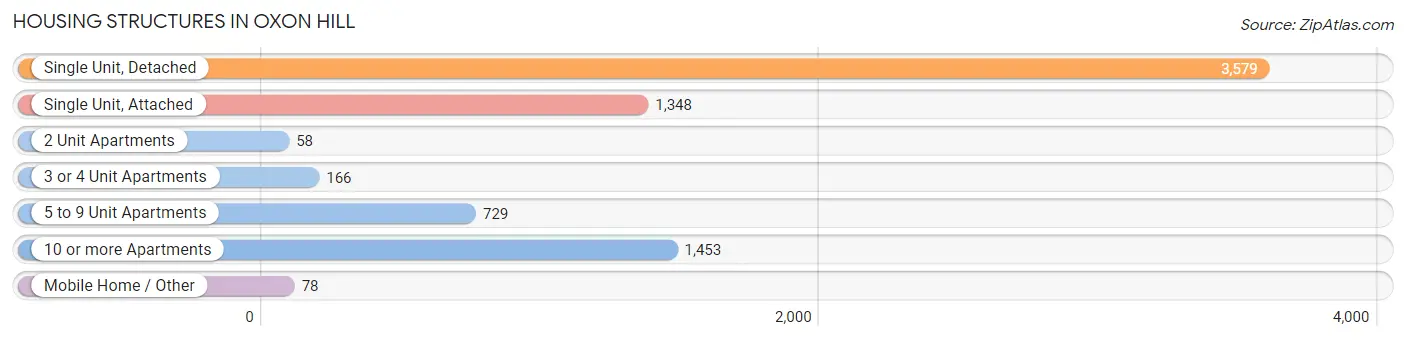
| Structure Type | # Housing Units | % Housing Units |
| Single Unit, Detached | 3,579 | 48.3% |
| Single Unit, Attached | 1,348 | 18.2% |
| 2 Unit Apartments | 58 | 0.8% |
| 3 or 4 Unit Apartments | 166 | 2.2% |
| 5 to 9 Unit Apartments | 729 | 9.8% |
| 10 or more Apartments | 1,453 | 19.6% |
| Mobile Home / Other | 78 | 1.1% |
| Total | 7,411 | 100.0% |
Housing Structures by Occupancy in Oxon Hill
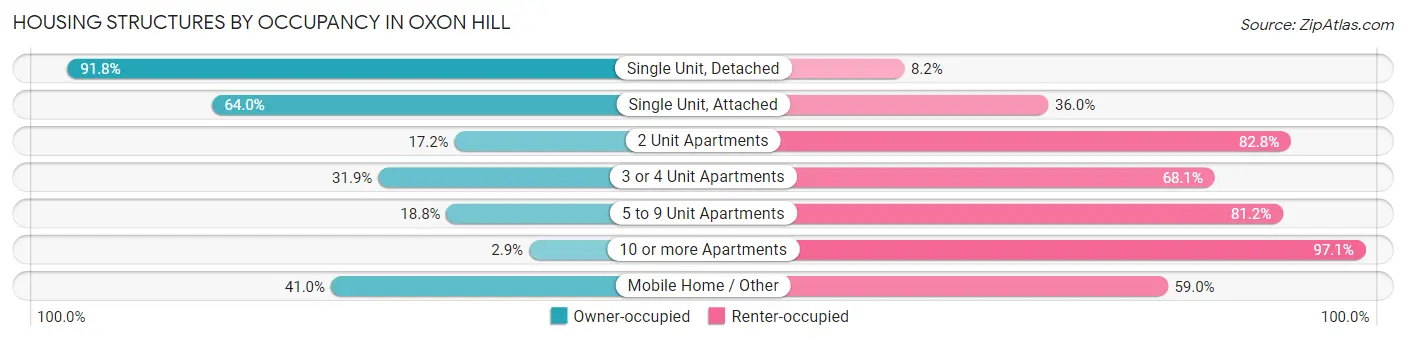
| Structure Type | Owner-occupied | Renter-occupied |
| Single Unit, Detached | 3,284 (91.8%) | 295 (8.2%) |
| Single Unit, Attached | 863 (64.0%) | 485 (36.0%) |
| 2 Unit Apartments | 10 (17.2%) | 48 (82.8%) |
| 3 or 4 Unit Apartments | 53 (31.9%) | 113 (68.1%) |
| 5 to 9 Unit Apartments | 137 (18.8%) | 592 (81.2%) |
| 10 or more Apartments | 42 (2.9%) | 1,411 (97.1%) |
| Mobile Home / Other | 32 (41.0%) | 46 (59.0%) |
| Total | 4,421 (59.7%) | 2,990 (40.4%) |
Housing Structures by Number of Rooms in Oxon Hill
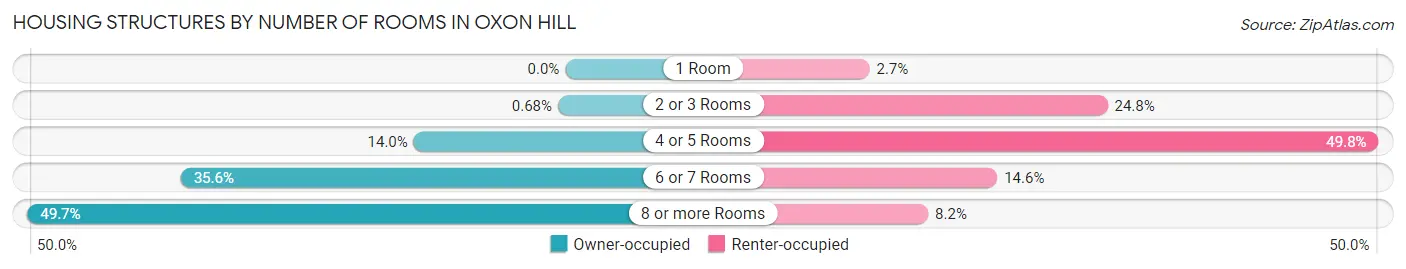
| Number of Rooms | Owner-occupied | Renter-occupied |
| 1 Room | 0 (0.0%) | 82 (2.7%) |
| 2 or 3 Rooms | 30 (0.7%) | 740 (24.7%) |
| 4 or 5 Rooms | 620 (14.0%) | 1,489 (49.8%) |
| 6 or 7 Rooms | 1,572 (35.6%) | 435 (14.5%) |
| 8 or more Rooms | 2,199 (49.7%) | 244 (8.2%) |
| Total | 4,421 (100.0%) | 2,990 (100.0%) |
Housing Structure by Heating Type in Oxon Hill
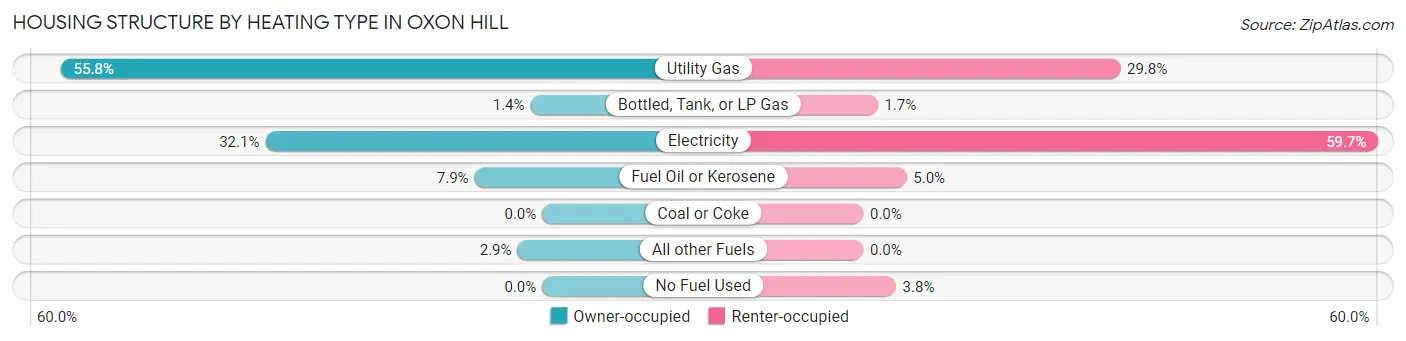
| Heating Type | Owner-occupied | Renter-occupied |
| Utility Gas | 2,468 (55.8%) | 891 (29.8%) |
| Bottled, Tank, or LP Gas | 60 (1.4%) | 50 (1.7%) |
| Electricity | 1,419 (32.1%) | 1,786 (59.7%) |
| Fuel Oil or Kerosene | 347 (7.9%) | 150 (5.0%) |
| Coal or Coke | 0 (0.0%) | 0 (0.0%) |
| All other Fuels | 127 (2.9%) | 0 (0.0%) |
| No Fuel Used | 0 (0.0%) | 113 (3.8%) |
| Total | 4,421 (100.0%) | 2,990 (100.0%) |
Household Vehicle Usage in Oxon Hill
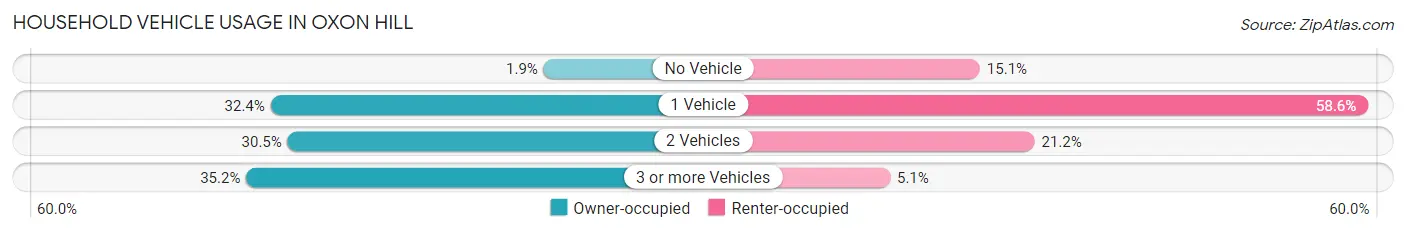
| Vehicles per Household | Owner-occupied | Renter-occupied |
| No Vehicle | 82 (1.8%) | 452 (15.1%) |
| 1 Vehicle | 1,434 (32.4%) | 1,752 (58.6%) |
| 2 Vehicles | 1,350 (30.5%) | 635 (21.2%) |
| 3 or more Vehicles | 1,555 (35.2%) | 151 (5.1%) |
| Total | 4,421 (100.0%) | 2,990 (100.0%) |
Real Estate & Mortgages in Oxon Hill
Real Estate and Mortgage Overview in Oxon Hill
| Characteristic | Without Mortgage | With Mortgage |
| Housing Units | 1,107 | 3,314 |
| Median Property Value | $283,700 | $340,700 |
| Median Household Income | $87,847 | $1,119 |
| Monthly Housing Costs | $711 | $346 |
| Real Estate Taxes | $3,447 | $95 |
Property Value by Mortgage Status in Oxon Hill
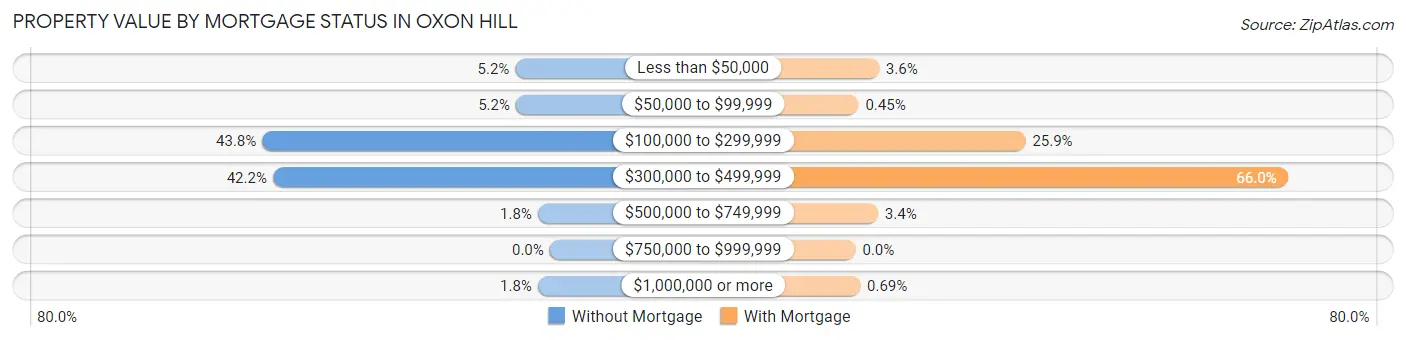
| Property Value | Without Mortgage | With Mortgage |
| Less than $50,000 | 58 (5.2%) | 118 (3.6%) |
| $50,000 to $99,999 | 57 (5.1%) | 15 (0.4%) |
| $100,000 to $299,999 | 485 (43.8%) | 858 (25.9%) |
| $300,000 to $499,999 | 467 (42.2%) | 2,187 (66.0%) |
| $500,000 to $749,999 | 20 (1.8%) | 113 (3.4%) |
| $750,000 to $999,999 | 0 (0.0%) | 0 (0.0%) |
| $1,000,000 or more | 20 (1.8%) | 23 (0.7%) |
| Total | 1,107 (100.0%) | 3,314 (100.0%) |
Household Income by Mortgage Status in Oxon Hill
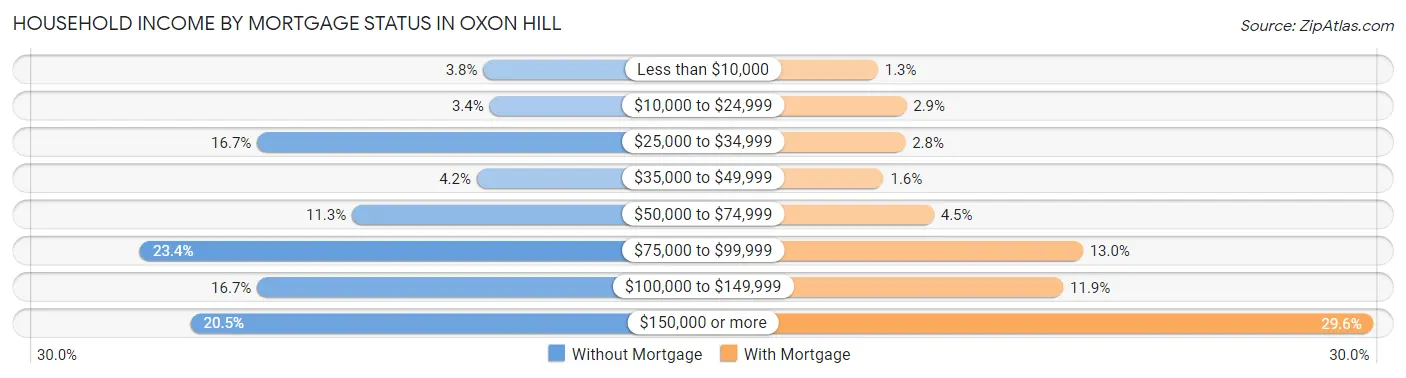
| Household Income | Without Mortgage | With Mortgage |
| Less than $10,000 | 42 (3.8%) | 42 (1.3%) |
| $10,000 to $24,999 | 38 (3.4%) | 96 (2.9%) |
| $25,000 to $34,999 | 185 (16.7%) | 94 (2.8%) |
| $35,000 to $49,999 | 46 (4.2%) | 53 (1.6%) |
| $50,000 to $74,999 | 125 (11.3%) | 148 (4.5%) |
| $75,000 to $99,999 | 259 (23.4%) | 430 (13.0%) |
| $100,000 to $149,999 | 185 (16.7%) | 393 (11.9%) |
| $150,000 or more | 227 (20.5%) | 981 (29.6%) |
| Total | 1,107 (100.0%) | 3,314 (100.0%) |
Property Value to Household Income Ratio in Oxon Hill
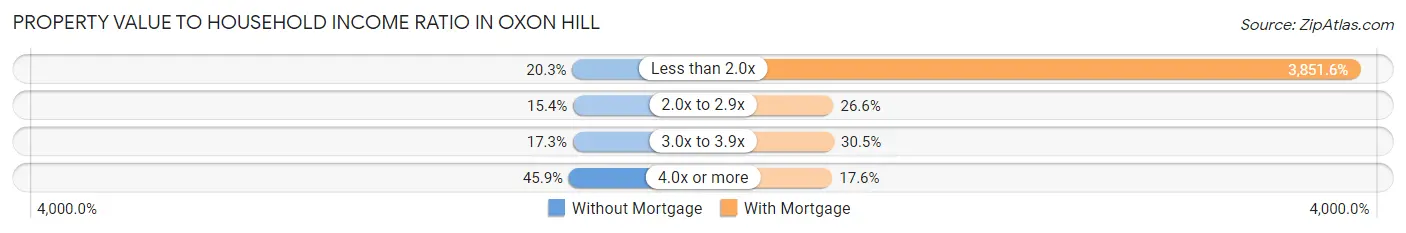
| Value-to-Income Ratio | Without Mortgage | With Mortgage |
| Less than 2.0x | 225 (20.3%) | 127,643 (3,851.6%) |
| 2.0x to 2.9x | 170 (15.4%) | 883 (26.6%) |
| 3.0x to 3.9x | 192 (17.3%) | 1,012 (30.5%) |
| 4.0x or more | 508 (45.9%) | 584 (17.6%) |
| Total | 1,107 (100.0%) | 3,314 (100.0%) |
Real Estate Taxes by Mortgage Status in Oxon Hill
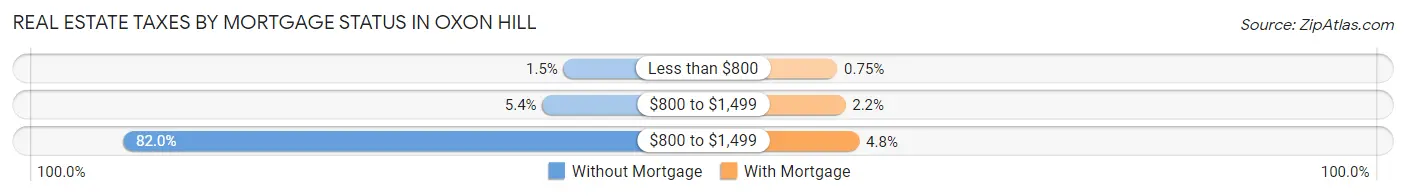
| Property Taxes | Without Mortgage | With Mortgage |
| Less than $800 | 17 (1.5%) | 25 (0.7%) |
| $800 to $1,499 | 60 (5.4%) | 74 (2.2%) |
| $800 to $1,499 | 908 (82.0%) | 158 (4.8%) |
| Total | 1,107 (100.0%) | 3,314 (100.0%) |
Health & Disability in Oxon Hill
Health Insurance Coverage by Age in Oxon Hill
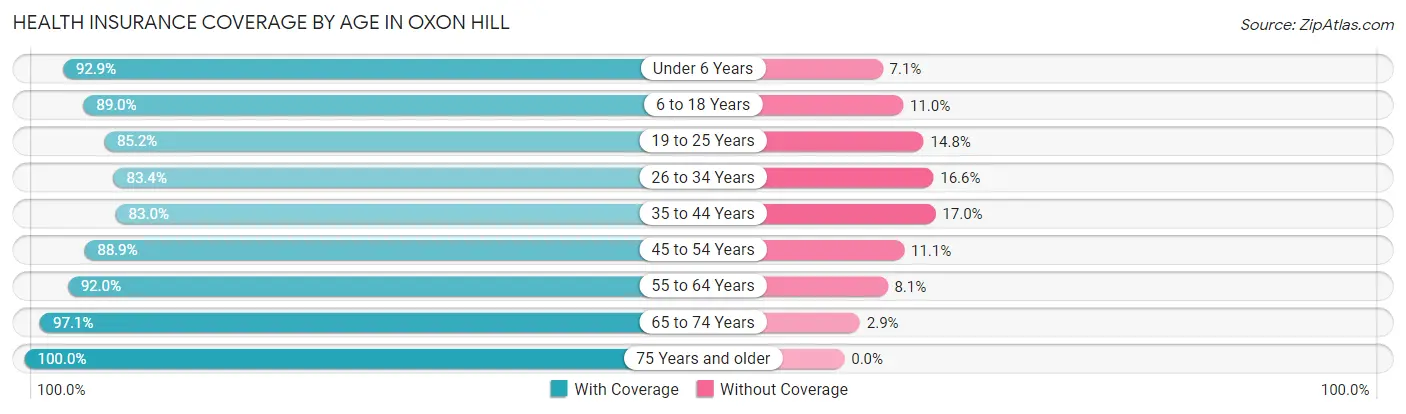
| Age Bracket | With Coverage | Without Coverage |
| Under 6 Years | 1,340 (92.9%) | 103 (7.1%) |
| 6 to 18 Years | 1,876 (89.0%) | 231 (11.0%) |
| 19 to 25 Years | 1,151 (85.2%) | 200 (14.8%) |
| 26 to 34 Years | 1,758 (83.4%) | 350 (16.6%) |
| 35 to 44 Years | 1,920 (83.0%) | 393 (17.0%) |
| 45 to 54 Years | 2,466 (88.9%) | 309 (11.1%) |
| 55 to 64 Years | 2,331 (91.9%) | 204 (8.1%) |
| 65 to 74 Years | 2,344 (97.1%) | 70 (2.9%) |
| 75 Years and older | 1,410 (100.0%) | 0 (0.0%) |
| Total | 16,596 (89.9%) | 1,860 (10.1%) |
Health Insurance Coverage by Citizenship Status in Oxon Hill
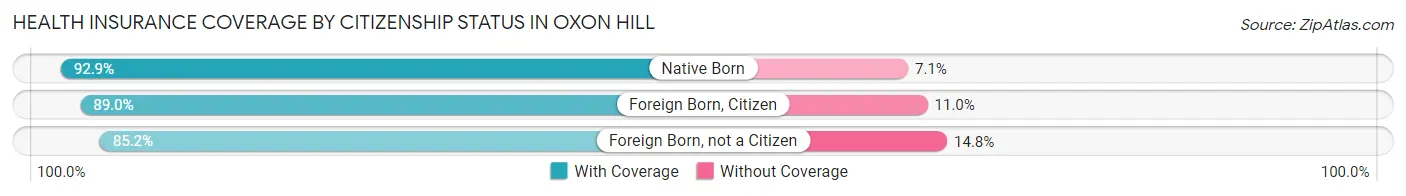
| Citizenship Status | With Coverage | Without Coverage |
| Native Born | 1,340 (92.9%) | 103 (7.1%) |
| Foreign Born, Citizen | 1,876 (89.0%) | 231 (11.0%) |
| Foreign Born, not a Citizen | 1,151 (85.2%) | 200 (14.8%) |
Health Insurance Coverage by Household Income in Oxon Hill
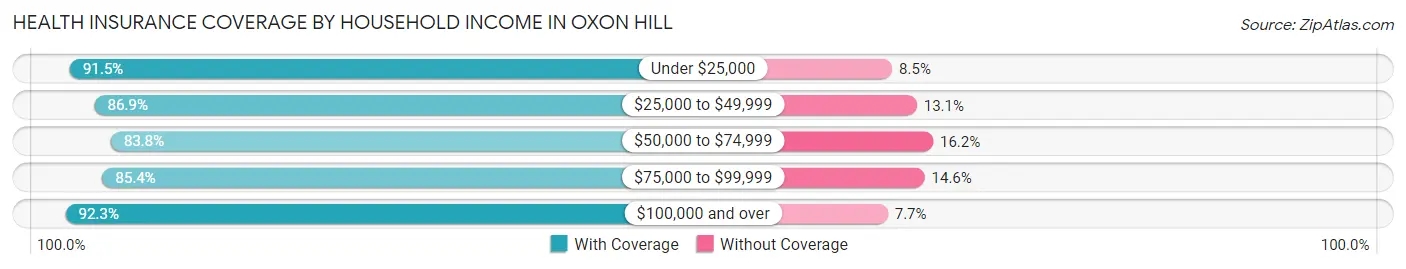
| Household Income | With Coverage | Without Coverage |
| Under $25,000 | 1,216 (91.5%) | 113 (8.5%) |
| $25,000 to $49,999 | 1,398 (86.9%) | 211 (13.1%) |
| $50,000 to $74,999 | 1,650 (83.8%) | 318 (16.2%) |
| $75,000 to $99,999 | 2,209 (85.4%) | 377 (14.6%) |
| $100,000 and over | 10,104 (92.3%) | 841 (7.7%) |
Public vs Private Health Insurance Coverage by Age in Oxon Hill
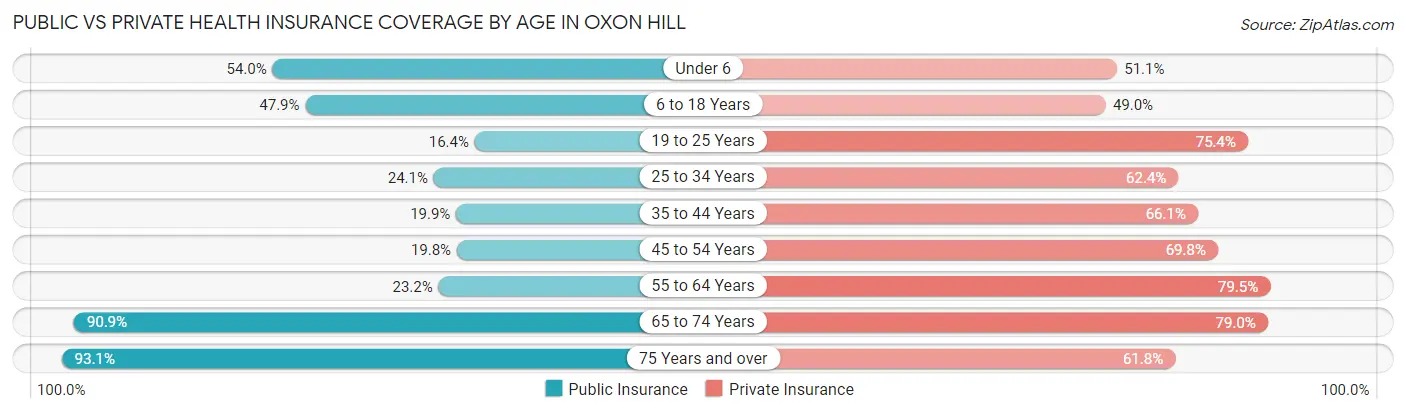
| Age Bracket | Public Insurance | Private Insurance |
| Under 6 | 779 (54.0%) | 738 (51.1%) |
| 6 to 18 Years | 1,009 (47.9%) | 1,033 (49.0%) |
| 19 to 25 Years | 222 (16.4%) | 1,018 (75.3%) |
| 25 to 34 Years | 507 (24.0%) | 1,316 (62.4%) |
| 35 to 44 Years | 460 (19.9%) | 1,528 (66.1%) |
| 45 to 54 Years | 548 (19.8%) | 1,936 (69.8%) |
| 55 to 64 Years | 587 (23.2%) | 2,015 (79.5%) |
| 65 to 74 Years | 2,193 (90.8%) | 1,908 (79.0%) |
| 75 Years and over | 1,313 (93.1%) | 872 (61.8%) |
| Total | 7,618 (41.3%) | 12,364 (67.0%) |
Disability Status by Sex by Age in Oxon Hill
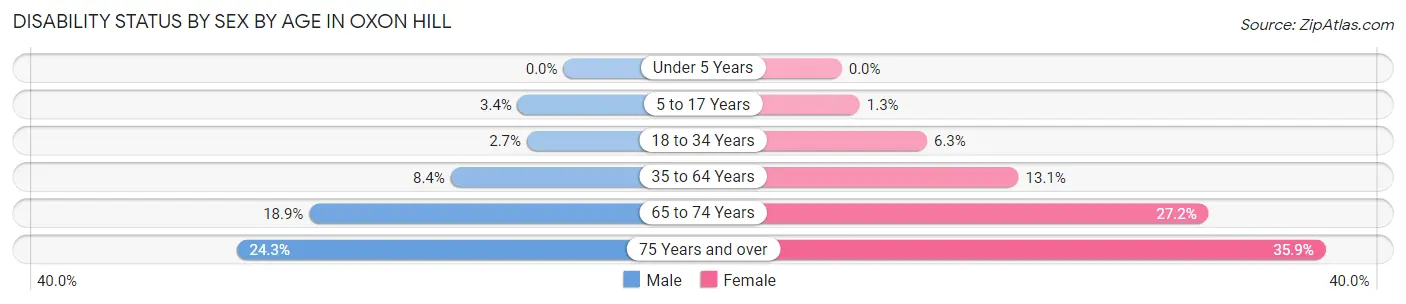
| Age Bracket | Male | Female |
| Under 5 Years | 0 (0.0%) | 0 (0.0%) |
| 5 to 17 Years | 37 (3.4%) | 13 (1.3%) |
| 18 to 34 Years | 45 (2.7%) | 122 (6.3%) |
| 35 to 64 Years | 311 (8.4%) | 513 (13.1%) |
| 65 to 74 Years | 197 (18.9%) | 373 (27.2%) |
| 75 Years and over | 163 (24.3%) | 265 (35.9%) |
Disability Class by Sex by Age in Oxon Hill
Disability Class: Hearing Difficulty
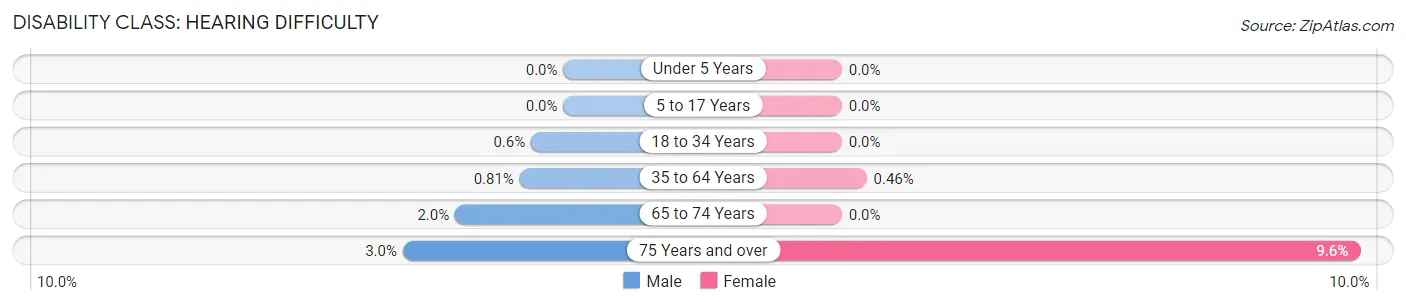
| Age Bracket | Male | Female |
| Under 5 Years | 0 (0.0%) | 0 (0.0%) |
| 5 to 17 Years | 0 (0.0%) | 0 (0.0%) |
| 18 to 34 Years | 10 (0.6%) | 0 (0.0%) |
| 35 to 64 Years | 30 (0.8%) | 18 (0.5%) |
| 65 to 74 Years | 21 (2.0%) | 0 (0.0%) |
| 75 Years and over | 20 (3.0%) | 71 (9.6%) |
Disability Class: Vision Difficulty
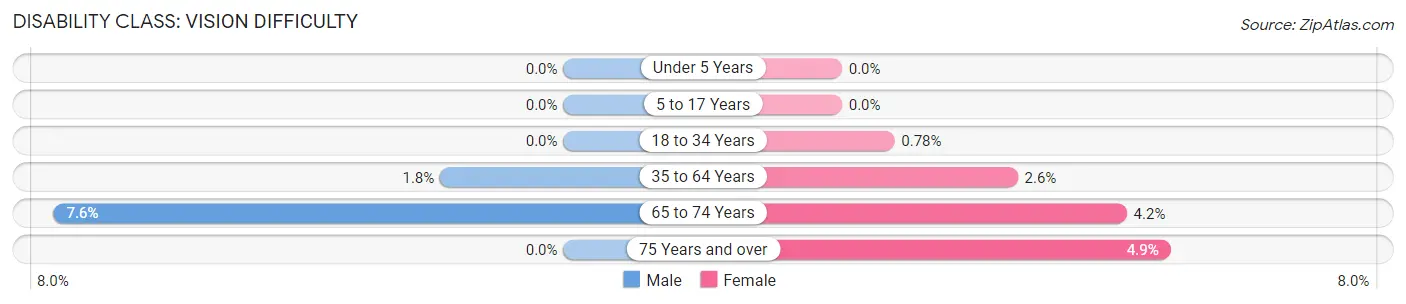
| Age Bracket | Male | Female |
| Under 5 Years | 0 (0.0%) | 0 (0.0%) |
| 5 to 17 Years | 0 (0.0%) | 0 (0.0%) |
| 18 to 34 Years | 0 (0.0%) | 15 (0.8%) |
| 35 to 64 Years | 68 (1.8%) | 102 (2.6%) |
| 65 to 74 Years | 79 (7.6%) | 58 (4.2%) |
| 75 Years and over | 0 (0.0%) | 36 (4.9%) |
Disability Class: Cognitive Difficulty
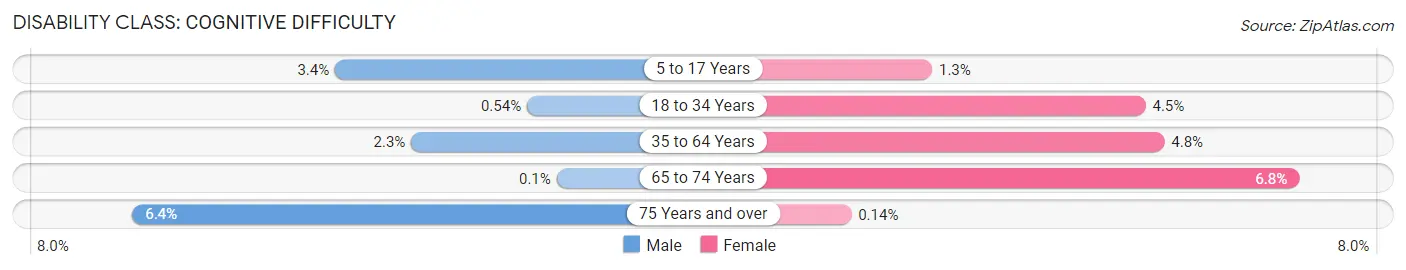
| Age Bracket | Male | Female |
| 5 to 17 Years | 37 (3.4%) | 13 (1.3%) |
| 18 to 34 Years | 9 (0.5%) | 87 (4.5%) |
| 35 to 64 Years | 84 (2.3%) | 187 (4.8%) |
| 65 to 74 Years | 1 (0.1%) | 93 (6.8%) |
| 75 Years and over | 43 (6.4%) | 1 (0.1%) |
Disability Class: Ambulatory Difficulty
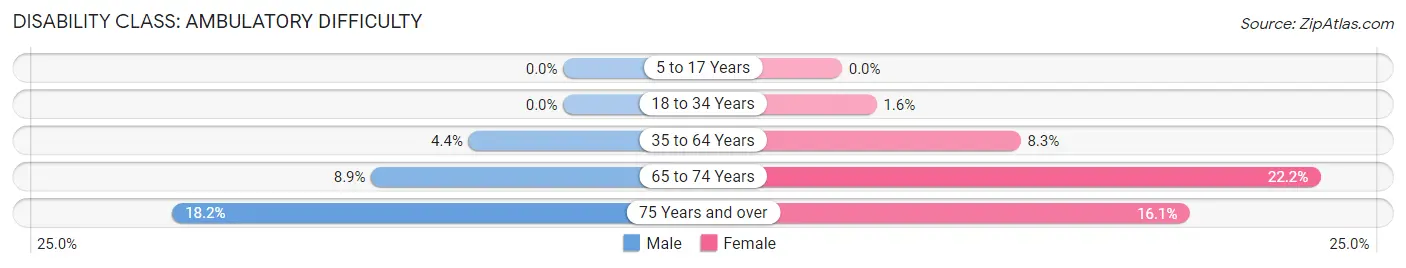
| Age Bracket | Male | Female |
| 5 to 17 Years | 0 (0.0%) | 0 (0.0%) |
| 18 to 34 Years | 0 (0.0%) | 31 (1.6%) |
| 35 to 64 Years | 163 (4.4%) | 324 (8.3%) |
| 65 to 74 Years | 93 (8.9%) | 304 (22.2%) |
| 75 Years and over | 122 (18.1%) | 119 (16.1%) |
Disability Class: Self-Care Difficulty
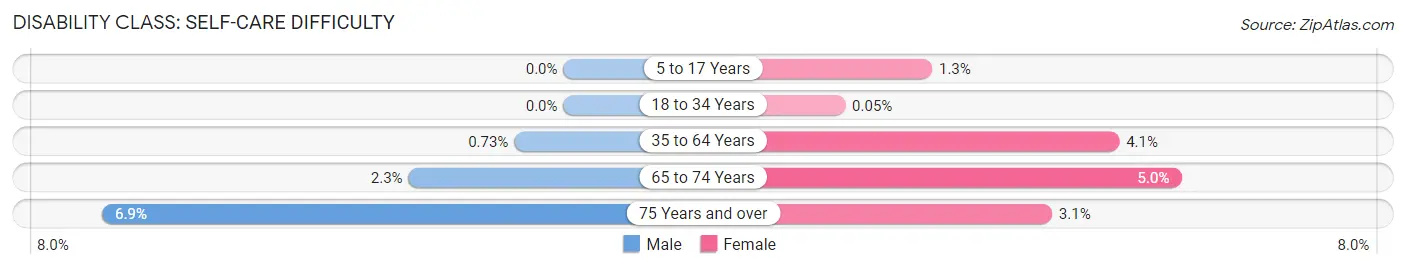
| Age Bracket | Male | Female |
| 5 to 17 Years | 0 (0.0%) | 13 (1.3%) |
| 18 to 34 Years | 0 (0.0%) | 1 (0.1%) |
| 35 to 64 Years | 27 (0.7%) | 161 (4.1%) |
| 65 to 74 Years | 24 (2.3%) | 69 (5.0%) |
| 75 Years and over | 46 (6.9%) | 23 (3.1%) |
Technology Access in Oxon Hill
Computing Device Access in Oxon Hill
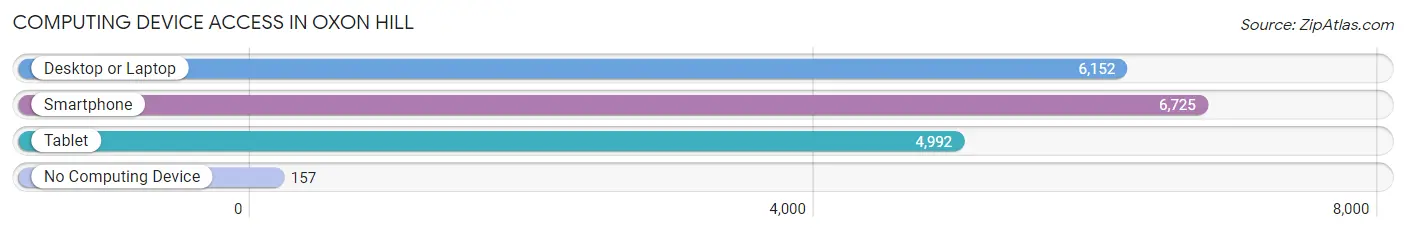
| Device Type | # Households | % Households |
| Desktop or Laptop | 6,152 | 83.0% |
| Smartphone | 6,725 | 90.7% |
| Tablet | 4,992 | 67.4% |
| No Computing Device | 157 | 2.1% |
| Total | 7,411 | 100.0% |
Internet Access in Oxon Hill
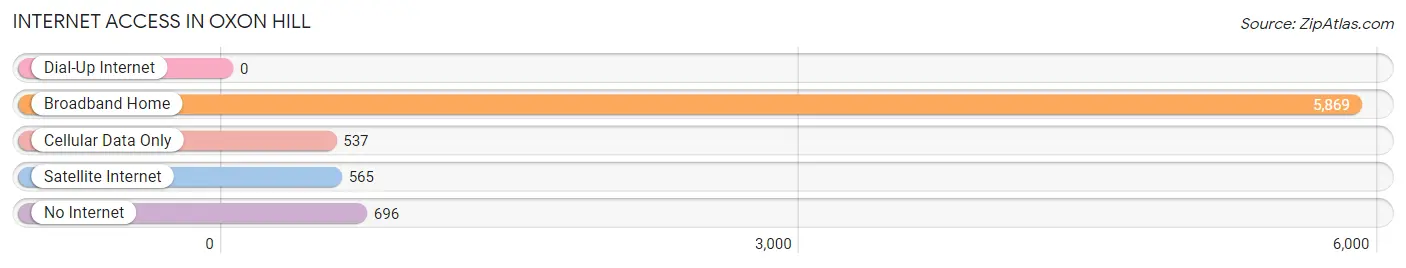
| Internet Type | # Households | % Households |
| Dial-Up Internet | 0 | 0.0% |
| Broadband Home | 5,869 | 79.2% |
| Cellular Data Only | 537 | 7.2% |
| Satellite Internet | 565 | 7.6% |
| No Internet | 696 | 9.4% |
| Total | 7,411 | 100.0% |
Oxon Hill Summary
Oxon Hill is a census-designated place (CDP) located in Prince George’s County, Maryland, United States. It is located just south of Washington, D.C. and is part of the Washington metropolitan area. As of the 2010 census, the population of Oxon Hill was 17,722.
History
The area now known as Oxon Hill was first settled in the early 1700s by the Piscataway tribe of Native Americans. The area was later settled by European colonists in the late 1700s. The area was originally known as “Hunting Creek Warehouse” and was a port for tobacco and other goods. In the early 1800s, the area was renamed “Oxon Hill” after the manor of Thomas Addison, who owned a large estate in the area.
In the late 1800s, the area began to develop as a residential community. The area was annexed by the City of Washington in 1871 and was later annexed by Prince George’s County in 1895. In the early 1900s, the area began to develop as a suburban community. The area was served by the Washington, Baltimore and Annapolis Electric Railway, which provided transportation to Washington, D.C. and Baltimore.
Geography
Oxon Hill is located at 38°48'17" North, 76°57'45" West (38.804722, -76.962500). According to the United States Census Bureau, the CDP has a total area of 4.2 square miles (10.8 km2), all of it land.
Economy
Oxon Hill is home to several major employers, including the National Harbor, a large waterfront development that includes hotels, restaurants, shops, and entertainment venues. The area is also home to the Gaylord National Resort and Convention Center, which is the largest hotel and convention center on the East Coast. The area is also home to the Tanger Outlets, a large outlet mall.
Demographics
As of the 2010 census, there were 17,722 people, 6,945 households, and 4,541 families residing in the CDP. The population density was 4,213.3 people per square mile (1,621.7/km2). There were 7,541 housing units at an average density of 1,811.3 per square mile (699.3/km2). The racial makeup of the CDP was 33.2% White, 44.2% African American, 0.4% Native American, 11.2% Asian, 0.1% Pacific Islander, 6.7% from other races, and 4.2% from two or more races. Hispanic or Latino of any race were 14.2% of the population.
There were 6,945 households, out of which 33.2% had children under the age of 18 living with them, 39.2% were married couples living together, 19.7% had a female householder with no husband present, and 33.7% were non-families. 25.7% of all households were made up of individuals, and 6.2% had someone living alone who was 65 years of age or older. The average household size was 2.54 and the average family size was 3.08.
In the CDP, the population was spread out, with 25.2% under the age of 18, 9.2% from 18 to 24, 33.2% from 25 to 44, 22.7% from 45 to 64, and 9.7% who were 65 years of age or older. The median age was 34 years. For every 100 females, there were 91.2 males. For every 100 females age 18 and over, there were 87.7 males.
The median income for a household in the CDP was $50,945, and the median income for a family was $56,945. Males had a median income of $37,945 versus $32,945 for females. The per capita income for the CDP was $23,945. About 8.2% of families and 10.2% of the population were below the poverty line, including 14.2% of those under age 18 and 8.2% of those age 65 or over.
Common Questions
What is Per Capita Income in Oxon Hill?
Per Capita income in Oxon Hill is $44,670.
What is the Median Family Income in Oxon Hill?
Median Family Income in Oxon Hill is $112,031.
What is the Median Household income in Oxon Hill?
Median Household Income in Oxon Hill is $96,510.
What is Income or Wage Gap in Oxon Hill?
Income or Wage Gap in Oxon Hill is 9.2%.
Women in Oxon Hill earn 90.8 cents for every dollar earned by a man.
What is Inequality or Gini Index in Oxon Hill?
Inequality or Gini Index in Oxon Hill is 0.38.
What is the Total Population of Oxon Hill?
Total Population of Oxon Hill is 18,526.
What is the Total Male Population of Oxon Hill?
Total Male Population of Oxon Hill is 8,901.
What is the Total Female Population of Oxon Hill?
Total Female Population of Oxon Hill is 9,625.
What is the Ratio of Males per 100 Females in Oxon Hill?
There are 92.48 Males per 100 Females in Oxon Hill.
What is the Ratio of Females per 100 Males in Oxon Hill?
There are 108.13 Females per 100 Males in Oxon Hill.
What is the Median Population Age in Oxon Hill?
Median Population Age in Oxon Hill is 44.5 Years.
What is the Average Family Size in Oxon Hill
Average Family Size in Oxon Hill is 3.3 People.
What is the Average Household Size in Oxon Hill
Average Household Size in Oxon Hill is 2.5 People.
How Large is the Labor Force in Oxon Hill?
There are 10,730 People in the Labor Forcein in Oxon Hill.
What is the Percentage of People in the Labor Force in Oxon Hill?
69.3% of People are in the Labor Force in Oxon Hill.
What is the Unemployment Rate in Oxon Hill?
Unemployment Rate in Oxon Hill is 7.1%.