Oakland, MD Map & Demographics
Oakland Map
Oakland Overview
$35,092
PER CAPITA INCOME
$78,661
AVG FAMILY INCOME
$61,568
AVG HOUSEHOLD INCOME
5.7%
WAGE / INCOME GAP [ % ]
94.3¢/ $1
WAGE / INCOME GAP [ $ ]
$8,470
FAMILY INCOME DEFICIT
0.43
INEQUALITY / GINI INDEX
1,995
TOTAL POPULATION
1,047
MALE POPULATION
948
FEMALE POPULATION
110.44
MALES / 100 FEMALES
90.54
FEMALES / 100 MALES
50.2
MEDIAN AGE
3.0
AVG FAMILY SIZE
2.0
AVG HOUSEHOLD SIZE
880
LABOR FORCE [ PEOPLE ]
51.8%
PERCENT IN LABOR FORCE
2.0%
UNEMPLOYMENT RATE
Oakland Zip Codes
Income in Oakland
Income Overview in Oakland
Per Capita Income in Oakland is $35,092, while median incomes of families and households are $78,661 and $61,568 respectively.
| Characteristic | Number | Measure |
| Per Capita Income | 1,995 | $35,092 |
| Median Family Income | 471 | $78,661 |
| Mean Family Income | 471 | $100,422 |
| Median Household Income | 902 | $61,568 |
| Mean Household Income | 902 | $73,142 |
| Income Deficit | 471 | $8,470 |
| Wage / Income Gap (%) | 1,995 | 5.71% |
| Wage / Income Gap ($) | 1,995 | 94.29¢ per $1 |
| Gini / Inequality Index | 1,995 | 0.43 |
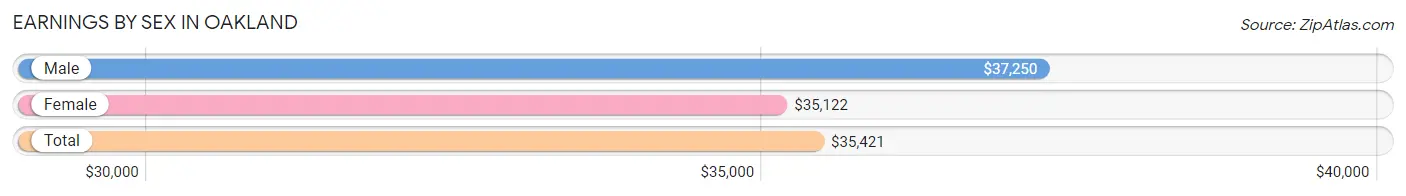
Earnings by Sex in Oakland
Average Earnings in Oakland are $35,421, $37,250 for men and $35,122 for women, a difference of 5.7%.
| Sex | Number | Average Earnings |
| Male | 577 (57.5%) | $37,250 |
| Female | 427 (42.5%) | $35,122 |
| Total | 1,004 (100.0%) | $35,421 |
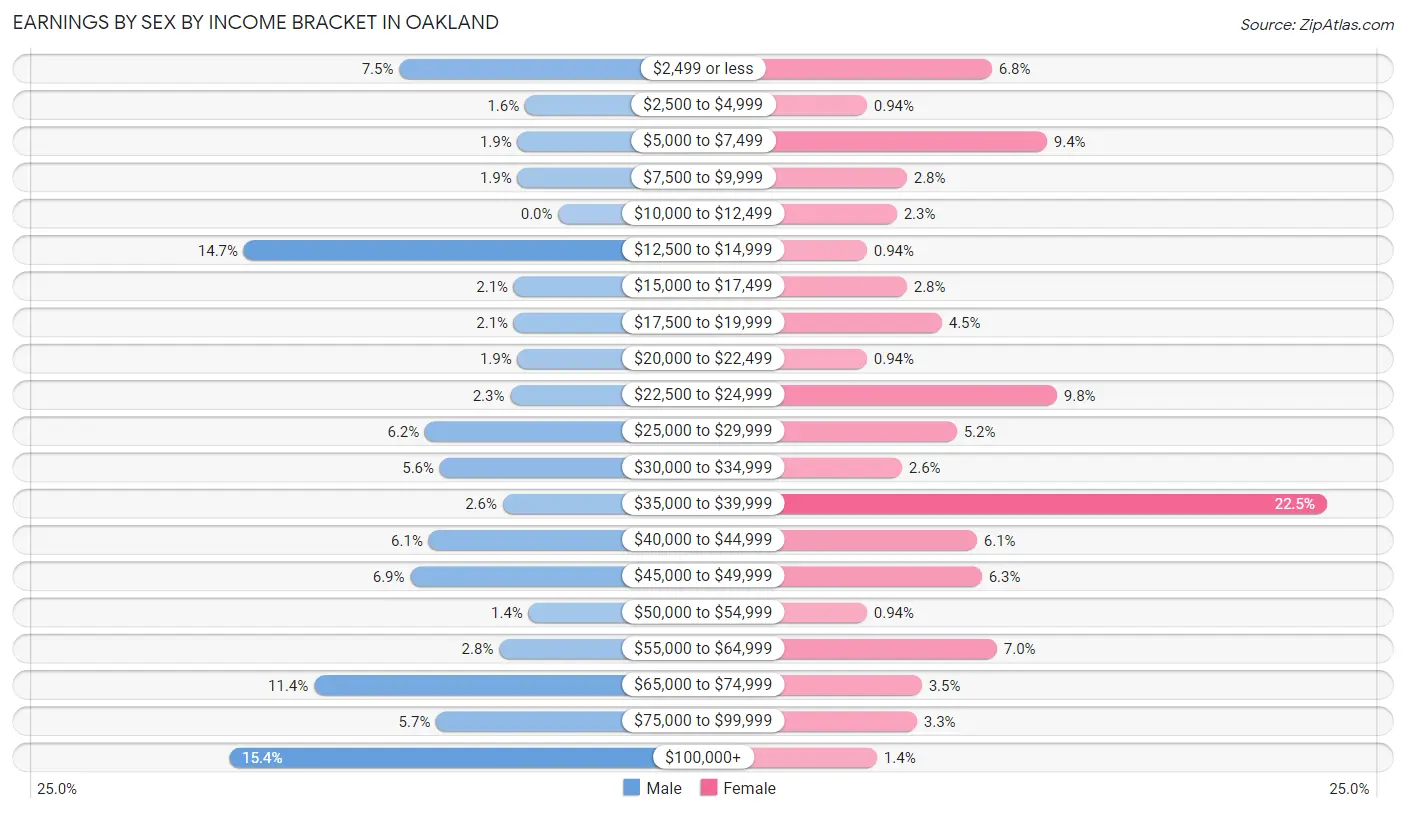
Earnings by Sex by Income Bracket in Oakland
The most common earnings brackets in Oakland are $100,000+ for men (89 | 15.4%) and $35,000 to $39,999 for women (96 | 22.5%).
| Income | Male | Female |
| $2,499 or less | 43 (7.4%) | 29 (6.8%) |
| $2,500 to $4,999 | 9 (1.6%) | 4 (0.9%) |
| $5,000 to $7,499 | 11 (1.9%) | 40 (9.4%) |
| $7,500 to $9,999 | 11 (1.9%) | 12 (2.8%) |
| $10,000 to $12,499 | 0 (0.0%) | 10 (2.3%) |
| $12,500 to $14,999 | 85 (14.7%) | 4 (0.9%) |
| $15,000 to $17,499 | 12 (2.1%) | 12 (2.8%) |
| $17,500 to $19,999 | 12 (2.1%) | 19 (4.4%) |
| $20,000 to $22,499 | 11 (1.9%) | 4 (0.9%) |
| $22,500 to $24,999 | 13 (2.2%) | 42 (9.8%) |
| $25,000 to $29,999 | 36 (6.2%) | 22 (5.1%) |
| $30,000 to $34,999 | 32 (5.6%) | 11 (2.6%) |
| $35,000 to $39,999 | 15 (2.6%) | 96 (22.5%) |
| $40,000 to $44,999 | 35 (6.1%) | 26 (6.1%) |
| $45,000 to $49,999 | 40 (6.9%) | 27 (6.3%) |
| $50,000 to $54,999 | 8 (1.4%) | 4 (0.9%) |
| $55,000 to $64,999 | 16 (2.8%) | 30 (7.0%) |
| $65,000 to $74,999 | 66 (11.4%) | 15 (3.5%) |
| $75,000 to $99,999 | 33 (5.7%) | 14 (3.3%) |
| $100,000+ | 89 (15.4%) | 6 (1.4%) |
| Total | 577 (100.0%) | 427 (100.0%) |
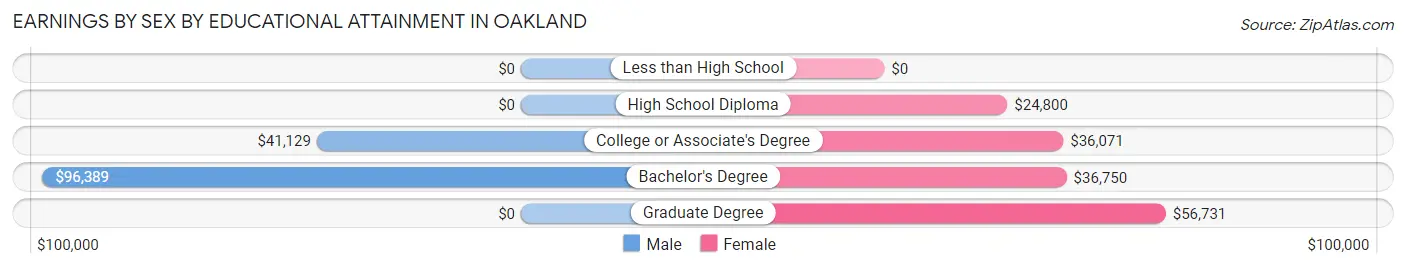
Earnings by Sex by Educational Attainment in Oakland
Average earnings in Oakland are $45,972 for men and $35,394 for women, a difference of 23.0%. Men with an educational attainment of bachelor's degree enjoy the highest average annual earnings of $96,389, while those with college or associate's degree education earn the least with $41,129. Women with an educational attainment of graduate degree earn the most with the average annual earnings of $56,731, while those with high school diploma education have the smallest earnings of $24,800.
| Educational Attainment | Male Income | Female Income |
| Less than High School | - | - |
| High School Diploma | - | - |
| College or Associate's Degree | $41,129 | $36,071 |
| Bachelor's Degree | $96,389 | $36,750 |
| Graduate Degree | - | - |
| Total | $45,972 | $35,394 |
Family Income in Oakland
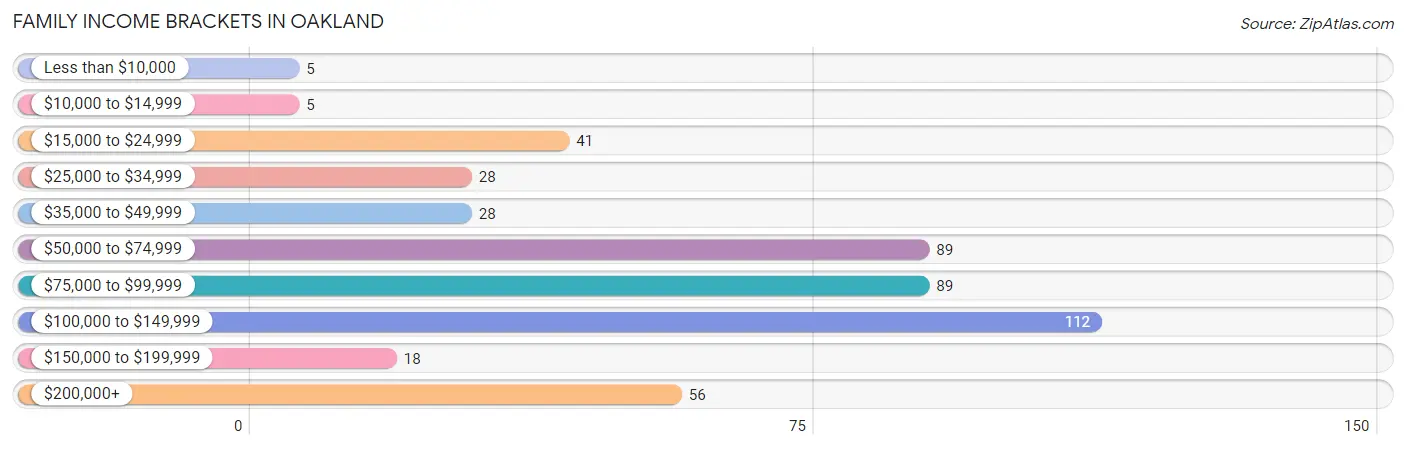
Family Income Brackets in Oakland
According to the Oakland family income data, there are 112 families falling into the $100,000 to $149,999 income range, which is the most common income bracket and makes up 23.8% of all families. Conversely, the less than $10,000 income bracket is the least frequent group with only 5 families (1.1%) belonging to this category.
| Income Bracket | # Families | % Families |
| Less than $10,000 | 5 | 1.1% |
| $10,000 to $14,999 | 5 | 1.1% |
| $15,000 to $24,999 | 41 | 8.7% |
| $25,000 to $34,999 | 28 | 5.9% |
| $35,000 to $49,999 | 28 | 5.9% |
| $50,000 to $74,999 | 89 | 18.9% |
| $75,000 to $99,999 | 89 | 18.9% |
| $100,000 to $149,999 | 112 | 23.8% |
| $150,000 to $199,999 | 18 | 3.8% |
| $200,000+ | 56 | 11.9% |
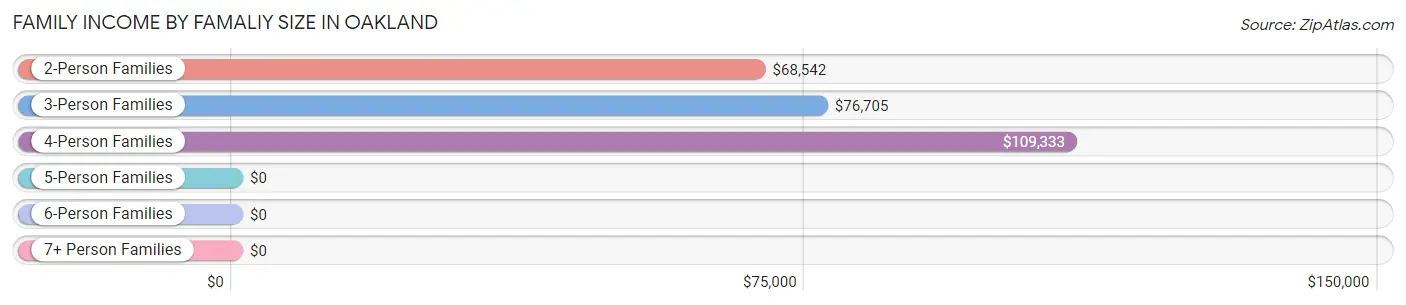
Family Income by Famaliy Size in Oakland
4-person families (128 | 27.2%) account for the highest median family income in Oakland with $109,333 per family, while 2-person families (221 | 46.9%) have the highest median income of $34,271 per family member.
| Income Bracket | # Families | Median Income |
| 2-Person Families | 221 (46.9%) | $68,542 |
| 3-Person Families | 96 (20.4%) | $76,705 |
| 4-Person Families | 128 (27.2%) | $109,333 |
| 5-Person Families | 17 (3.6%) | $0 |
| 6-Person Families | 9 (1.9%) | $0 |
| 7+ Person Families | 0 (0.0%) | $0 |
| Total | 471 (100.0%) | $78,661 |
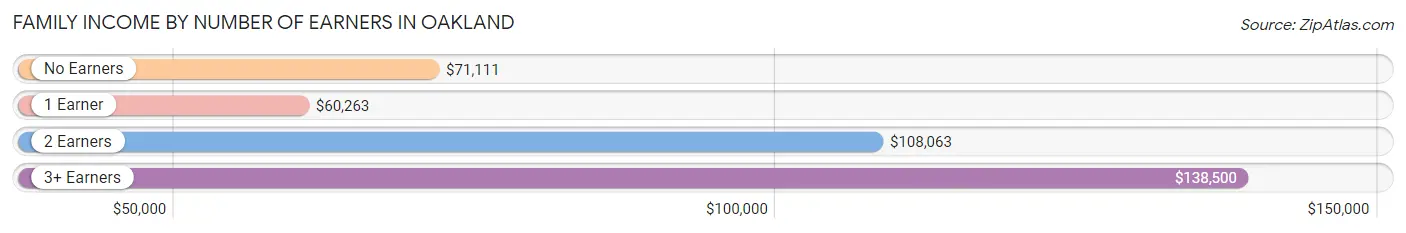
Family Income by Number of Earners in Oakland
The median family income in Oakland is $78,661, with families comprising 3+ earners (38) having the highest median family income of $138,500, while families with 1 earner (156) have the lowest median family income of $60,263, accounting for 8.1% and 33.1% of families, respectively.
| Number of Earners | # Families | Median Income |
| No Earners | 78 (16.6%) | $71,111 |
| 1 Earner | 156 (33.1%) | $60,263 |
| 2 Earners | 199 (42.2%) | $108,063 |
| 3+ Earners | 38 (8.1%) | $138,500 |
| Total | 471 (100.0%) | $78,661 |
Household Income in Oakland
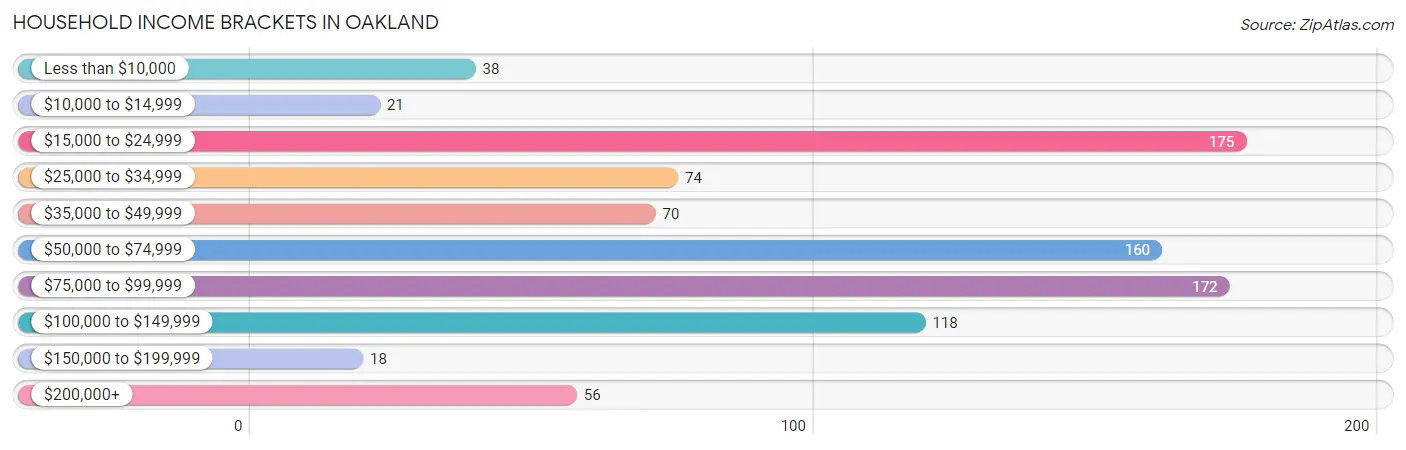
Household Income Brackets in Oakland
With 175 households falling in the category, the $15,000 to $24,999 income range is the most frequent in Oakland, accounting for 19.4% of all households. In contrast, only 18 households (2.0%) fall into the $150,000 to $199,999 income bracket, making it the least populous group.
| Income Bracket | # Households | % Households |
| Less than $10,000 | 38 | 4.2% |
| $10,000 to $14,999 | 21 | 2.3% |
| $15,000 to $24,999 | 175 | 19.4% |
| $25,000 to $34,999 | 74 | 8.2% |
| $35,000 to $49,999 | 70 | 7.8% |
| $50,000 to $74,999 | 160 | 17.7% |
| $75,000 to $99,999 | 172 | 19.1% |
| $100,000 to $149,999 | 118 | 13.1% |
| $150,000 to $199,999 | 18 | 2.0% |
| $200,000+ | 56 | 6.2% |
Household Income by Householder Age in Oakland
The median household income in Oakland is $61,568, with the highest median household income of $75,217 found in the 45 to 64 years age bracket for the primary householder. A total of 266 households (29.5%) fall into this category. Meanwhile, the 15 to 24 years age bracket for the primary householder has the lowest median household income of $0, with 36 households (4.0%) in this group.
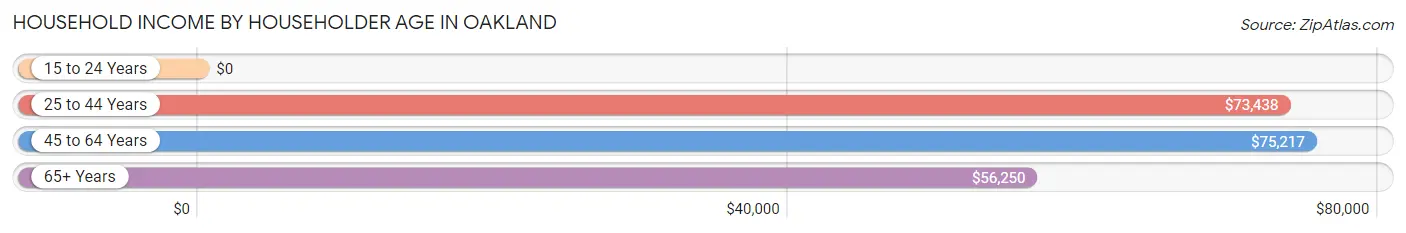
| Income Bracket | # Households | Median Income |
| 15 to 24 Years | 36 (4.0%) | $0 |
| 25 to 44 Years | 202 (22.4%) | $73,438 |
| 45 to 64 Years | 266 (29.5%) | $75,217 |
| 65+ Years | 398 (44.1%) | $56,250 |
| Total | 902 (100.0%) | $61,568 |
Poverty in Oakland
Income Below Poverty by Sex and Age in Oakland
With 11.5% poverty level for males and 13.8% for females among the residents of Oakland, 12 to 14 year old males and 12 to 14 year old females are the most vulnerable to poverty, with 15 males (36.6%) and 13 females (100.0%) in their respective age groups living below the poverty level.
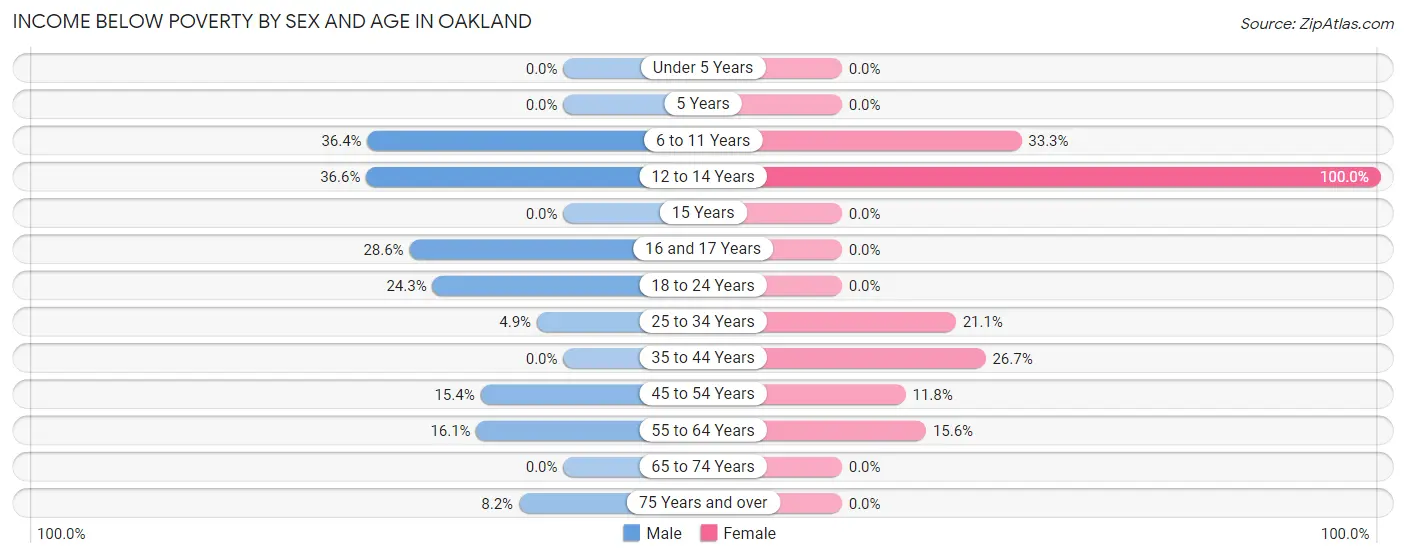
| Age Bracket | Male | Female |
| Under 5 Years | 0 (0.0%) | 0 (0.0%) |
| 5 Years | 0 (0.0%) | 0 (0.0%) |
| 6 to 11 Years | 28 (36.4%) | 9 (33.3%) |
| 12 to 14 Years | 15 (36.6%) | 13 (100.0%) |
| 15 Years | 0 (0.0%) | 0 (0.0%) |
| 16 and 17 Years | 4 (28.6%) | 0 (0.0%) |
| 18 to 24 Years | 17 (24.3%) | 0 (0.0%) |
| 25 to 34 Years | 5 (4.9%) | 37 (21.1%) |
| 35 to 44 Years | 0 (0.0%) | 24 (26.7%) |
| 45 to 54 Years | 18 (15.4%) | 9 (11.8%) |
| 55 to 64 Years | 20 (16.1%) | 30 (15.6%) |
| 65 to 74 Years | 0 (0.0%) | 0 (0.0%) |
| 75 Years and over | 7 (8.2%) | 0 (0.0%) |
| Total | 114 (11.5%) | 122 (13.8%) |
Income Above Poverty by Sex and Age in Oakland
According to the poverty statistics in Oakland, males aged under 5 years and females aged under 5 years are the age groups that are most secure financially, with 100.0% of males and 100.0% of females in these age groups living above the poverty line.
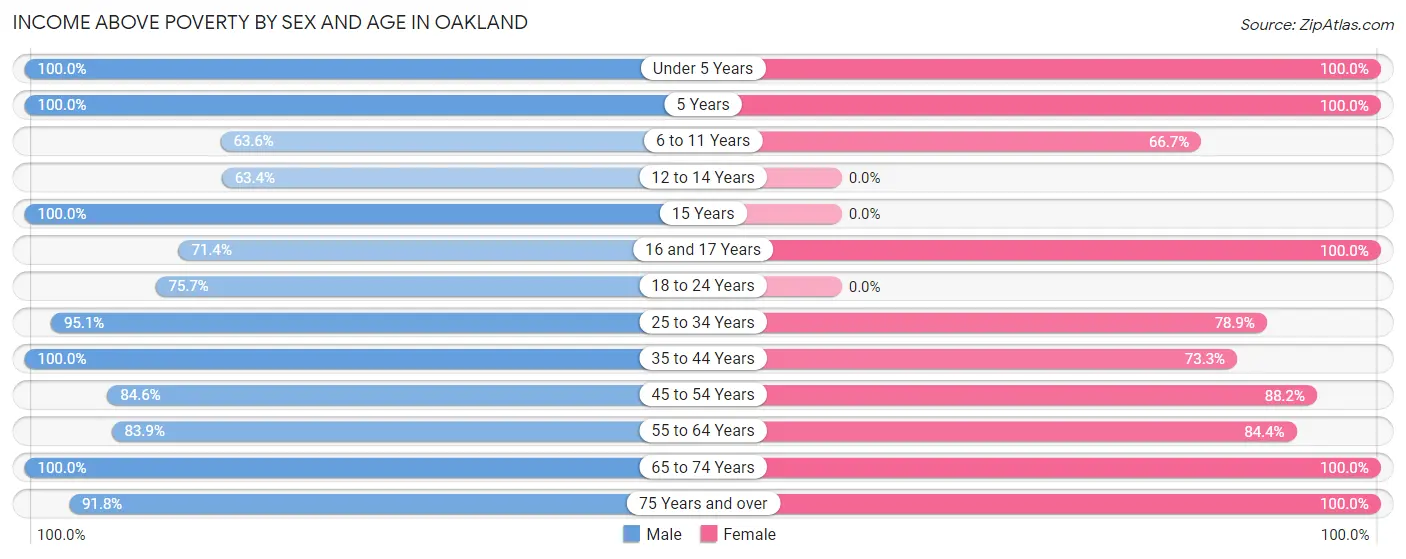
| Age Bracket | Male | Female |
| Under 5 Years | 88 (100.0%) | 17 (100.0%) |
| 5 Years | 6 (100.0%) | 8 (100.0%) |
| 6 to 11 Years | 49 (63.6%) | 18 (66.7%) |
| 12 to 14 Years | 26 (63.4%) | 0 (0.0%) |
| 15 Years | 20 (100.0%) | 0 (0.0%) |
| 16 and 17 Years | 10 (71.4%) | 21 (100.0%) |
| 18 to 24 Years | 53 (75.7%) | 0 (0.0%) |
| 25 to 34 Years | 97 (95.1%) | 138 (78.9%) |
| 35 to 44 Years | 97 (100.0%) | 66 (73.3%) |
| 45 to 54 Years | 99 (84.6%) | 67 (88.2%) |
| 55 to 64 Years | 104 (83.9%) | 162 (84.4%) |
| 65 to 74 Years | 154 (100.0%) | 122 (100.0%) |
| 75 Years and over | 78 (91.8%) | 145 (100.0%) |
| Total | 881 (88.5%) | 764 (86.2%) |
Income Below Poverty Among Married-Couple Families in Oakland
The poverty statistics for married-couple families in Oakland show that 1.9% or 7 of the total 372 families live below the poverty line. Families with 1 or 2 children have the highest poverty rate of 3.0%, comprising of 5 families. On the other hand, families with 3 or 4 children have the lowest poverty rate of 0.0%, which includes 0 families.
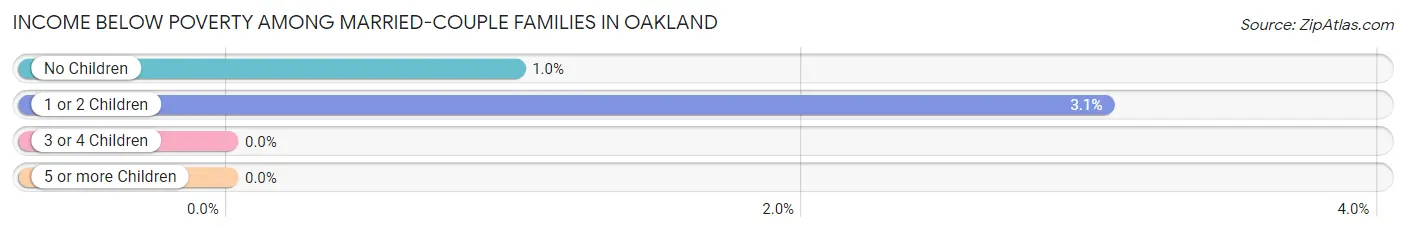
| Children | Above Poverty | Below Poverty |
| No Children | 199 (99.0%) | 2 (1.0%) |
| 1 or 2 Children | 159 (97.0%) | 5 (3.0%) |
| 3 or 4 Children | 7 (100.0%) | 0 (0.0%) |
| 5 or more Children | 0 (0.0%) | 0 (0.0%) |
| Total | 365 (98.1%) | 7 (1.9%) |
Income Below Poverty Among Single-Parent Households in Oakland
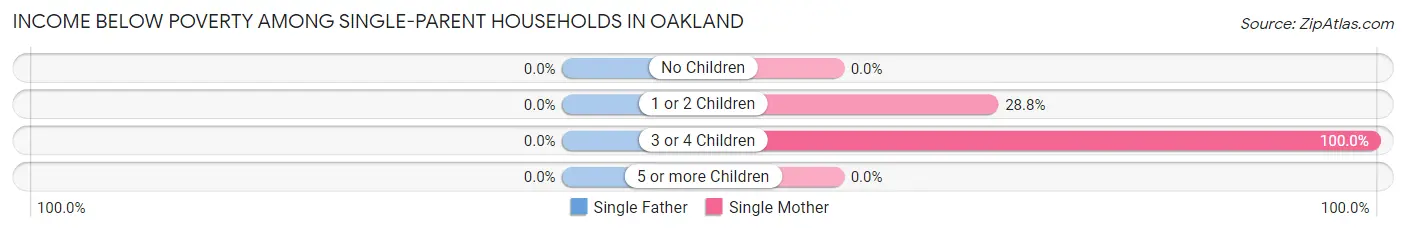
| Children | Single Father | Single Mother |
| No Children | 0 (0.0%) | 0 (0.0%) |
| 1 or 2 Children | 0 (0.0%) | 19 (28.8%) |
| 3 or 4 Children | 0 (0.0%) | 14 (100.0%) |
| 5 or more Children | 0 (0.0%) | 0 (0.0%) |
| Total | 0 (0.0%) | 33 (35.1%) |
Income Below Poverty Among Married-Couple vs Single-Parent Households in Oakland
The poverty data for Oakland shows that 7 of the married-couple family households (1.9%) and 33 of the single-parent households (33.3%) are living below the poverty level. Within the married-couple family households, those with 1 or 2 children have the highest poverty rate, with 5 households (3.0%) falling below the poverty line. Among the single-parent households, those with 3 or 4 children have the highest poverty rate, with 14 household (100.0%) living below poverty.
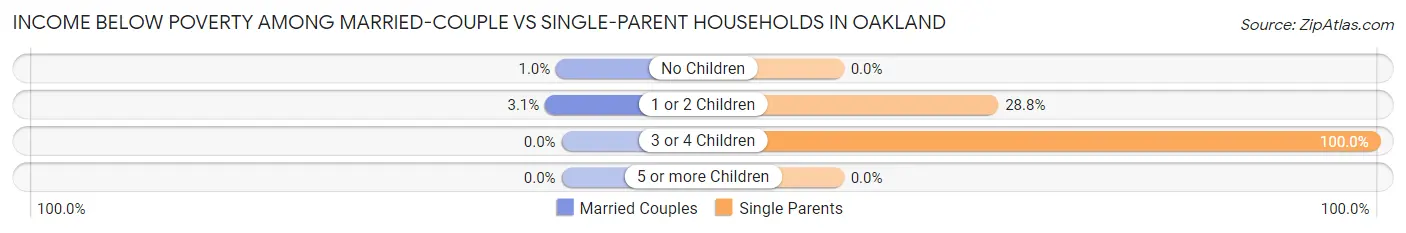
| Children | Married-Couple Families | Single-Parent Households |
| No Children | 2 (1.0%) | 0 (0.0%) |
| 1 or 2 Children | 5 (3.0%) | 19 (28.8%) |
| 3 or 4 Children | 0 (0.0%) | 14 (100.0%) |
| 5 or more Children | 0 (0.0%) | 0 (0.0%) |
| Total | 7 (1.9%) | 33 (33.3%) |
Race in Oakland
The most populous races in Oakland are White / Caucasian (1,895 | 95.0%), Two or more Races (39 | 1.9%), and Hispanic or Latino (33 | 1.7%).
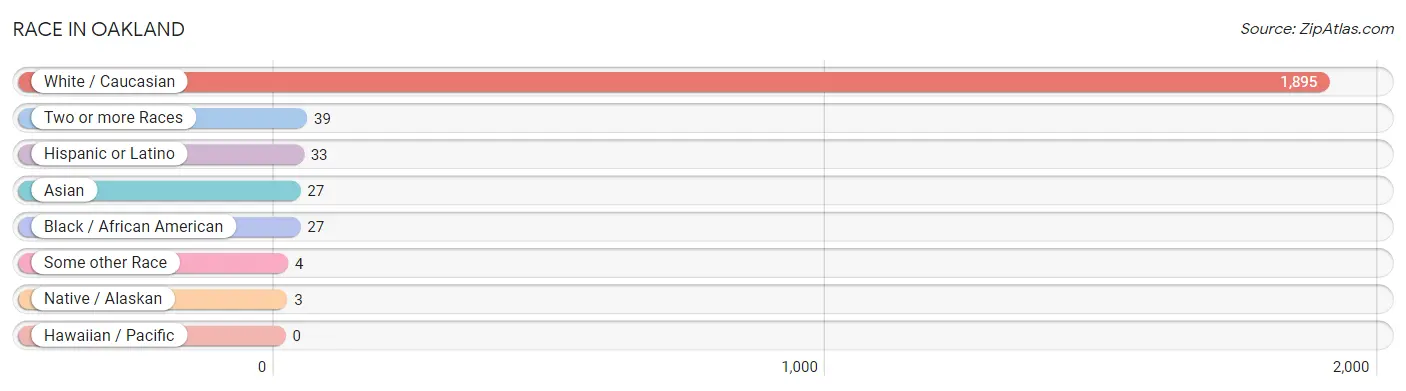
| Race | # Population | % Population |
| Asian | 27 | 1.3% |
| Black / African American | 27 | 1.3% |
| Hawaiian / Pacific | 0 | 0.0% |
| Hispanic or Latino | 33 | 1.7% |
| Native / Alaskan | 3 | 0.2% |
| White / Caucasian | 1,895 | 95.0% |
| Two or more Races | 39 | 1.9% |
| Some other Race | 4 | 0.2% |
| Total | 1,995 | 100.0% |
Ancestry in Oakland
The most populous ancestries reported in Oakland are German (646 | 32.4%), Irish (486 | 24.4%), English (265 | 13.3%), Italian (132 | 6.6%), and Portuguese (128 | 6.4%), together accounting for 83.1% of all Oakland residents.
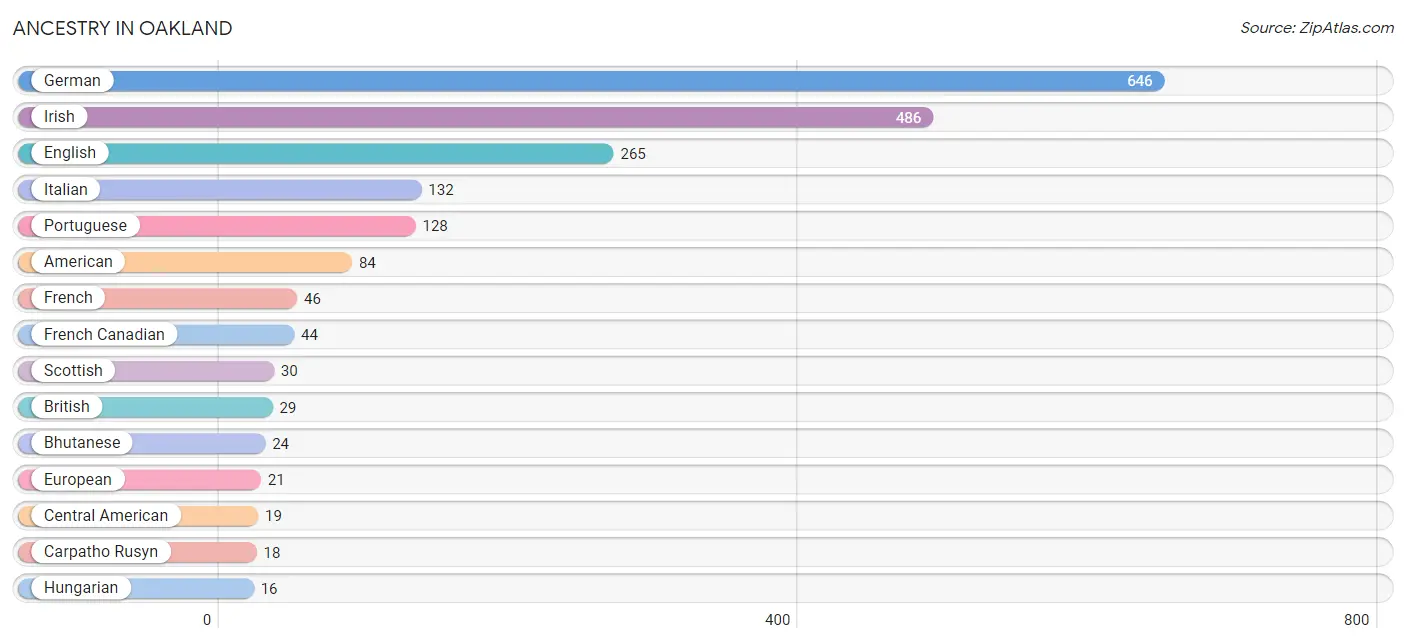
| Ancestry | # Population | % Population |
| African | 6 | 0.3% |
| American | 84 | 4.2% |
| Bhutanese | 24 | 1.2% |
| British | 29 | 1.5% |
| Burmese | 3 | 0.2% |
| Canadian | 5 | 0.3% |
| Carpatho Rusyn | 18 | 0.9% |
| Central American | 19 | 0.9% |
| Cherokee | 3 | 0.2% |
| Czech | 4 | 0.2% |
| Danish | 4 | 0.2% |
| Dutch | 12 | 0.6% |
| English | 265 | 13.3% |
| European | 21 | 1.1% |
| French | 46 | 2.3% |
| French Canadian | 44 | 2.2% |
| German | 646 | 32.4% |
| Guatemalan | 7 | 0.4% |
| Honduran | 12 | 0.6% |
| Hungarian | 16 | 0.8% |
| Irish | 486 | 24.4% |
| Italian | 132 | 6.6% |
| Northern European | 9 | 0.4% |
| Norwegian | 4 | 0.2% |
| Pennsylvania German | 7 | 0.4% |
| Peruvian | 3 | 0.2% |
| Polish | 12 | 0.6% |
| Portuguese | 128 | 6.4% |
| Russian | 2 | 0.1% |
| Scandinavian | 4 | 0.2% |
| Scotch-Irish | 8 | 0.4% |
| Scottish | 30 | 1.5% |
| South American | 3 | 0.2% |
| South American Indian | 11 | 0.5% |
| Subsaharan African | 6 | 0.3% |
| Swedish | 14 | 0.7% |
| Swiss | 11 | 0.5% |
| Welsh | 14 | 0.7% |
| West Indian | 6 | 0.3% | View All 39 Rows |
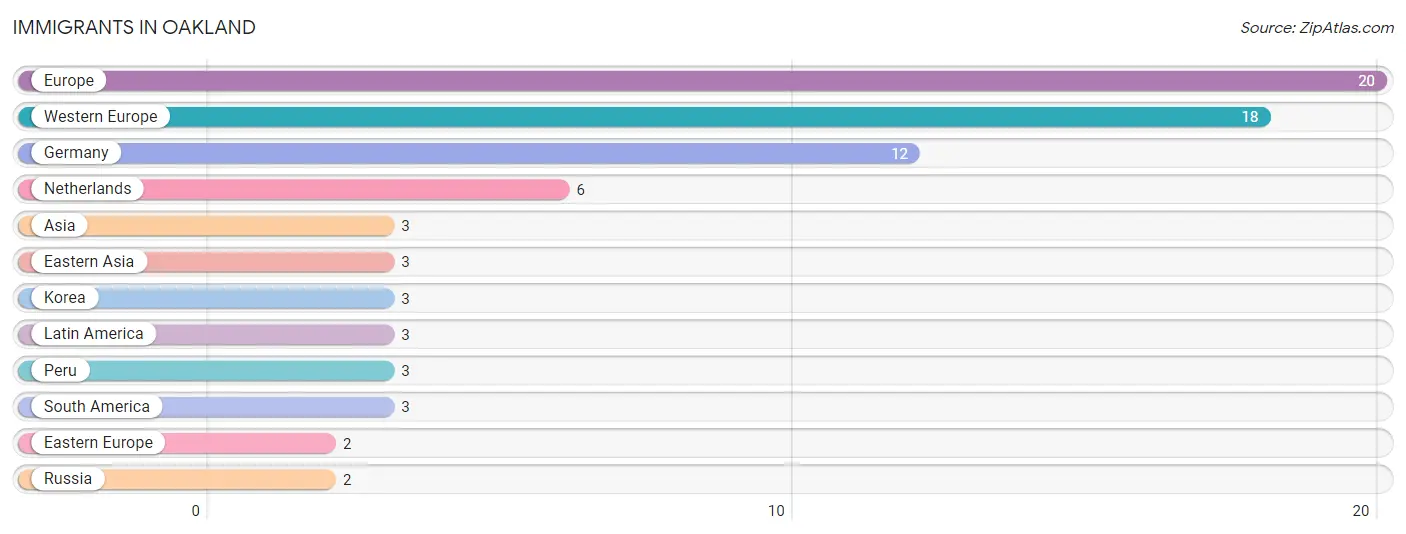
Immigrants in Oakland
The most numerous immigrant groups reported in Oakland came from Europe (20 | 1.0%), Western Europe (18 | 0.9%), Germany (12 | 0.6%), Netherlands (6 | 0.3%), and Asia (3 | 0.2%), together accounting for 3.0% of all Oakland residents.
| Immigration Origin | # Population | % Population |
| Asia | 3 | 0.2% |
| Eastern Asia | 3 | 0.2% |
| Eastern Europe | 2 | 0.1% |
| Europe | 20 | 1.0% |
| Germany | 12 | 0.6% |
| Korea | 3 | 0.2% |
| Latin America | 3 | 0.2% |
| Netherlands | 6 | 0.3% |
| Peru | 3 | 0.2% |
| Russia | 2 | 0.1% |
| South America | 3 | 0.2% |
| Western Europe | 18 | 0.9% | View All 12 Rows |
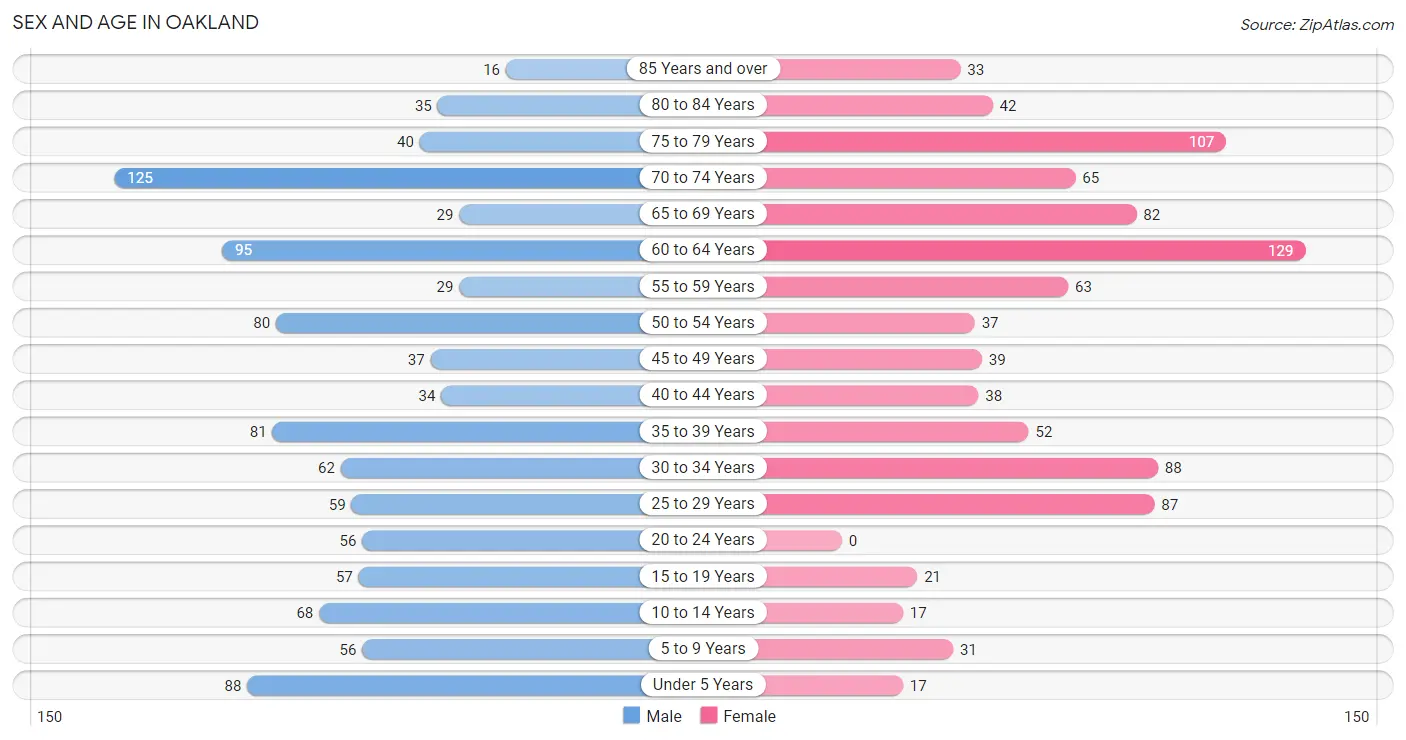
Sex and Age in Oakland
Sex and Age in Oakland
The most populous age groups in Oakland are 70 to 74 Years (125 | 11.9%) for men and 60 to 64 Years (129 | 13.6%) for women.
| Age Bracket | Male | Female |
| Under 5 Years | 88 (8.4%) | 17 (1.8%) |
| 5 to 9 Years | 56 (5.3%) | 31 (3.3%) |
| 10 to 14 Years | 68 (6.5%) | 17 (1.8%) |
| 15 to 19 Years | 57 (5.4%) | 21 (2.2%) |
| 20 to 24 Years | 56 (5.3%) | 0 (0.0%) |
| 25 to 29 Years | 59 (5.6%) | 87 (9.2%) |
| 30 to 34 Years | 62 (5.9%) | 88 (9.3%) |
| 35 to 39 Years | 81 (7.7%) | 52 (5.5%) |
| 40 to 44 Years | 34 (3.3%) | 38 (4.0%) |
| 45 to 49 Years | 37 (3.5%) | 39 (4.1%) |
| 50 to 54 Years | 80 (7.6%) | 37 (3.9%) |
| 55 to 59 Years | 29 (2.8%) | 63 (6.7%) |
| 60 to 64 Years | 95 (9.1%) | 129 (13.6%) |
| 65 to 69 Years | 29 (2.8%) | 82 (8.6%) |
| 70 to 74 Years | 125 (11.9%) | 65 (6.9%) |
| 75 to 79 Years | 40 (3.8%) | 107 (11.3%) |
| 80 to 84 Years | 35 (3.3%) | 42 (4.4%) |
| 85 Years and over | 16 (1.5%) | 33 (3.5%) |
| Total | 1,047 (100.0%) | 948 (100.0%) |
Families and Households in Oakland
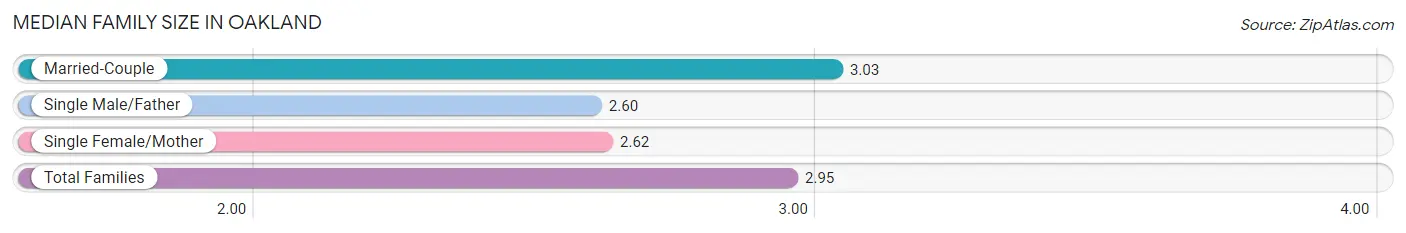
Median Family Size in Oakland
The median family size in Oakland is 2.95 persons per family, with married-couple families (372 | 79.0%) accounting for the largest median family size of 3.03 persons per family. On the other hand, single male/father families (5 | 1.1%) represent the smallest median family size with 2.60 persons per family.
| Family Type | # Families | Family Size |
| Married-Couple | 372 (79.0%) | 3.03 |
| Single Male/Father | 5 (1.1%) | 2.60 |
| Single Female/Mother | 94 (20.0%) | 2.62 |
| Total Families | 471 (100.0%) | 2.95 |
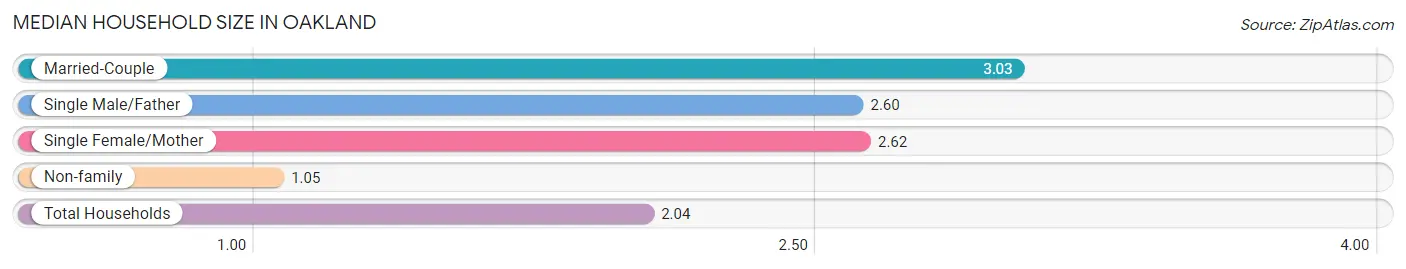
Median Household Size in Oakland
The median household size in Oakland is 2.04 persons per household, with married-couple households (372 | 41.2%) accounting for the largest median household size of 3.03 persons per household. non-family households (431 | 47.8%) represent the smallest median household size with 1.05 persons per household.
| Household Type | # Households | Household Size |
| Married-Couple | 372 (41.2%) | 3.03 |
| Single Male/Father | 5 (0.5%) | 2.60 |
| Single Female/Mother | 94 (10.4%) | 2.62 |
| Non-family | 431 (47.8%) | 1.05 |
| Total Households | 902 (100.0%) | 2.04 |
Household Size by Marriage Status in Oakland
Out of a total of 902 households in Oakland, 471 (52.2%) are family households, while 431 (47.8%) are nonfamily households. The most numerous type of family households are 2-person households, comprising 221, and the most common type of nonfamily households are 1-person households, comprising 391.
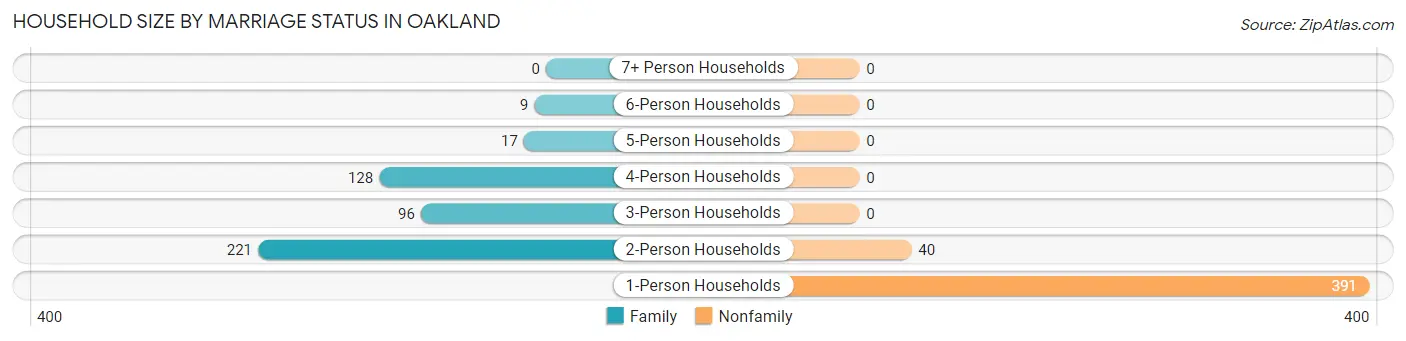
| Household Size | Family Households | Nonfamily Households |
| 1-Person Households | - | 391 (43.3%) |
| 2-Person Households | 221 (24.5%) | 40 (4.4%) |
| 3-Person Households | 96 (10.6%) | 0 (0.0%) |
| 4-Person Households | 128 (14.2%) | 0 (0.0%) |
| 5-Person Households | 17 (1.9%) | 0 (0.0%) |
| 6-Person Households | 9 (1.0%) | 0 (0.0%) |
| 7+ Person Households | 0 (0.0%) | 0 (0.0%) |
| Total | 471 (52.2%) | 431 (47.8%) |
Female Fertility in Oakland
Fertility by Age in Oakland
Average fertility rate in Oakland is 36.0 births per 1,000 women. Women in the age bracket of 20 to 34 years have the highest fertility rate with 40.0 births per 1,000 women. Women in the age bracket of 20 to 34 years acount for 58.3% of all women with births.
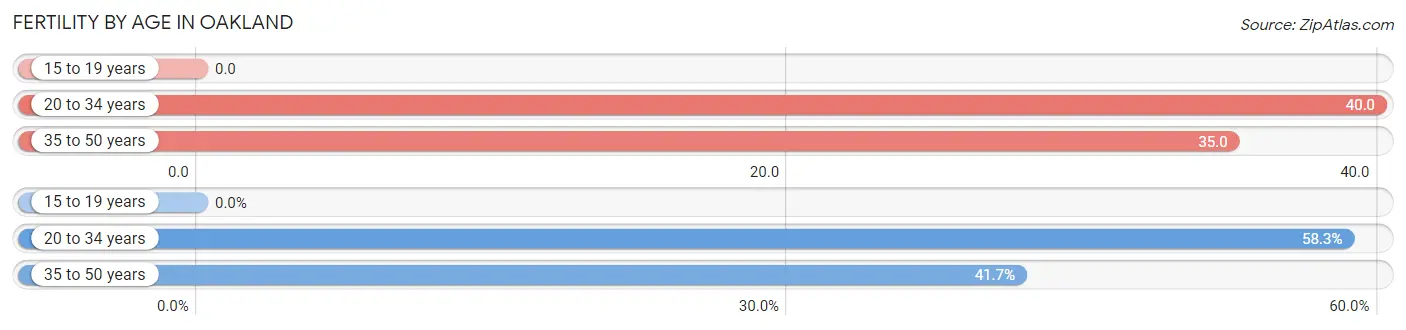
| Age Bracket | Women with Births | Births / 1,000 Women |
| 15 to 19 years | 0 (0.0%) | 0.0 |
| 20 to 34 years | 7 (58.3%) | 40.0 |
| 35 to 50 years | 5 (41.7%) | 35.0 |
| Total | 12 (100.0%) | 36.0 |
Fertility by Age by Marriage Status in Oakland
58.3% of women with births (12) in Oakland are married. The highest percentage of unmarried women with births falls into 35 to 50 years age bracket with 100.0% of them unmarried at the time of birth, while the lowest percentage of unmarried women with births belong to 20 to 34 years age bracket with 0.0% of them unmarried.
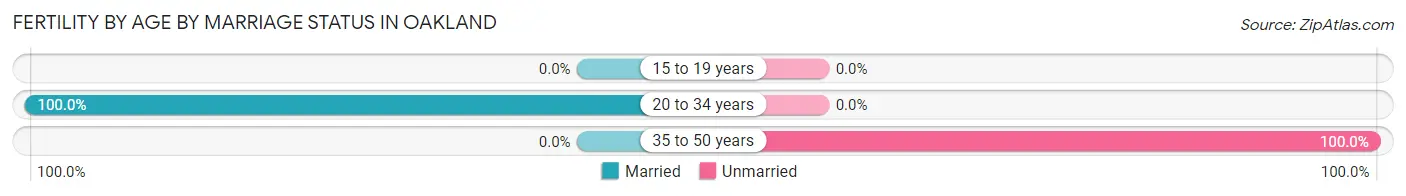
| Age Bracket | Married | Unmarried |
| 15 to 19 years | 0 (0.0%) | 0 (0.0%) |
| 20 to 34 years | 7 (100.0%) | 0 (0.0%) |
| 35 to 50 years | 0 (0.0%) | 5 (100.0%) |
| Total | 7 (58.3%) | 5 (41.7%) |
Fertility by Education in Oakland
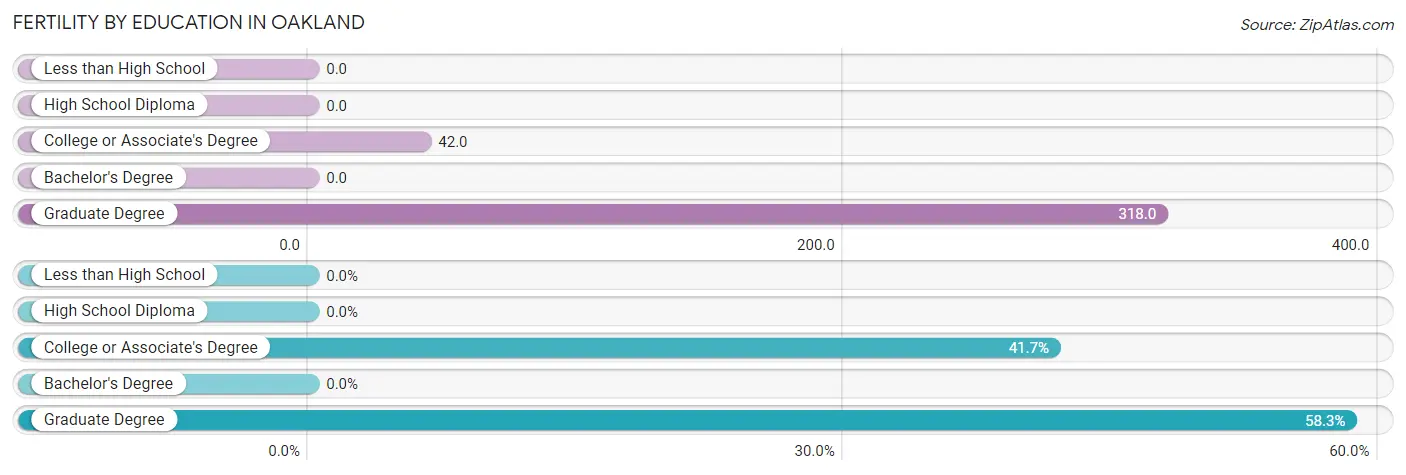
| Educational Attainment | Women with Births | Births / 1,000 Women |
| Less than High School | 0 (0.0%) | 0.0 |
| High School Diploma | 0 (0.0%) | 0.0 |
| College or Associate's Degree | 5 (41.7%) | 42.0 |
| Bachelor's Degree | 0 (0.0%) | 0.0 |
| Graduate Degree | 7 (58.3%) | 318.0 |
| Total | 12 (100.0%) | 36.0 |
Fertility by Education by Marriage Status in Oakland
41.7% of women with births in Oakland are unmarried. Women with the educational attainment of graduate degree are most likely to be married with 100.0% of them married at childbirth, while women with the educational attainment of college or associate's degree are least likely to be married with 100.0% of them unmarried at childbirth.
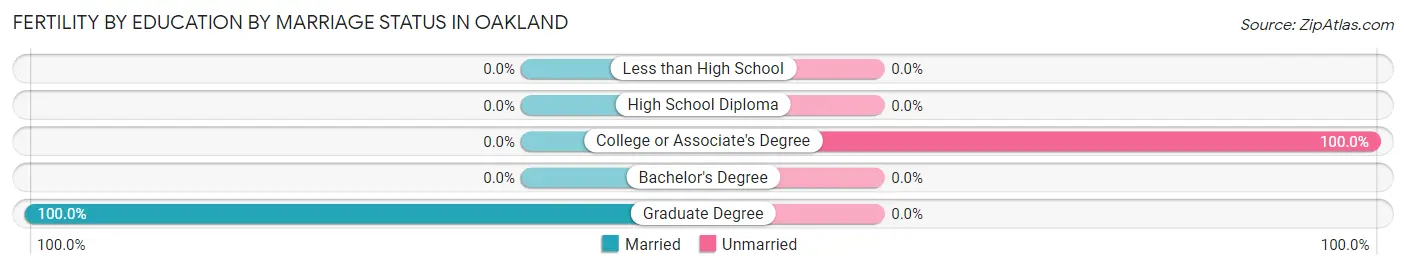
| Educational Attainment | Married | Unmarried |
| Less than High School | 0 (0.0%) | 0 (0.0%) |
| High School Diploma | 0 (0.0%) | 0 (0.0%) |
| College or Associate's Degree | 0 (0.0%) | 5 (100.0%) |
| Bachelor's Degree | 0 (0.0%) | 0 (0.0%) |
| Graduate Degree | 7 (100.0%) | 0 (0.0%) |
| Total | 7 (58.3%) | 5 (41.7%) |
Employment Characteristics in Oakland
Employment by Class of Employer in Oakland
Among the 848 employed individuals in Oakland, private company employees (417 | 49.2%), self-employed (incorporated) (160 | 18.9%), and not-for-profit organizations (102 | 12.0%) make up the most common classes of employment.
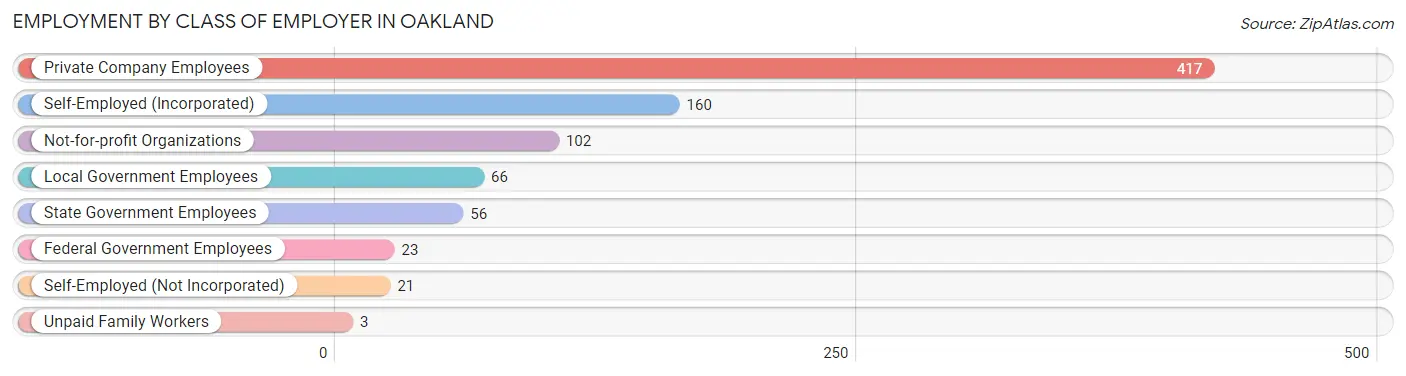
| Employer Class | # Employees | % Employees |
| Private Company Employees | 417 | 49.2% |
| Self-Employed (Incorporated) | 160 | 18.9% |
| Self-Employed (Not Incorporated) | 21 | 2.5% |
| Not-for-profit Organizations | 102 | 12.0% |
| Local Government Employees | 66 | 7.8% |
| State Government Employees | 56 | 6.6% |
| Federal Government Employees | 23 | 2.7% |
| Unpaid Family Workers | 3 | 0.4% |
| Total | 848 | 100.0% |
Employment Status by Age in Oakland
According to the labor force statistics for Oakland, out of the total population over 16 years of age (1,698), 51.8% or 880 individuals are in the labor force, with 2.0% or 18 of them unemployed. The age group with the highest labor force participation rate is 30 to 34 years, with 87.3% or 131 individuals in the labor force. Within the labor force, the 35 to 44 years age range has the highest percentage of unemployed individuals, with 7.6% or 13 of them being unemployed.
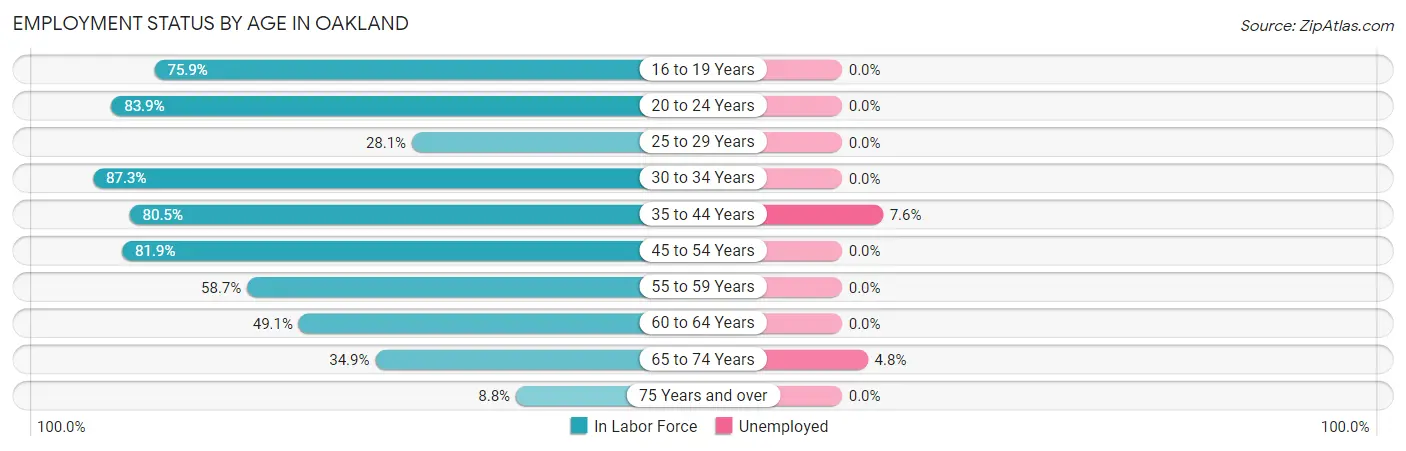
| Age Bracket | In Labor Force | Unemployed |
| 16 to 19 Years | 44 (75.9%) | 0 (0.0%) |
| 20 to 24 Years | 47 (83.9%) | 0 (0.0%) |
| 25 to 29 Years | 41 (28.1%) | 0 (0.0%) |
| 30 to 34 Years | 131 (87.3%) | 0 (0.0%) |
| 35 to 44 Years | 165 (80.5%) | 13 (7.6%) |
| 45 to 54 Years | 158 (81.9%) | 0 (0.0%) |
| 55 to 59 Years | 54 (58.7%) | 0 (0.0%) |
| 60 to 64 Years | 110 (49.1%) | 0 (0.0%) |
| 65 to 74 Years | 105 (34.9%) | 5 (4.8%) |
| 75 Years and over | 24 (8.8%) | 0 (0.0%) |
| Total | 880 (51.8%) | 18 (2.0%) |
Employment Status by Educational Attainment in Oakland
According to labor force statistics for Oakland, 65.2% of individuals (659) out of the total population between 25 and 64 years of age (1,010) are in the labor force, with 1.8% or 12 of them being unemployed. The group with the highest labor force participation rate are those with the educational attainment of bachelor's degree or higher, with 90.4% or 208 individuals in the labor force. Within the labor force, individuals with less than high school education have the highest percentage of unemployment, with 50.0% or 8 of them being unemployed.
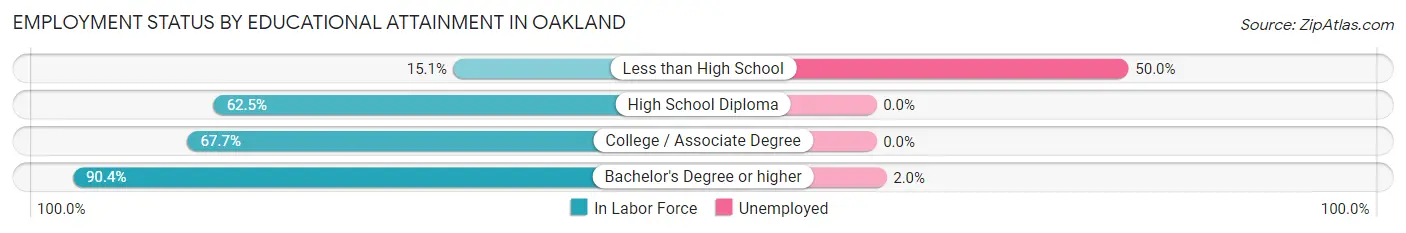
| Educational Attainment | In Labor Force | Unemployed |
| Less than High School | 16 (15.1%) | 53 (50.0%) |
| High School Diploma | 253 (62.5%) | 0 (0.0%) |
| College / Associate Degree | 182 (67.7%) | 0 (0.0%) |
| Bachelor's Degree or higher | 208 (90.4%) | 5 (2.0%) |
| Total | 659 (65.2%) | 18 (1.8%) |
Employment Occupations by Sex in Oakland
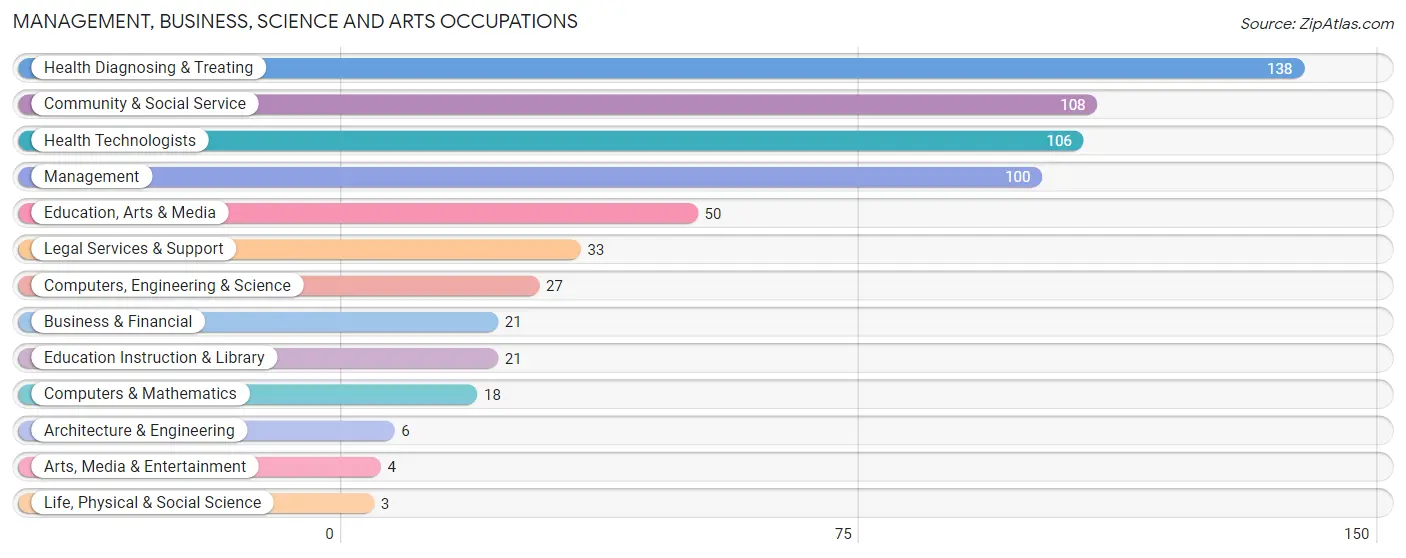
Management, Business, Science and Arts Occupations
The most common Management, Business, Science and Arts occupations in Oakland are Health Diagnosing & Treating (138 | 16.2%), Community & Social Service (108 | 12.7%), Health Technologists (106 | 12.4%), Management (100 | 11.7%), and Education, Arts & Media (50 | 5.9%).
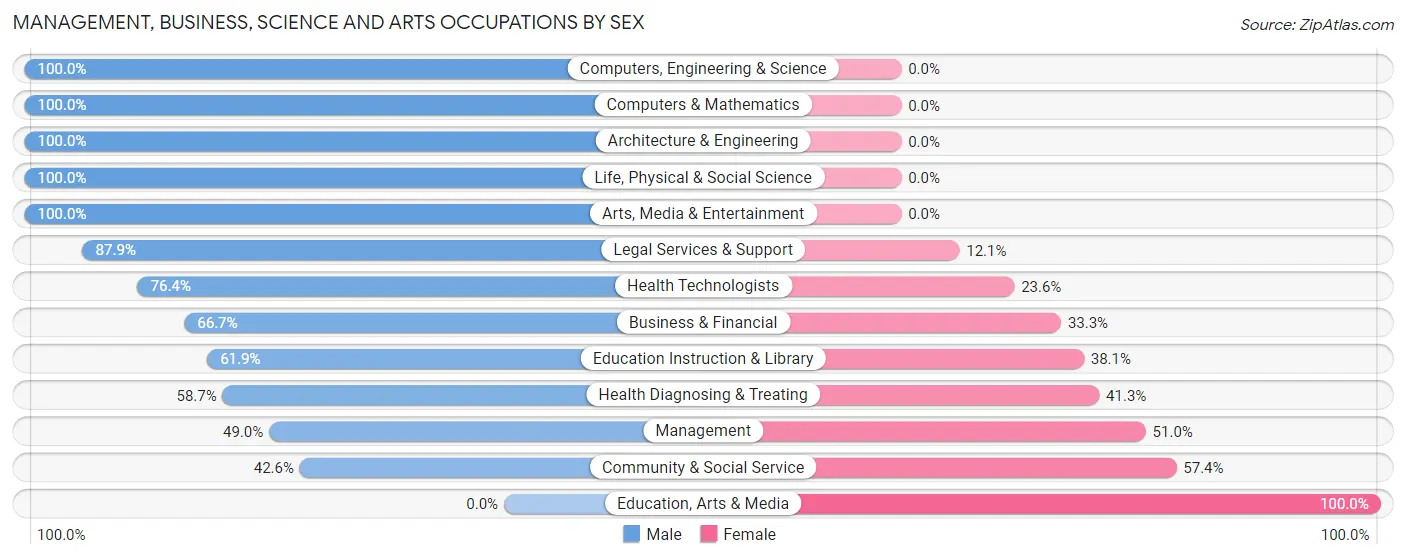
Management, Business, Science and Arts Occupations by Sex
Within the Management, Business, Science and Arts occupations in Oakland, the most male-oriented occupations are Computers, Engineering & Science (100.0%), Computers & Mathematics (100.0%), and Architecture & Engineering (100.0%), while the most female-oriented occupations are Education, Arts & Media (100.0%), Community & Social Service (57.4%), and Management (51.0%).
| Occupation | Male | Female |
| Management | 49 (49.0%) | 51 (51.0%) |
| Business & Financial | 14 (66.7%) | 7 (33.3%) |
| Computers, Engineering & Science | 27 (100.0%) | 0 (0.0%) |
| Computers & Mathematics | 18 (100.0%) | 0 (0.0%) |
| Architecture & Engineering | 6 (100.0%) | 0 (0.0%) |
| Life, Physical & Social Science | 3 (100.0%) | 0 (0.0%) |
| Community & Social Service | 46 (42.6%) | 62 (57.4%) |
| Education, Arts & Media | 0 (0.0%) | 50 (100.0%) |
| Legal Services & Support | 29 (87.9%) | 4 (12.1%) |
| Education Instruction & Library | 13 (61.9%) | 8 (38.1%) |
| Arts, Media & Entertainment | 4 (100.0%) | 0 (0.0%) |
| Health Diagnosing & Treating | 81 (58.7%) | 57 (41.3%) |
| Health Technologists | 81 (76.4%) | 25 (23.6%) |
| Total (Category) | 217 (55.1%) | 177 (44.9%) |
| Total (Overall) | 464 (54.3%) | 390 (45.7%) |
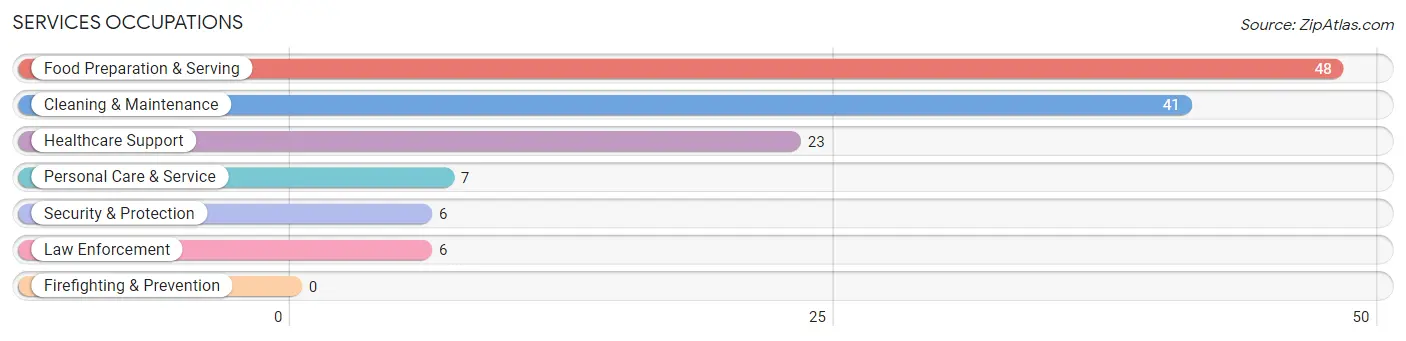
Services Occupations
The most common Services occupations in Oakland are Food Preparation & Serving (48 | 5.6%), Cleaning & Maintenance (41 | 4.8%), Healthcare Support (23 | 2.7%), Personal Care & Service (7 | 0.8%), and Security & Protection (6 | 0.7%).
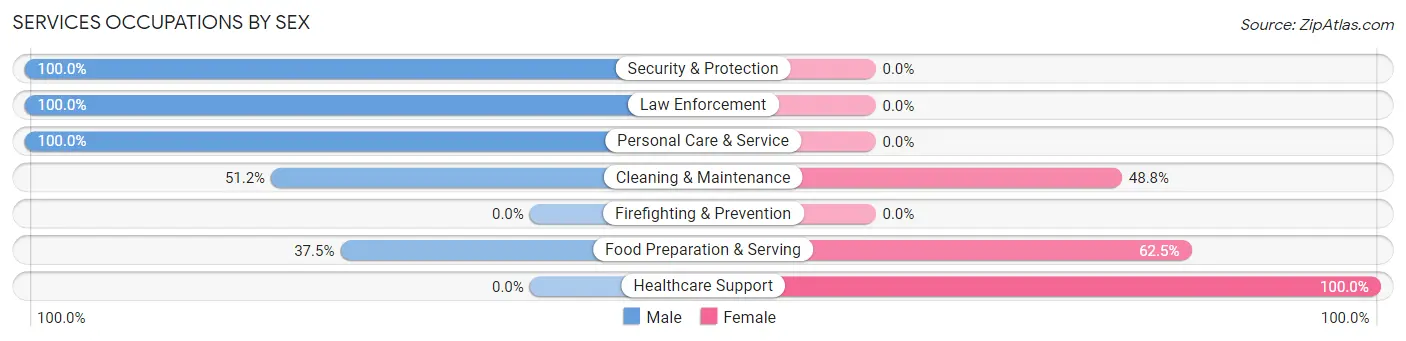
Services Occupations by Sex
Within the Services occupations in Oakland, the most male-oriented occupations are Security & Protection (100.0%), Law Enforcement (100.0%), and Personal Care & Service (100.0%), while the most female-oriented occupations are Healthcare Support (100.0%), Food Preparation & Serving (62.5%), and Cleaning & Maintenance (48.8%).
| Occupation | Male | Female |
| Healthcare Support | 0 (0.0%) | 23 (100.0%) |
| Security & Protection | 6 (100.0%) | 0 (0.0%) |
| Firefighting & Prevention | 0 (0.0%) | 0 (0.0%) |
| Law Enforcement | 6 (100.0%) | 0 (0.0%) |
| Food Preparation & Serving | 18 (37.5%) | 30 (62.5%) |
| Cleaning & Maintenance | 21 (51.2%) | 20 (48.8%) |
| Personal Care & Service | 7 (100.0%) | 0 (0.0%) |
| Total (Category) | 52 (41.6%) | 73 (58.4%) |
| Total (Overall) | 464 (54.3%) | 390 (45.7%) |
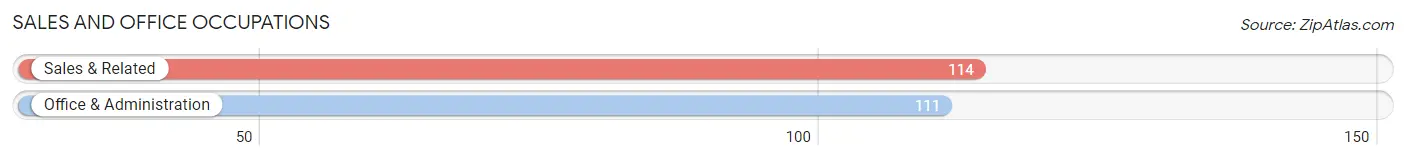
Sales and Office Occupations
The most common Sales and Office occupations in Oakland are Sales & Related (114 | 13.4%), and Office & Administration (111 | 13.0%).
Sales and Office Occupations by Sex

| Occupation | Male | Female |
| Sales & Related | 76 (66.7%) | 38 (33.3%) |
| Office & Administration | 12 (10.8%) | 99 (89.2%) |
| Total (Category) | 88 (39.1%) | 137 (60.9%) |
| Total (Overall) | 464 (54.3%) | 390 (45.7%) |
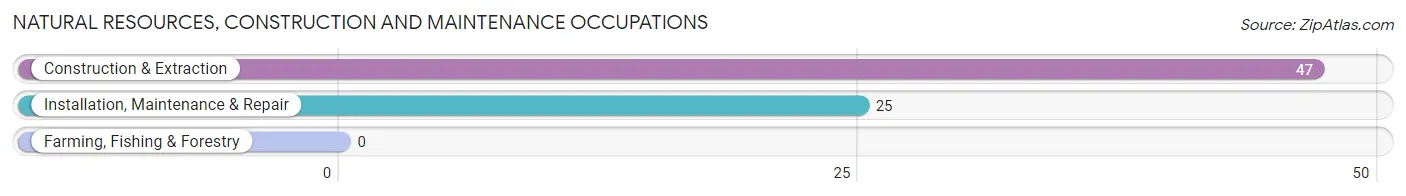
Natural Resources, Construction and Maintenance Occupations
The most common Natural Resources, Construction and Maintenance occupations in Oakland are Construction & Extraction (47 | 5.5%), and Installation, Maintenance & Repair (25 | 2.9%).
Natural Resources, Construction and Maintenance Occupations by Sex
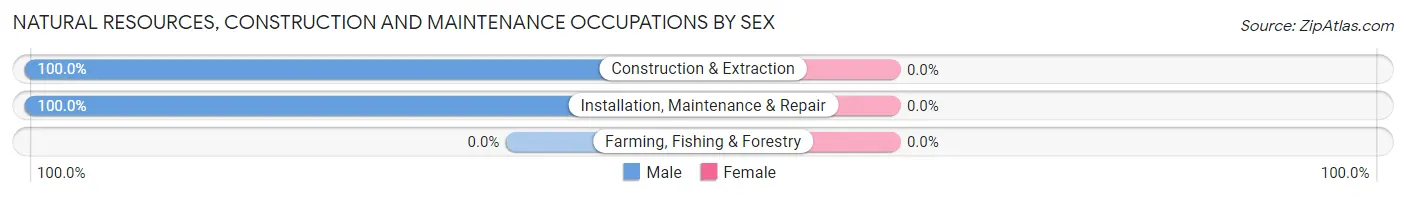
| Occupation | Male | Female |
| Farming, Fishing & Forestry | 0 (0.0%) | 0 (0.0%) |
| Construction & Extraction | 47 (100.0%) | 0 (0.0%) |
| Installation, Maintenance & Repair | 25 (100.0%) | 0 (0.0%) |
| Total (Category) | 72 (100.0%) | 0 (0.0%) |
| Total (Overall) | 464 (54.3%) | 390 (45.7%) |
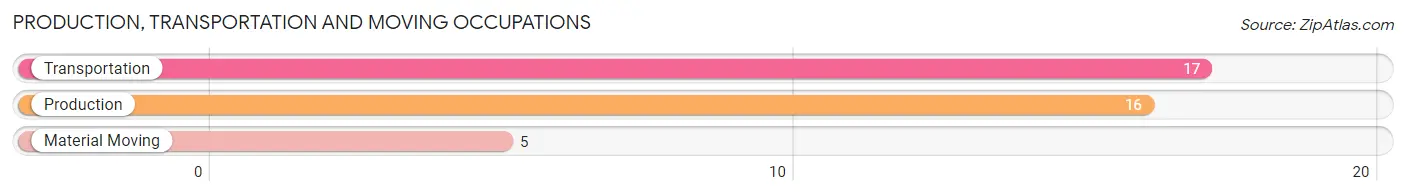
Production, Transportation and Moving Occupations
The most common Production, Transportation and Moving occupations in Oakland are Transportation (17 | 2.0%), Production (16 | 1.9%), and Material Moving (5 | 0.6%).
Production, Transportation and Moving Occupations by Sex
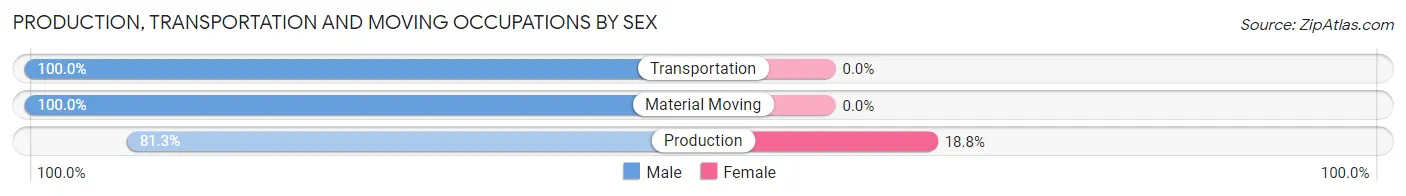
| Occupation | Male | Female |
| Production | 13 (81.2%) | 3 (18.8%) |
| Transportation | 17 (100.0%) | 0 (0.0%) |
| Material Moving | 5 (100.0%) | 0 (0.0%) |
| Total (Category) | 35 (92.1%) | 3 (7.9%) |
| Total (Overall) | 464 (54.3%) | 390 (45.7%) |
Employment Industries by Sex in Oakland
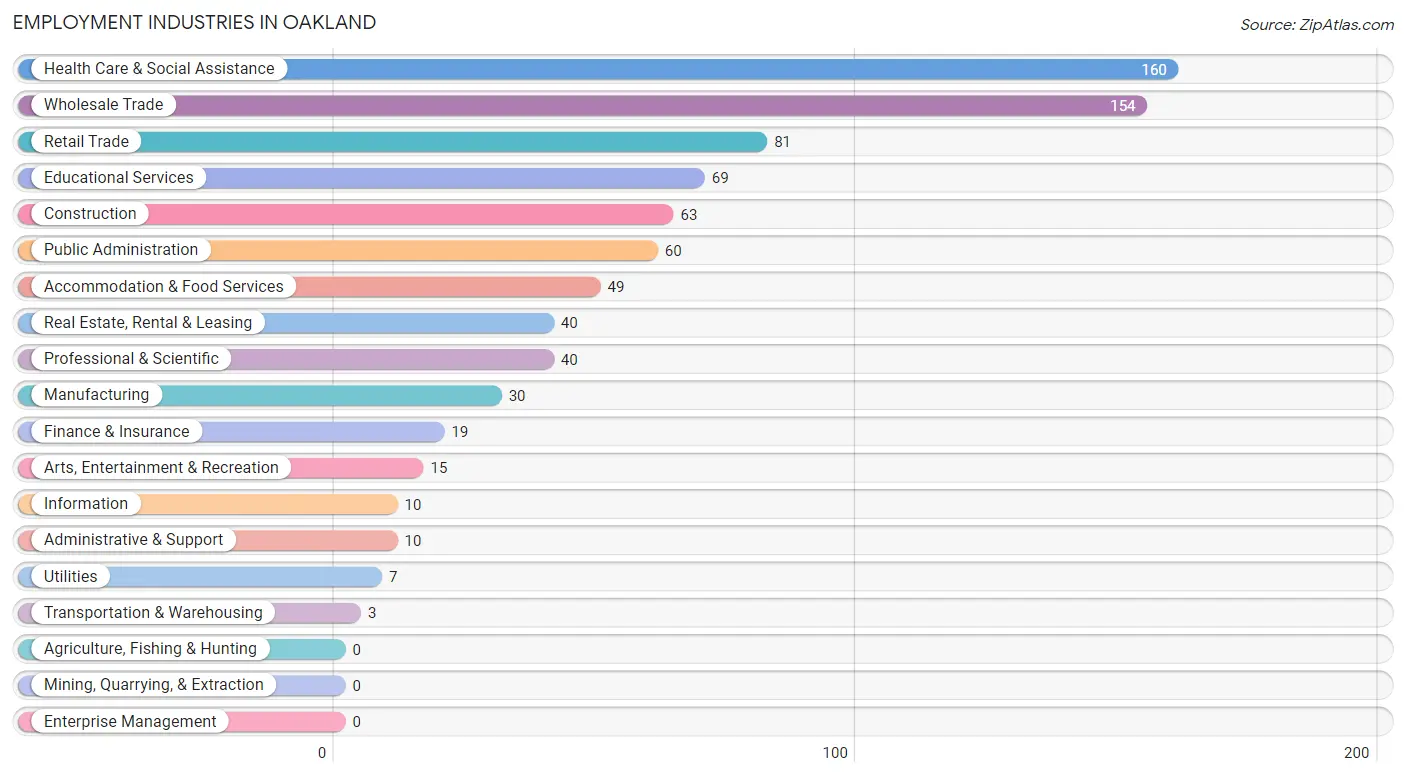
Employment Industries in Oakland
The major employment industries in Oakland include Health Care & Social Assistance (160 | 18.7%), Wholesale Trade (154 | 18.0%), Retail Trade (81 | 9.5%), Educational Services (69 | 8.1%), and Construction (63 | 7.4%).
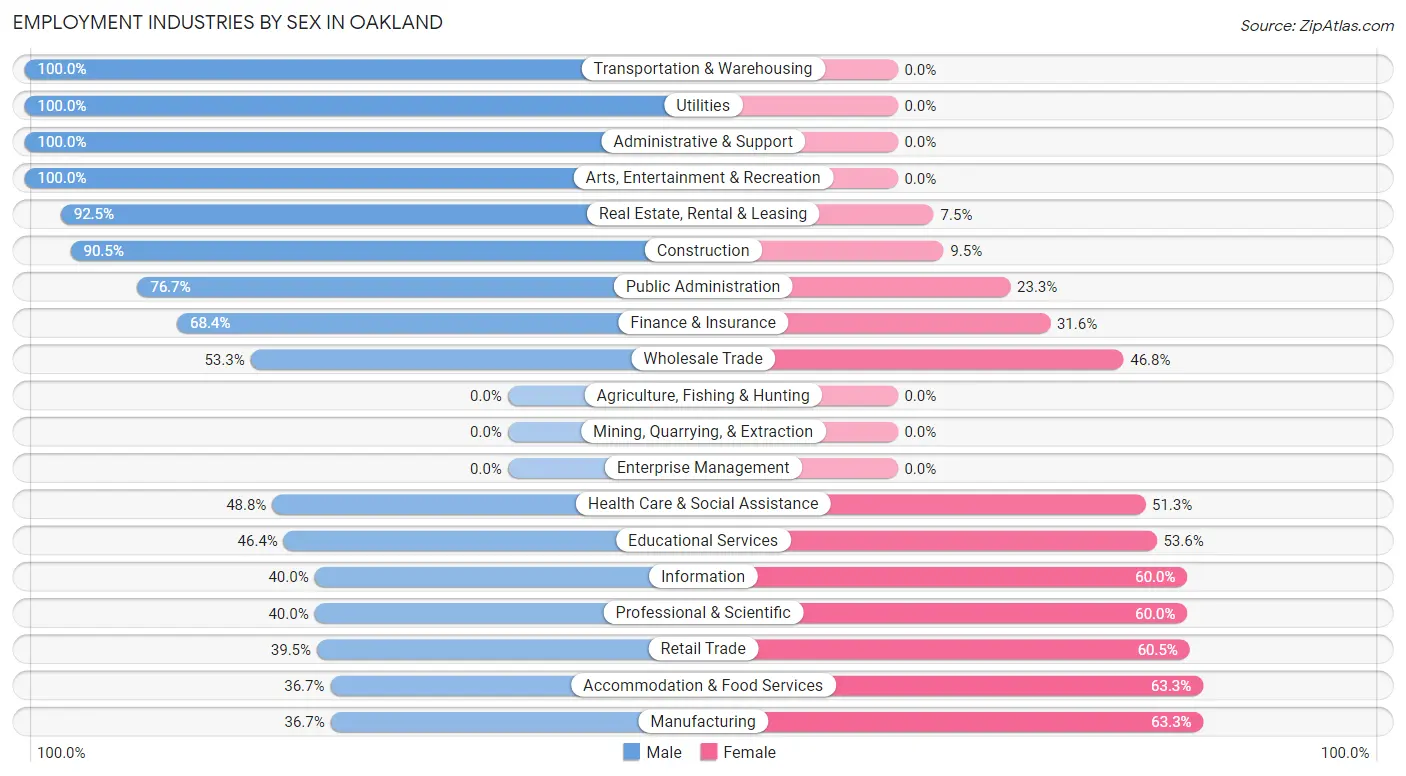
Employment Industries by Sex in Oakland
The Oakland industries that see more men than women are Transportation & Warehousing (100.0%), Utilities (100.0%), and Administrative & Support (100.0%), whereas the industries that tend to have a higher number of women are Manufacturing (63.3%), Accommodation & Food Services (63.3%), and Retail Trade (60.5%).
| Industry | Male | Female |
| Agriculture, Fishing & Hunting | 0 (0.0%) | 0 (0.0%) |
| Mining, Quarrying, & Extraction | 0 (0.0%) | 0 (0.0%) |
| Construction | 57 (90.5%) | 6 (9.5%) |
| Manufacturing | 11 (36.7%) | 19 (63.3%) |
| Wholesale Trade | 82 (53.2%) | 72 (46.8%) |
| Retail Trade | 32 (39.5%) | 49 (60.5%) |
| Transportation & Warehousing | 3 (100.0%) | 0 (0.0%) |
| Utilities | 7 (100.0%) | 0 (0.0%) |
| Information | 4 (40.0%) | 6 (60.0%) |
| Finance & Insurance | 13 (68.4%) | 6 (31.6%) |
| Real Estate, Rental & Leasing | 37 (92.5%) | 3 (7.5%) |
| Professional & Scientific | 16 (40.0%) | 24 (60.0%) |
| Enterprise Management | 0 (0.0%) | 0 (0.0%) |
| Administrative & Support | 10 (100.0%) | 0 (0.0%) |
| Educational Services | 32 (46.4%) | 37 (53.6%) |
| Health Care & Social Assistance | 78 (48.7%) | 82 (51.2%) |
| Arts, Entertainment & Recreation | 15 (100.0%) | 0 (0.0%) |
| Accommodation & Food Services | 18 (36.7%) | 31 (63.3%) |
| Public Administration | 46 (76.7%) | 14 (23.3%) |
| Total | 464 (54.3%) | 390 (45.7%) |
Education in Oakland
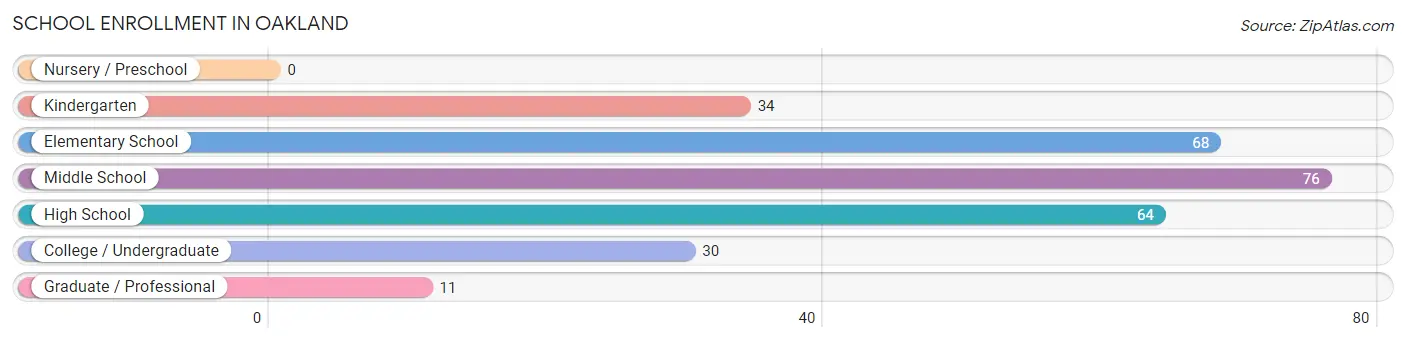
School Enrollment in Oakland
The most common levels of schooling among the 283 students in Oakland are middle school (76 | 26.9%), elementary school (68 | 24.0%), and high school (64 | 22.6%).
| School Level | # Students | % Students |
| Nursery / Preschool | 0 | 0.0% |
| Kindergarten | 34 | 12.0% |
| Elementary School | 68 | 24.0% |
| Middle School | 76 | 26.9% |
| High School | 64 | 22.6% |
| College / Undergraduate | 30 | 10.6% |
| Graduate / Professional | 11 | 3.9% |
| Total | 283 | 100.0% |
School Enrollment by Age by Funding Source in Oakland
Out of a total of 283 students who are enrolled in schools in Oakland, 10 (3.5%) attend a private institution, while the remaining 273 (96.5%) are enrolled in public schools. The age group of 3 to 4 year olds has the highest likelihood of being enrolled in private schools, with 3 (100.0% in the age bracket) enrolled. Conversely, the age group of 5 to 9 year old has the lowest likelihood of being enrolled in a private school, with 79 (100.0% in the age bracket) attending a public institution.
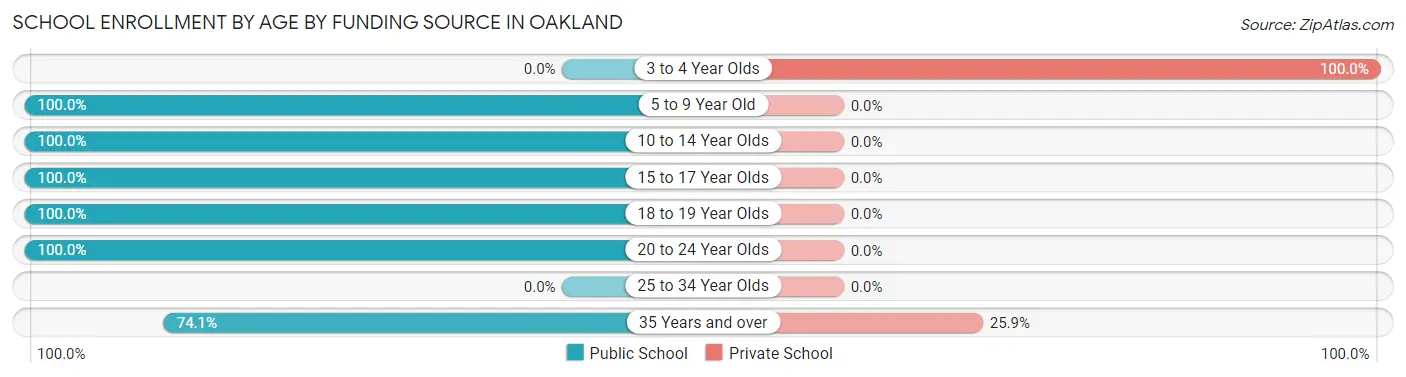
| Age Bracket | Public School | Private School |
| 3 to 4 Year Olds | 0 (0.0%) | 3 (100.0%) |
| 5 to 9 Year Old | 79 (100.0%) | 0 (0.0%) |
| 10 to 14 Year Olds | 85 (100.0%) | 0 (0.0%) |
| 15 to 17 Year Olds | 55 (100.0%) | 0 (0.0%) |
| 18 to 19 Year Olds | 23 (100.0%) | 0 (0.0%) |
| 20 to 24 Year Olds | 11 (100.0%) | 0 (0.0%) |
| 25 to 34 Year Olds | 0 (0.0%) | 0 (0.0%) |
| 35 Years and over | 20 (74.1%) | 7 (25.9%) |
| Total | 273 (96.5%) | 10 (3.5%) |
Educational Attainment by Field of Study in Oakland
Business (113 | 23.8%), education (77 | 16.2%), liberal arts & history (74 | 15.6%), arts & humanities (42 | 8.9%), and science & technology (33 | 7.0%) are the most common fields of study among 474 individuals in Oakland who have obtained a bachelor's degree or higher.
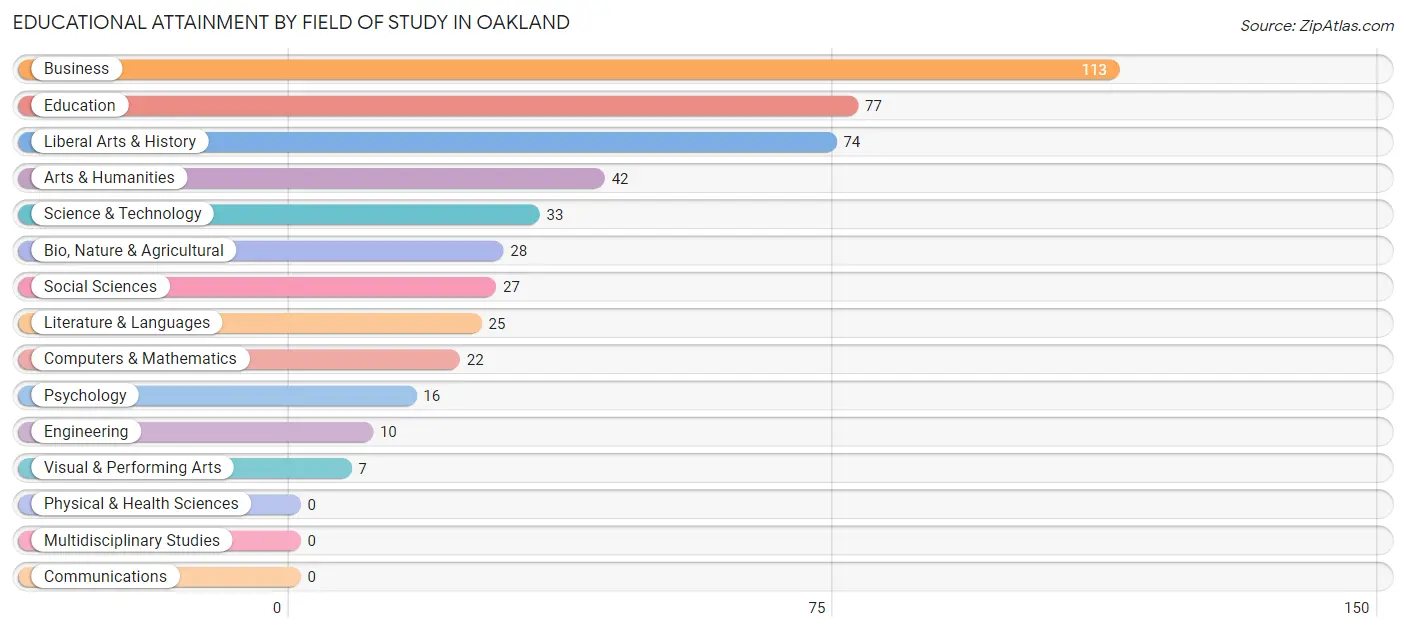
| Field of Study | # Graduates | % Graduates |
| Computers & Mathematics | 22 | 4.6% |
| Bio, Nature & Agricultural | 28 | 5.9% |
| Physical & Health Sciences | 0 | 0.0% |
| Psychology | 16 | 3.4% |
| Social Sciences | 27 | 5.7% |
| Engineering | 10 | 2.1% |
| Multidisciplinary Studies | 0 | 0.0% |
| Science & Technology | 33 | 7.0% |
| Business | 113 | 23.8% |
| Education | 77 | 16.2% |
| Literature & Languages | 25 | 5.3% |
| Liberal Arts & History | 74 | 15.6% |
| Visual & Performing Arts | 7 | 1.5% |
| Communications | 0 | 0.0% |
| Arts & Humanities | 42 | 8.9% |
| Total | 474 | 100.0% |
Transportation & Commute in Oakland
Vehicle Availability by Sex in Oakland
The most prevalent vehicle ownership categories in Oakland are males with 2 vehicles (232, accounting for 49.5%) and females with 2 vehicles (161, making up 61.2%).
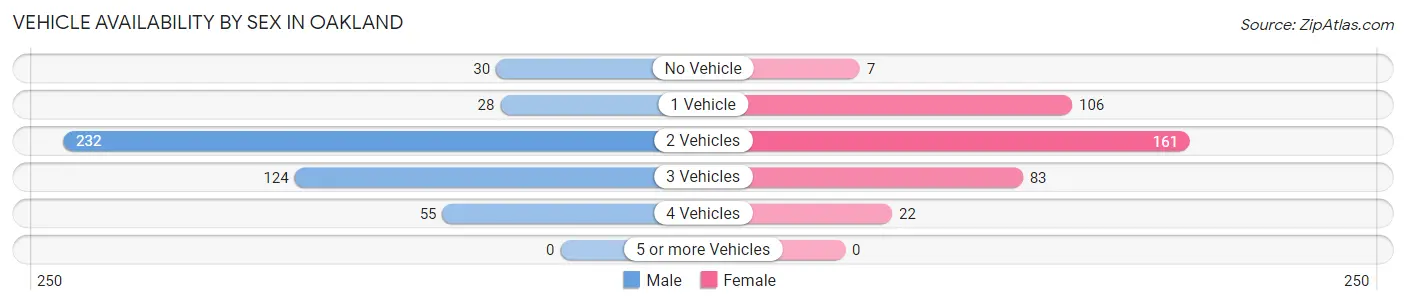
| Vehicles Available | Male | Female |
| No Vehicle | 30 (6.4%) | 7 (1.8%) |
| 1 Vehicle | 28 (6.0%) | 106 (28.0%) |
| 2 Vehicles | 232 (49.5%) | 161 (42.5%) |
| 3 Vehicles | 124 (26.4%) | 83 (21.9%) |
| 4 Vehicles | 55 (11.7%) | 22 (5.8%) |
| 5 or more Vehicles | 0 (0.0%) | 0 (0.0%) |
| Total | 469 (100.0%) | 379 (100.0%) |
Commute Time in Oakland
The most frequently occuring commute durations in Oakland are 5 to 9 minutes (228 commuters, 30.0%), less than 5 minutes (142 commuters, 18.7%), and 10 to 14 minutes (117 commuters, 15.4%).
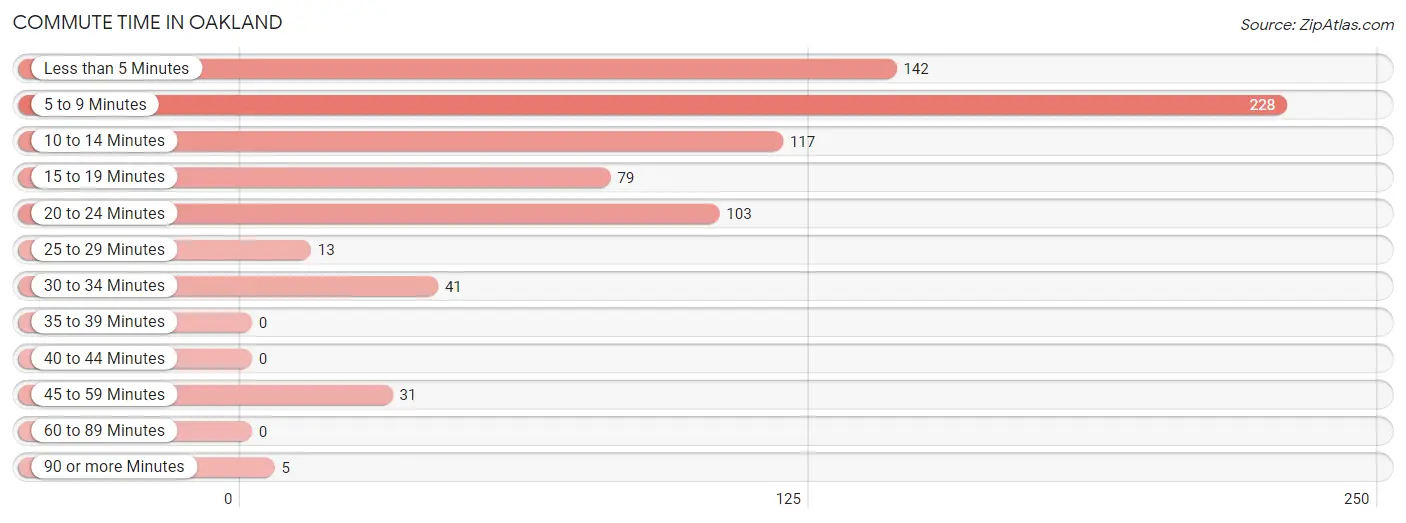
| Commute Time | # Commuters | % Commuters |
| Less than 5 Minutes | 142 | 18.7% |
| 5 to 9 Minutes | 228 | 30.0% |
| 10 to 14 Minutes | 117 | 15.4% |
| 15 to 19 Minutes | 79 | 10.4% |
| 20 to 24 Minutes | 103 | 13.6% |
| 25 to 29 Minutes | 13 | 1.7% |
| 30 to 34 Minutes | 41 | 5.4% |
| 35 to 39 Minutes | 0 | 0.0% |
| 40 to 44 Minutes | 0 | 0.0% |
| 45 to 59 Minutes | 31 | 4.1% |
| 60 to 89 Minutes | 0 | 0.0% |
| 90 or more Minutes | 5 | 0.7% |
Commute Time by Sex in Oakland
The most common commute times in Oakland are less than 5 minutes (104 commuters, 22.9%) for males and 5 to 9 minutes (142 commuters, 46.7%) for females.
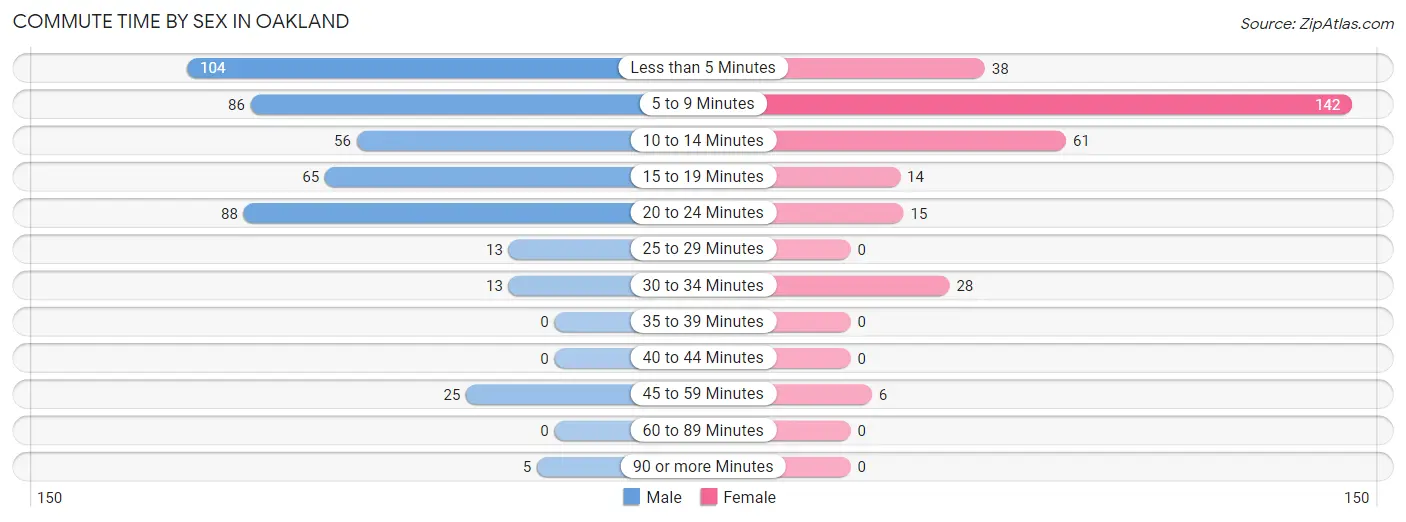
| Commute Time | Male | Female |
| Less than 5 Minutes | 104 (22.9%) | 38 (12.5%) |
| 5 to 9 Minutes | 86 (18.9%) | 142 (46.7%) |
| 10 to 14 Minutes | 56 (12.3%) | 61 (20.1%) |
| 15 to 19 Minutes | 65 (14.3%) | 14 (4.6%) |
| 20 to 24 Minutes | 88 (19.3%) | 15 (4.9%) |
| 25 to 29 Minutes | 13 (2.9%) | 0 (0.0%) |
| 30 to 34 Minutes | 13 (2.9%) | 28 (9.2%) |
| 35 to 39 Minutes | 0 (0.0%) | 0 (0.0%) |
| 40 to 44 Minutes | 0 (0.0%) | 0 (0.0%) |
| 45 to 59 Minutes | 25 (5.5%) | 6 (2.0%) |
| 60 to 89 Minutes | 0 (0.0%) | 0 (0.0%) |
| 90 or more Minutes | 5 (1.1%) | 0 (0.0%) |
Time of Departure to Work by Sex in Oakland
The most frequent times of departure to work in Oakland are 5:30 AM to 5:59 AM (136, 29.9%) for males and 8:00 AM to 8:29 AM (68, 22.4%) for females.
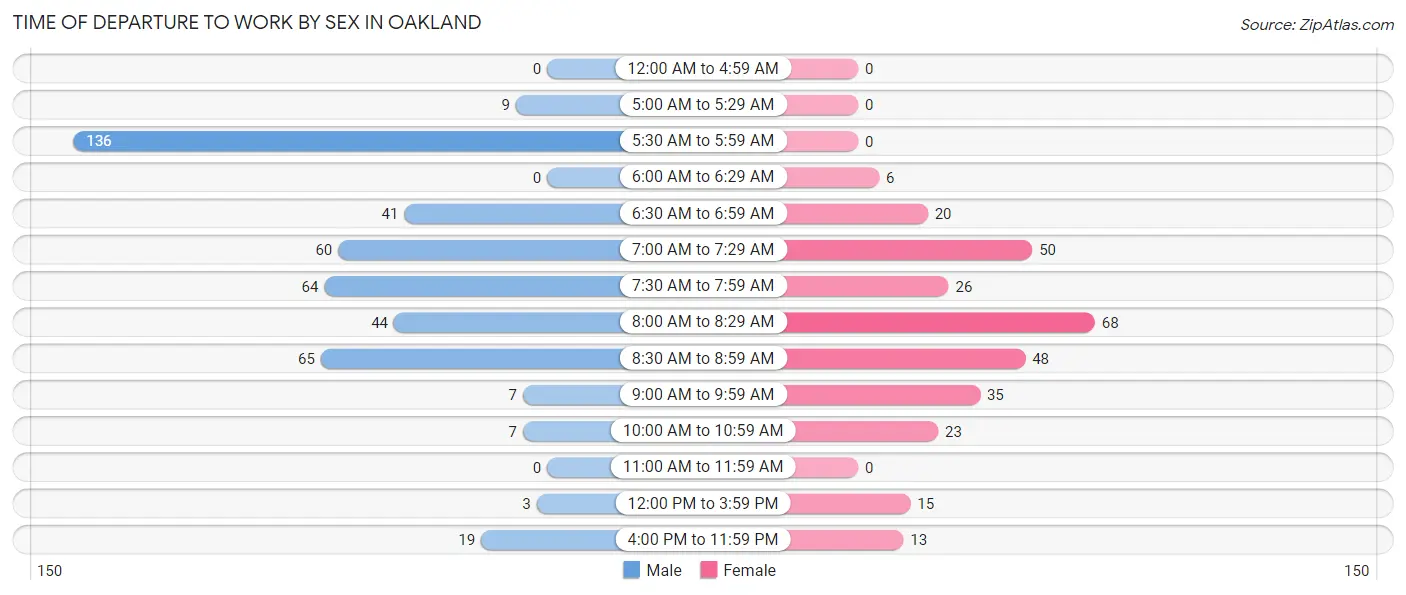
| Time of Departure | Male | Female |
| 12:00 AM to 4:59 AM | 0 (0.0%) | 0 (0.0%) |
| 5:00 AM to 5:29 AM | 9 (2.0%) | 0 (0.0%) |
| 5:30 AM to 5:59 AM | 136 (29.9%) | 0 (0.0%) |
| 6:00 AM to 6:29 AM | 0 (0.0%) | 6 (2.0%) |
| 6:30 AM to 6:59 AM | 41 (9.0%) | 20 (6.6%) |
| 7:00 AM to 7:29 AM | 60 (13.2%) | 50 (16.5%) |
| 7:30 AM to 7:59 AM | 64 (14.1%) | 26 (8.6%) |
| 8:00 AM to 8:29 AM | 44 (9.7%) | 68 (22.4%) |
| 8:30 AM to 8:59 AM | 65 (14.3%) | 48 (15.8%) |
| 9:00 AM to 9:59 AM | 7 (1.5%) | 35 (11.5%) |
| 10:00 AM to 10:59 AM | 7 (1.5%) | 23 (7.6%) |
| 11:00 AM to 11:59 AM | 0 (0.0%) | 0 (0.0%) |
| 12:00 PM to 3:59 PM | 3 (0.7%) | 15 (4.9%) |
| 4:00 PM to 11:59 PM | 19 (4.2%) | 13 (4.3%) |
| Total | 455 (100.0%) | 304 (100.0%) |
Housing Occupancy in Oakland
Occupancy by Ownership in Oakland
Of the total 902 dwellings in Oakland, owner-occupied units account for 476 (52.8%), while renter-occupied units make up 426 (47.2%).
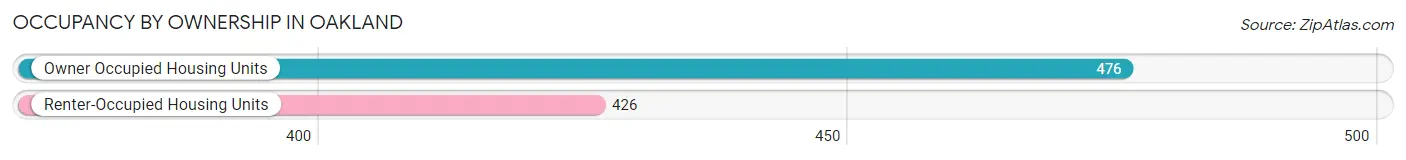
| Occupancy | # Housing Units | % Housing Units |
| Owner Occupied Housing Units | 476 | 52.8% |
| Renter-Occupied Housing Units | 426 | 47.2% |
| Total Occupied Housing Units | 902 | 100.0% |
Occupancy by Household Size in Oakland
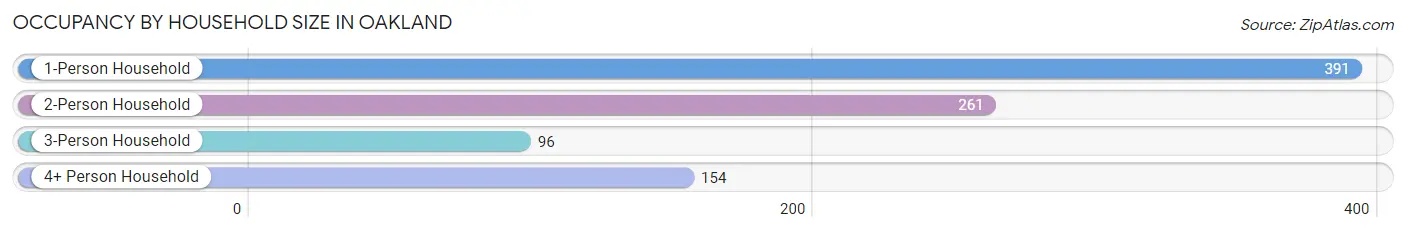
| Household Size | # Housing Units | % Housing Units |
| 1-Person Household | 391 | 43.3% |
| 2-Person Household | 261 | 28.9% |
| 3-Person Household | 96 | 10.6% |
| 4+ Person Household | 154 | 17.1% |
| Total Housing Units | 902 | 100.0% |
Occupancy by Ownership by Household Size in Oakland
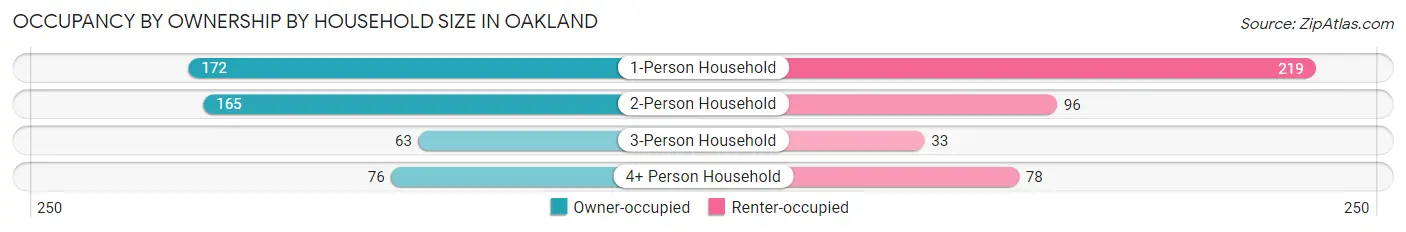
| Household Size | Owner-occupied | Renter-occupied |
| 1-Person Household | 172 (44.0%) | 219 (56.0%) |
| 2-Person Household | 165 (63.2%) | 96 (36.8%) |
| 3-Person Household | 63 (65.6%) | 33 (34.4%) |
| 4+ Person Household | 76 (49.3%) | 78 (50.6%) |
| Total Housing Units | 476 (52.8%) | 426 (47.2%) |
Occupancy by Educational Attainment in Oakland
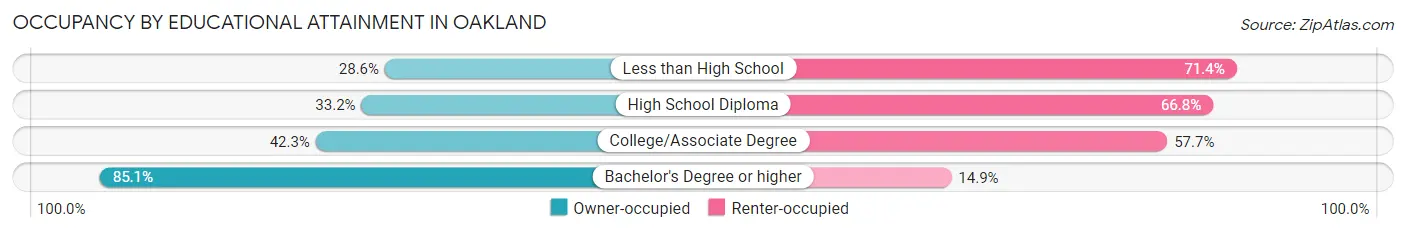
| Household Size | Owner-occupied | Renter-occupied |
| Less than High School | 12 (28.6%) | 30 (71.4%) |
| High School Diploma | 95 (33.2%) | 191 (66.8%) |
| College/Associate Degree | 118 (42.3%) | 161 (57.7%) |
| Bachelor's Degree or higher | 251 (85.1%) | 44 (14.9%) |
Occupancy by Age of Householder in Oakland
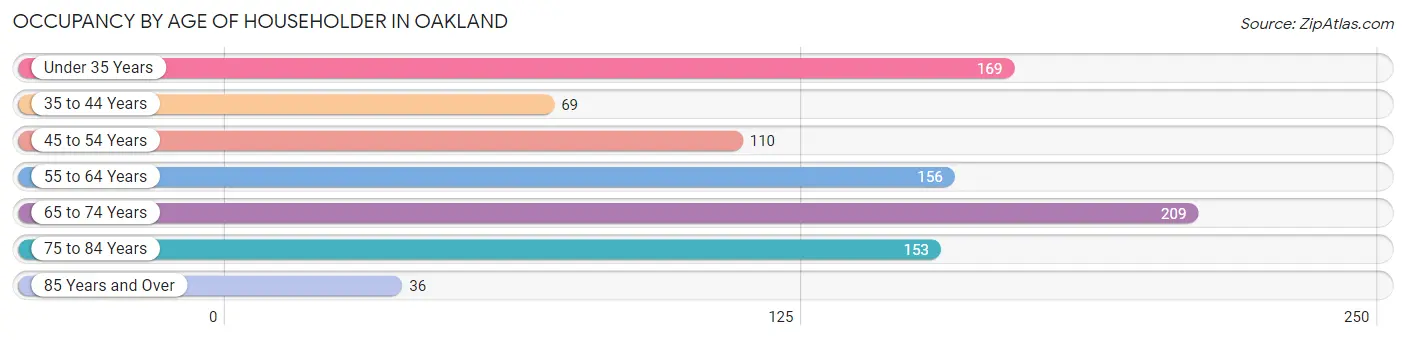
| Age Bracket | # Households | % Households |
| Under 35 Years | 169 | 18.7% |
| 35 to 44 Years | 69 | 7.6% |
| 45 to 54 Years | 110 | 12.2% |
| 55 to 64 Years | 156 | 17.3% |
| 65 to 74 Years | 209 | 23.2% |
| 75 to 84 Years | 153 | 17.0% |
| 85 Years and Over | 36 | 4.0% |
| Total | 902 | 100.0% |
Housing Finances in Oakland
Median Income by Occupancy in Oakland
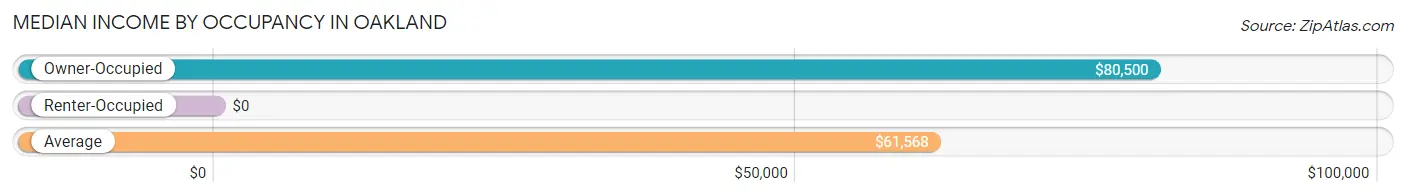
| Occupancy Type | # Households | Median Income |
| Owner-Occupied | 476 (52.8%) | $80,500 |
| Renter-Occupied | 426 (47.2%) | $0 |
| Average | 902 (100.0%) | $61,568 |
Occupancy by Householder Income Bracket in Oakland
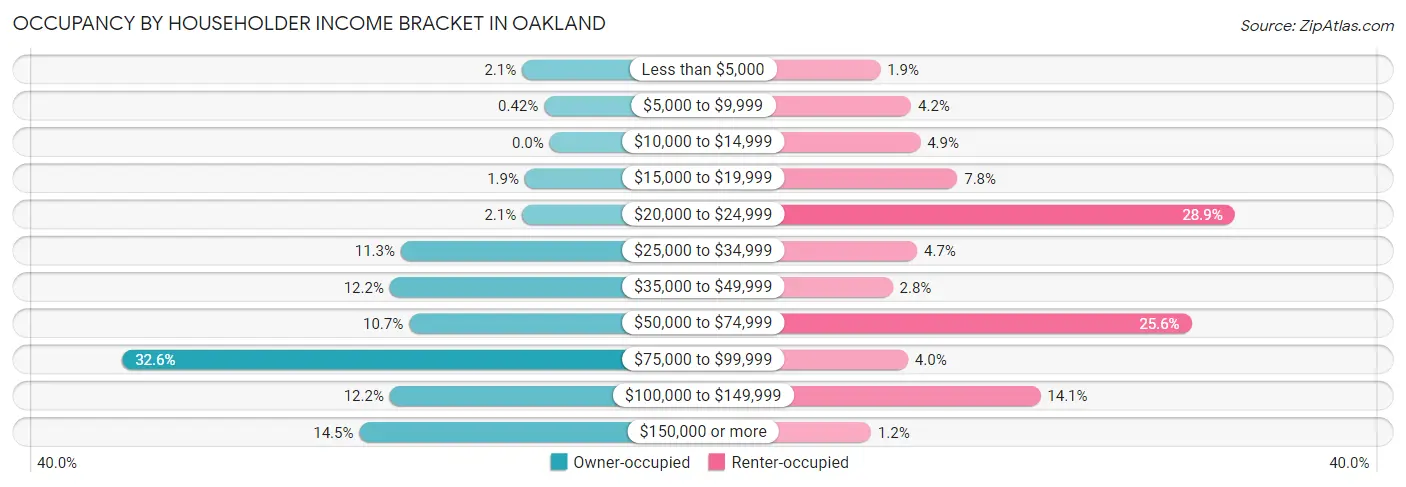
| Income Bracket | Owner-occupied | Renter-occupied |
| Less than $5,000 | 10 (2.1%) | 8 (1.9%) |
| $5,000 to $9,999 | 2 (0.4%) | 18 (4.2%) |
| $10,000 to $14,999 | 0 (0.0%) | 21 (4.9%) |
| $15,000 to $19,999 | 9 (1.9%) | 33 (7.7%) |
| $20,000 to $24,999 | 10 (2.1%) | 123 (28.9%) |
| $25,000 to $34,999 | 54 (11.3%) | 20 (4.7%) |
| $35,000 to $49,999 | 58 (12.2%) | 12 (2.8%) |
| $50,000 to $74,999 | 51 (10.7%) | 109 (25.6%) |
| $75,000 to $99,999 | 155 (32.6%) | 17 (4.0%) |
| $100,000 to $149,999 | 58 (12.2%) | 60 (14.1%) |
| $150,000 or more | 69 (14.5%) | 5 (1.2%) |
| Total | 476 (100.0%) | 426 (100.0%) |
Monthly Housing Cost Tiers in Oakland
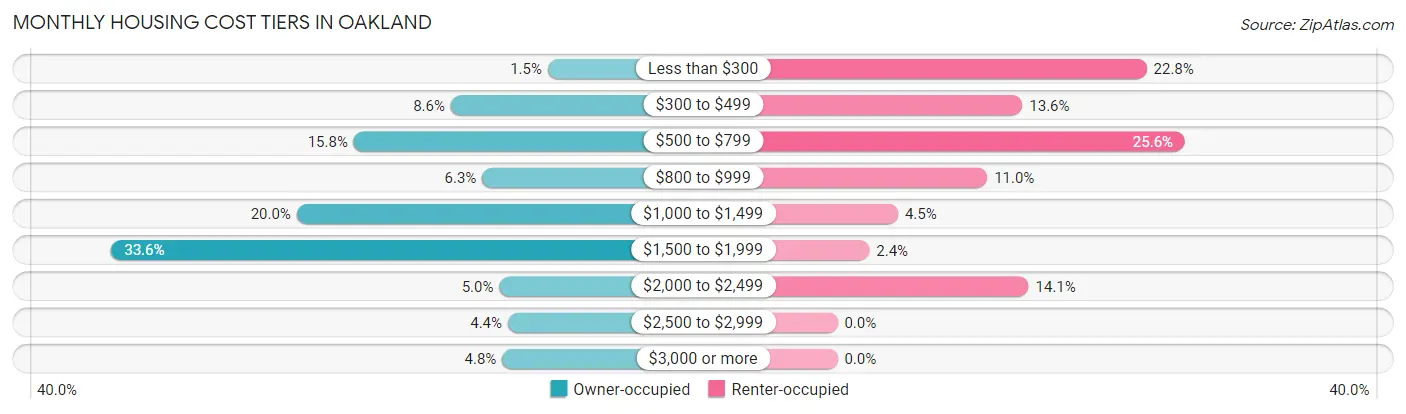
| Monthly Cost | Owner-occupied | Renter-occupied |
| Less than $300 | 7 (1.5%) | 97 (22.8%) |
| $300 to $499 | 41 (8.6%) | 58 (13.6%) |
| $500 to $799 | 75 (15.8%) | 109 (25.6%) |
| $800 to $999 | 30 (6.3%) | 47 (11.0%) |
| $1,000 to $1,499 | 95 (20.0%) | 19 (4.5%) |
| $1,500 to $1,999 | 160 (33.6%) | 10 (2.4%) |
| $2,000 to $2,499 | 24 (5.0%) | 60 (14.1%) |
| $2,500 to $2,999 | 21 (4.4%) | 0 (0.0%) |
| $3,000 or more | 23 (4.8%) | 0 (0.0%) |
| Total | 476 (100.0%) | 426 (100.0%) |
Physical Housing Characteristics in Oakland
Housing Structures in Oakland
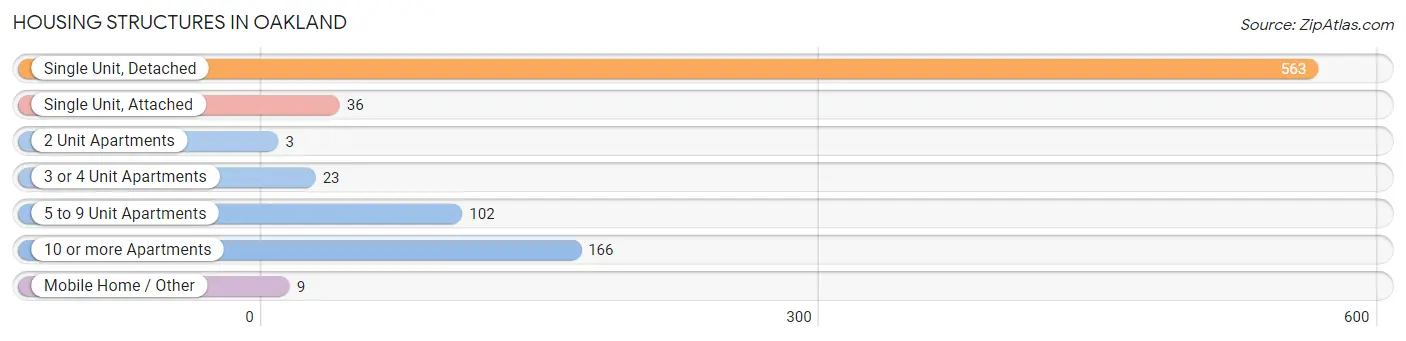
| Structure Type | # Housing Units | % Housing Units |
| Single Unit, Detached | 563 | 62.4% |
| Single Unit, Attached | 36 | 4.0% |
| 2 Unit Apartments | 3 | 0.3% |
| 3 or 4 Unit Apartments | 23 | 2.5% |
| 5 to 9 Unit Apartments | 102 | 11.3% |
| 10 or more Apartments | 166 | 18.4% |
| Mobile Home / Other | 9 | 1.0% |
| Total | 902 | 100.0% |
Housing Structures by Occupancy in Oakland
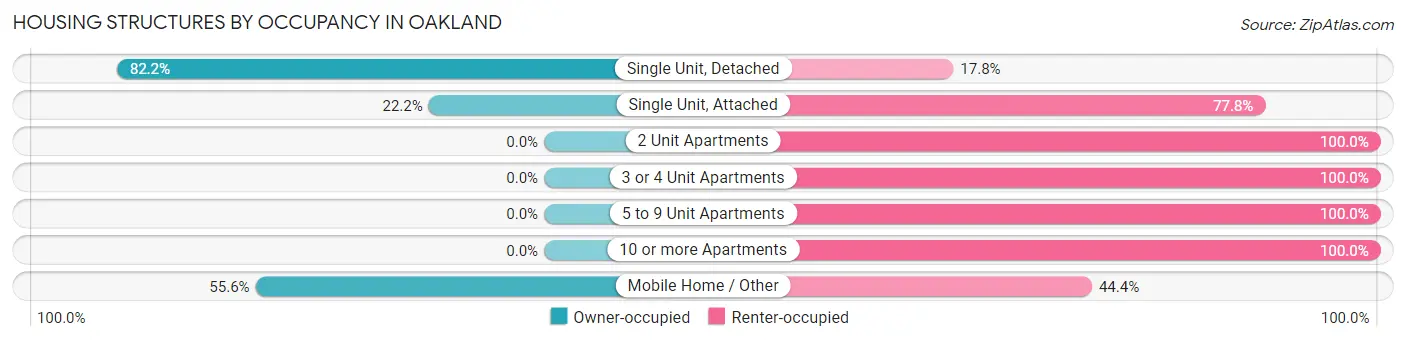
| Structure Type | Owner-occupied | Renter-occupied |
| Single Unit, Detached | 463 (82.2%) | 100 (17.8%) |
| Single Unit, Attached | 8 (22.2%) | 28 (77.8%) |
| 2 Unit Apartments | 0 (0.0%) | 3 (100.0%) |
| 3 or 4 Unit Apartments | 0 (0.0%) | 23 (100.0%) |
| 5 to 9 Unit Apartments | 0 (0.0%) | 102 (100.0%) |
| 10 or more Apartments | 0 (0.0%) | 166 (100.0%) |
| Mobile Home / Other | 5 (55.6%) | 4 (44.4%) |
| Total | 476 (52.8%) | 426 (47.2%) |
Housing Structures by Number of Rooms in Oakland
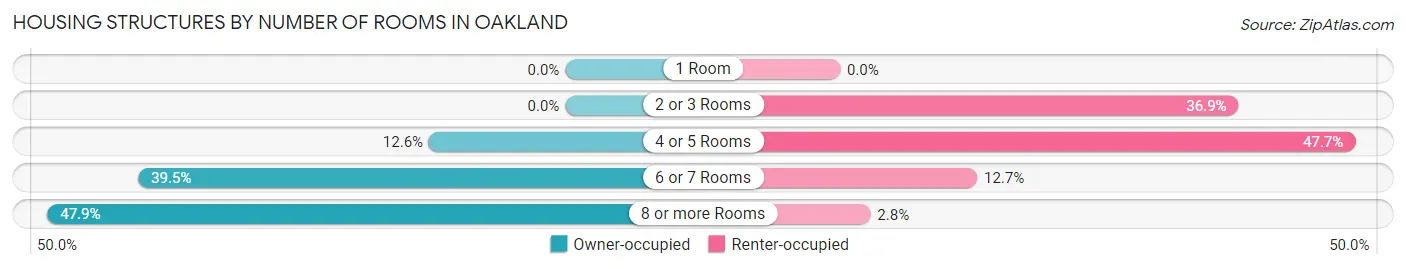
| Number of Rooms | Owner-occupied | Renter-occupied |
| 1 Room | 0 (0.0%) | 0 (0.0%) |
| 2 or 3 Rooms | 0 (0.0%) | 157 (36.8%) |
| 4 or 5 Rooms | 60 (12.6%) | 203 (47.6%) |
| 6 or 7 Rooms | 188 (39.5%) | 54 (12.7%) |
| 8 or more Rooms | 228 (47.9%) | 12 (2.8%) |
| Total | 476 (100.0%) | 426 (100.0%) |
Housing Structure by Heating Type in Oakland
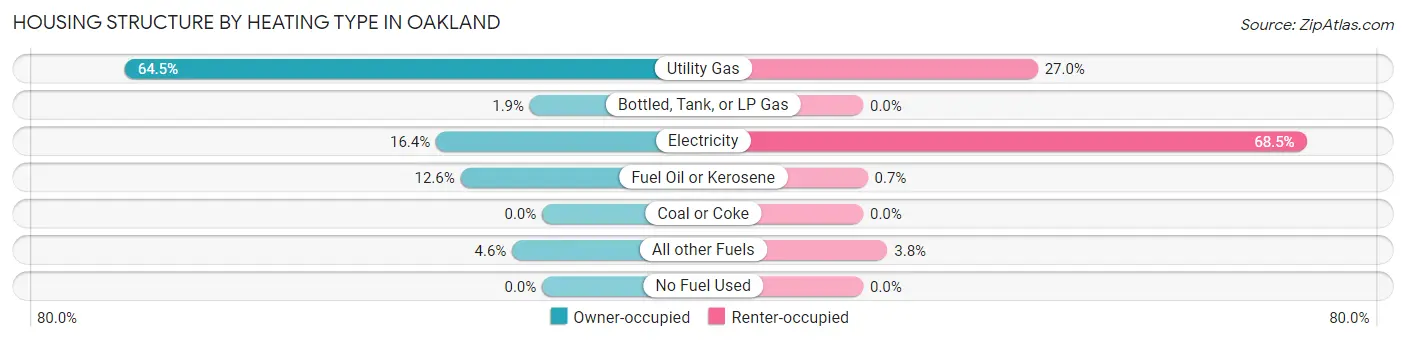
| Heating Type | Owner-occupied | Renter-occupied |
| Utility Gas | 307 (64.5%) | 115 (27.0%) |
| Bottled, Tank, or LP Gas | 9 (1.9%) | 0 (0.0%) |
| Electricity | 78 (16.4%) | 292 (68.5%) |
| Fuel Oil or Kerosene | 60 (12.6%) | 3 (0.7%) |
| Coal or Coke | 0 (0.0%) | 0 (0.0%) |
| All other Fuels | 22 (4.6%) | 16 (3.8%) |
| No Fuel Used | 0 (0.0%) | 0 (0.0%) |
| Total | 476 (100.0%) | 426 (100.0%) |
Household Vehicle Usage in Oakland
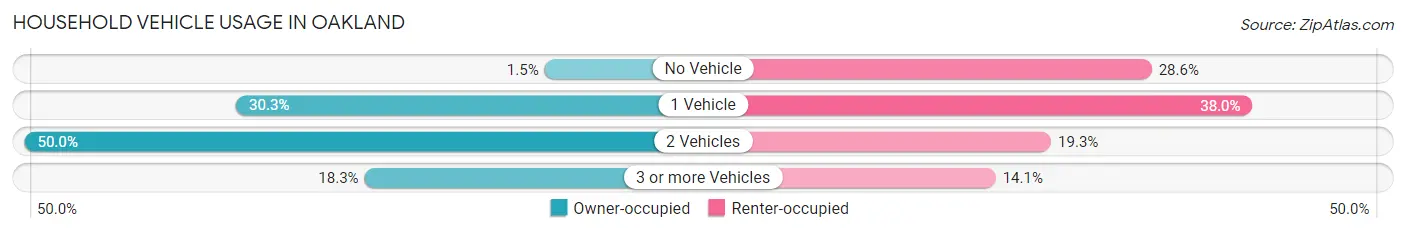
| Vehicles per Household | Owner-occupied | Renter-occupied |
| No Vehicle | 7 (1.5%) | 122 (28.6%) |
| 1 Vehicle | 144 (30.2%) | 162 (38.0%) |
| 2 Vehicles | 238 (50.0%) | 82 (19.3%) |
| 3 or more Vehicles | 87 (18.3%) | 60 (14.1%) |
| Total | 476 (100.0%) | 426 (100.0%) |
Real Estate & Mortgages in Oakland
Real Estate and Mortgage Overview in Oakland
| Characteristic | Without Mortgage | With Mortgage |
| Housing Units | 116 | 360 |
| Median Property Value | $196,400 | $255,200 |
| Median Household Income | $47,000 | $61 |
| Monthly Housing Costs | $534 | $23 |
| Real Estate Taxes | $2,067 | $0 |
Property Value by Mortgage Status in Oakland
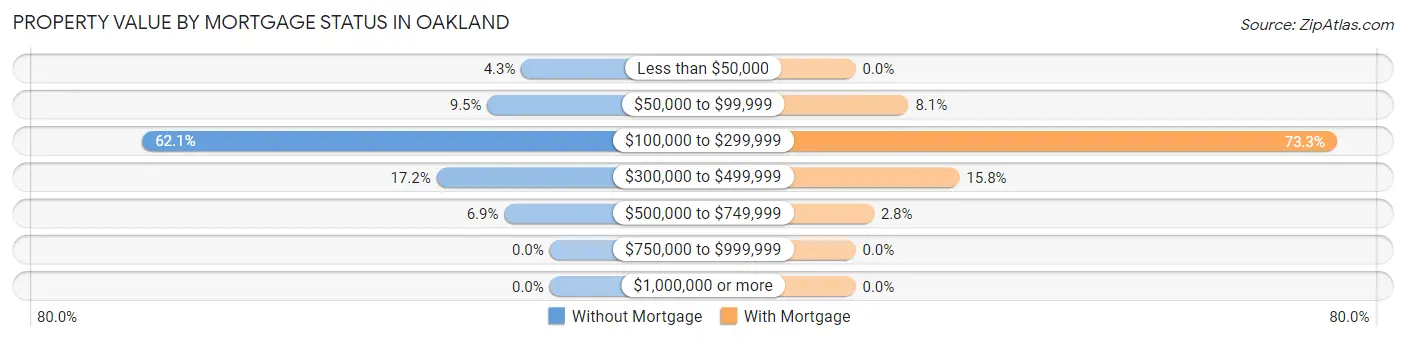
| Property Value | Without Mortgage | With Mortgage |
| Less than $50,000 | 5 (4.3%) | 0 (0.0%) |
| $50,000 to $99,999 | 11 (9.5%) | 29 (8.1%) |
| $100,000 to $299,999 | 72 (62.1%) | 264 (73.3%) |
| $300,000 to $499,999 | 20 (17.2%) | 57 (15.8%) |
| $500,000 to $749,999 | 8 (6.9%) | 10 (2.8%) |
| $750,000 to $999,999 | 0 (0.0%) | 0 (0.0%) |
| $1,000,000 or more | 0 (0.0%) | 0 (0.0%) |
| Total | 116 (100.0%) | 360 (100.0%) |
Household Income by Mortgage Status in Oakland
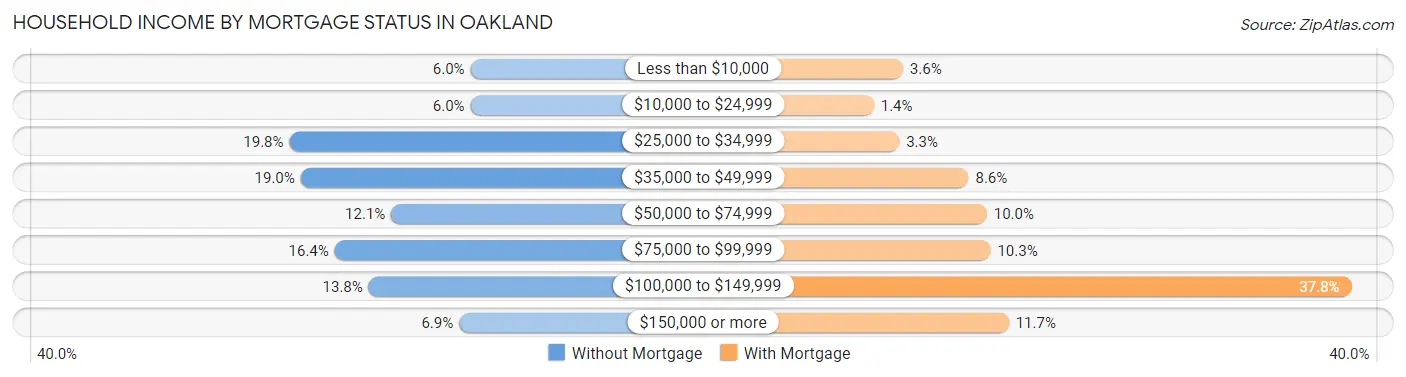
| Household Income | Without Mortgage | With Mortgage |
| Less than $10,000 | 7 (6.0%) | 13 (3.6%) |
| $10,000 to $24,999 | 7 (6.0%) | 5 (1.4%) |
| $25,000 to $34,999 | 23 (19.8%) | 12 (3.3%) |
| $35,000 to $49,999 | 22 (19.0%) | 31 (8.6%) |
| $50,000 to $74,999 | 14 (12.1%) | 36 (10.0%) |
| $75,000 to $99,999 | 19 (16.4%) | 37 (10.3%) |
| $100,000 to $149,999 | 16 (13.8%) | 136 (37.8%) |
| $150,000 or more | 8 (6.9%) | 42 (11.7%) |
| Total | 116 (100.0%) | 360 (100.0%) |
Property Value to Household Income Ratio in Oakland
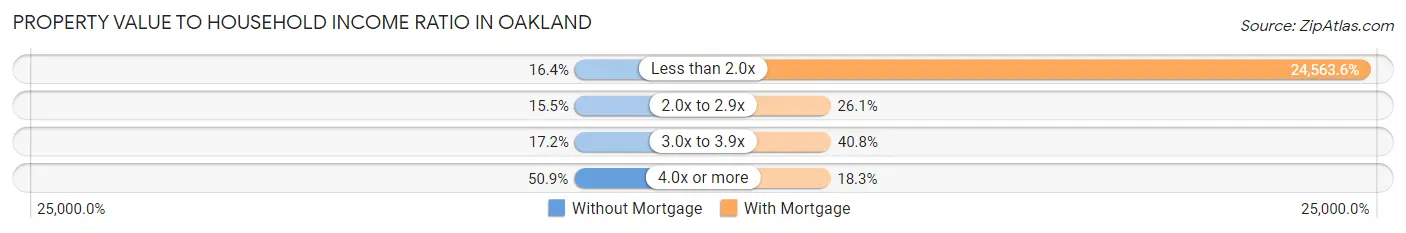
| Value-to-Income Ratio | Without Mortgage | With Mortgage |
| Less than 2.0x | 19 (16.4%) | 88,429 (24,563.6%) |
| 2.0x to 2.9x | 18 (15.5%) | 94 (26.1%) |
| 3.0x to 3.9x | 20 (17.2%) | 147 (40.8%) |
| 4.0x or more | 59 (50.9%) | 66 (18.3%) |
| Total | 116 (100.0%) | 360 (100.0%) |
Real Estate Taxes by Mortgage Status in Oakland
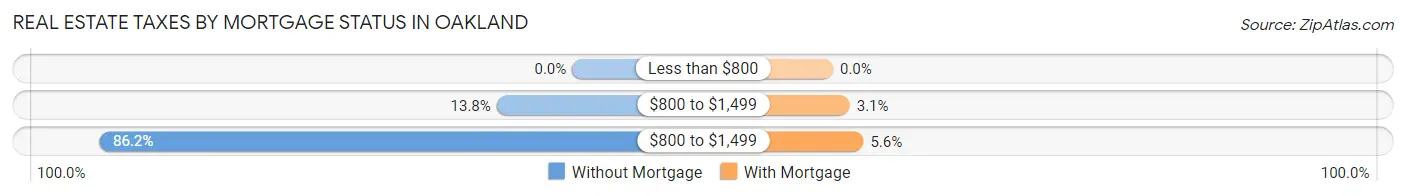
| Property Taxes | Without Mortgage | With Mortgage |
| Less than $800 | 0 (0.0%) | 0 (0.0%) |
| $800 to $1,499 | 16 (13.8%) | 11 (3.1%) |
| $800 to $1,499 | 100 (86.2%) | 20 (5.6%) |
| Total | 116 (100.0%) | 360 (100.0%) |
Health & Disability in Oakland
Health Insurance Coverage by Age in Oakland
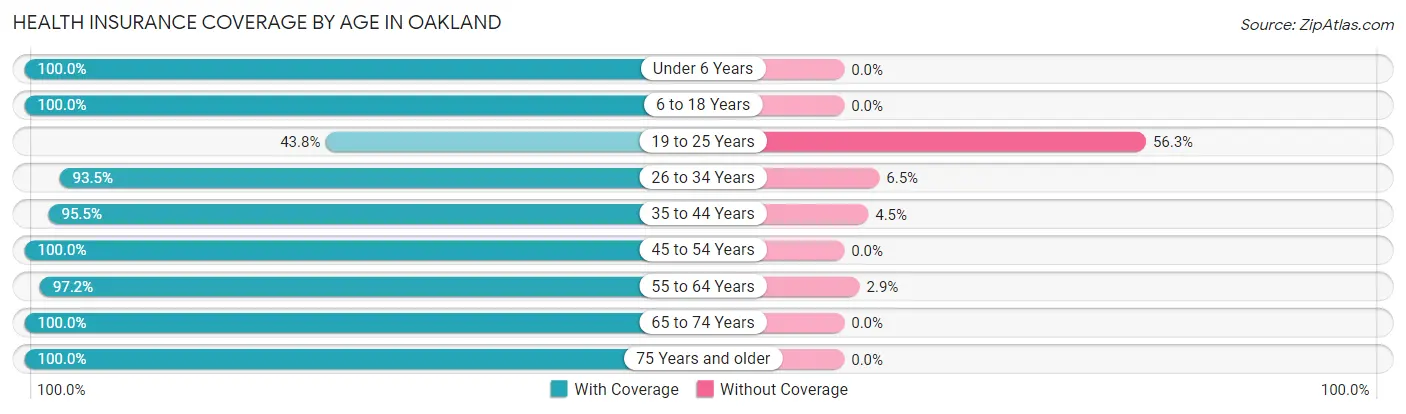
| Age Bracket | With Coverage | Without Coverage |
| Under 6 Years | 119 (100.0%) | 0 (0.0%) |
| 6 to 18 Years | 236 (100.0%) | 0 (0.0%) |
| 19 to 25 Years | 28 (43.8%) | 36 (56.2%) |
| 26 to 34 Years | 243 (93.5%) | 17 (6.5%) |
| 35 to 44 Years | 171 (95.5%) | 8 (4.5%) |
| 45 to 54 Years | 193 (100.0%) | 0 (0.0%) |
| 55 to 64 Years | 307 (97.2%) | 9 (2.9%) |
| 65 to 74 Years | 276 (100.0%) | 0 (0.0%) |
| 75 Years and older | 230 (100.0%) | 0 (0.0%) |
| Total | 1,803 (96.3%) | 70 (3.7%) |
Health Insurance Coverage by Citizenship Status in Oakland
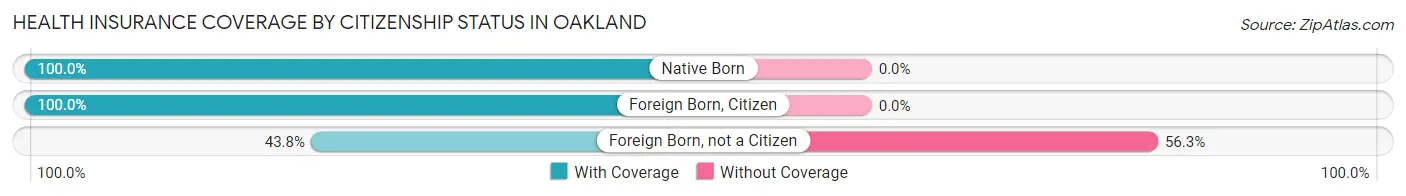
| Citizenship Status | With Coverage | Without Coverage |
| Native Born | 119 (100.0%) | 0 (0.0%) |
| Foreign Born, Citizen | 236 (100.0%) | 0 (0.0%) |
| Foreign Born, not a Citizen | 28 (43.8%) | 36 (56.2%) |
Health Insurance Coverage by Household Income in Oakland
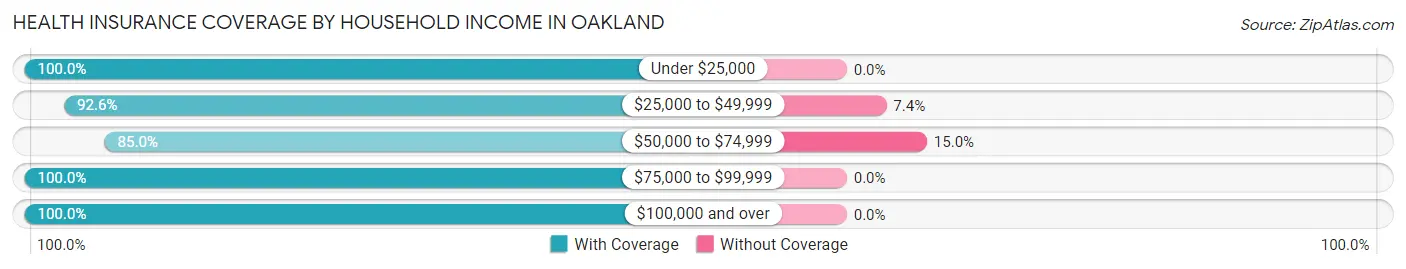
| Household Income | With Coverage | Without Coverage |
| Under $25,000 | 332 (100.0%) | 0 (0.0%) |
| $25,000 to $49,999 | 212 (92.6%) | 17 (7.4%) |
| $50,000 to $74,999 | 300 (85.0%) | 53 (15.0%) |
| $75,000 to $99,999 | 304 (100.0%) | 0 (0.0%) |
| $100,000 and over | 615 (100.0%) | 0 (0.0%) |
Public vs Private Health Insurance Coverage by Age in Oakland
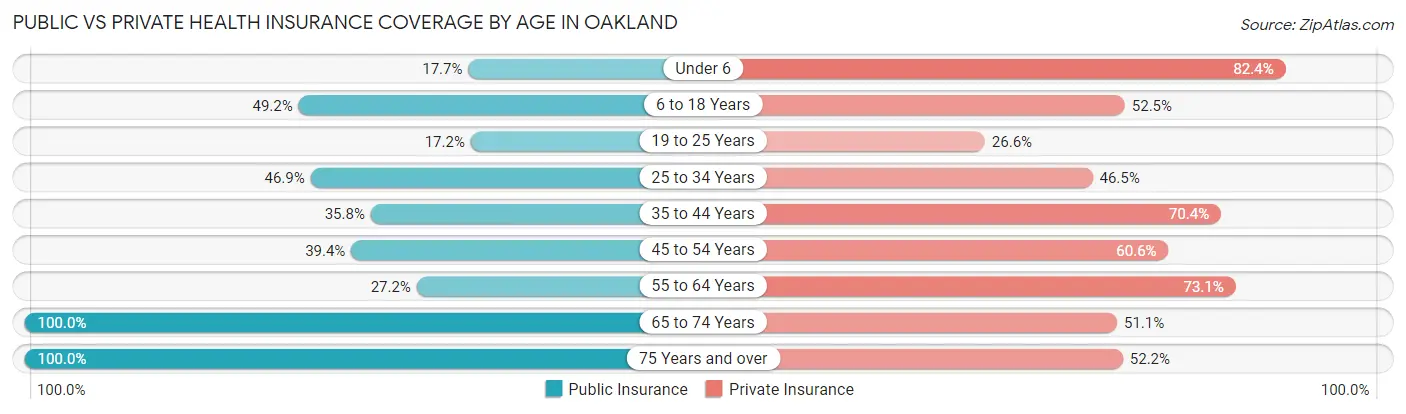
| Age Bracket | Public Insurance | Private Insurance |
| Under 6 | 21 (17.6%) | 98 (82.4%) |
| 6 to 18 Years | 116 (49.1%) | 124 (52.5%) |
| 19 to 25 Years | 11 (17.2%) | 17 (26.6%) |
| 25 to 34 Years | 122 (46.9%) | 121 (46.5%) |
| 35 to 44 Years | 64 (35.7%) | 126 (70.4%) |
| 45 to 54 Years | 76 (39.4%) | 117 (60.6%) |
| 55 to 64 Years | 86 (27.2%) | 231 (73.1%) |
| 65 to 74 Years | 276 (100.0%) | 141 (51.1%) |
| 75 Years and over | 230 (100.0%) | 120 (52.2%) |
| Total | 1,002 (53.5%) | 1,095 (58.5%) |
Disability Status by Sex by Age in Oakland
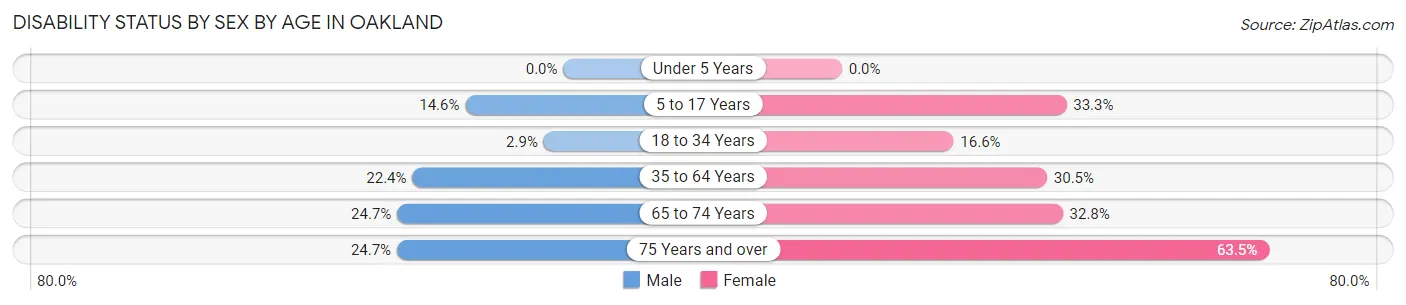
| Age Bracket | Male | Female |
| Under 5 Years | 0 (0.0%) | 0 (0.0%) |
| 5 to 17 Years | 23 (14.6%) | 23 (33.3%) |
| 18 to 34 Years | 5 (2.9%) | 29 (16.6%) |
| 35 to 64 Years | 74 (22.4%) | 109 (30.4%) |
| 65 to 74 Years | 38 (24.7%) | 40 (32.8%) |
| 75 Years and over | 21 (24.7%) | 92 (63.4%) |
Disability Class by Sex by Age in Oakland
Disability Class: Hearing Difficulty
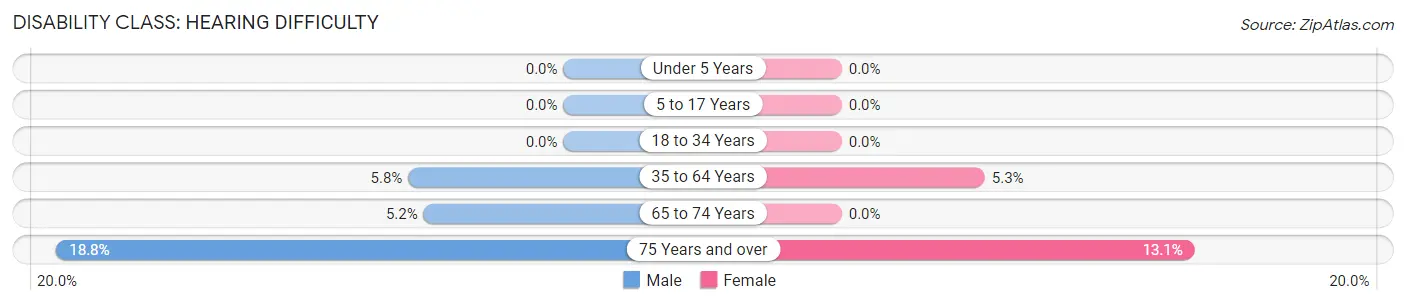
| Age Bracket | Male | Female |
| Under 5 Years | 0 (0.0%) | 0 (0.0%) |
| 5 to 17 Years | 0 (0.0%) | 0 (0.0%) |
| 18 to 34 Years | 0 (0.0%) | 0 (0.0%) |
| 35 to 64 Years | 19 (5.8%) | 19 (5.3%) |
| 65 to 74 Years | 8 (5.2%) | 0 (0.0%) |
| 75 Years and over | 16 (18.8%) | 19 (13.1%) |
Disability Class: Vision Difficulty
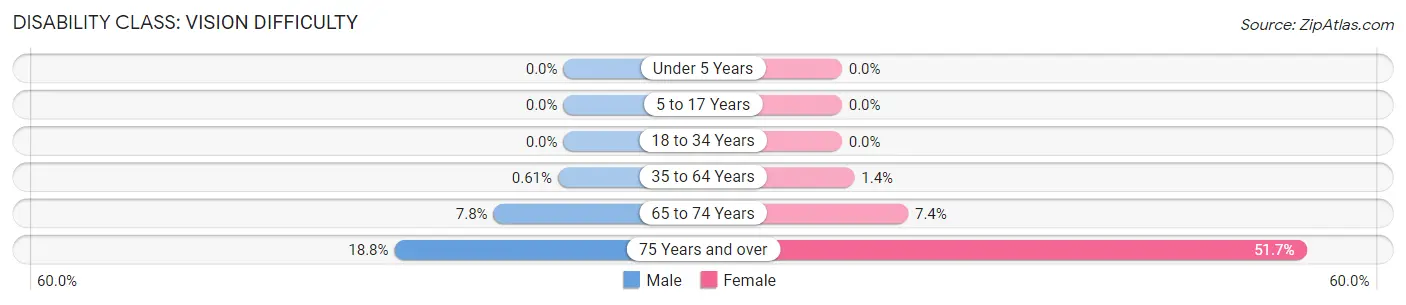
| Age Bracket | Male | Female |
| Under 5 Years | 0 (0.0%) | 0 (0.0%) |
| 5 to 17 Years | 0 (0.0%) | 0 (0.0%) |
| 18 to 34 Years | 0 (0.0%) | 0 (0.0%) |
| 35 to 64 Years | 2 (0.6%) | 5 (1.4%) |
| 65 to 74 Years | 12 (7.8%) | 9 (7.4%) |
| 75 Years and over | 16 (18.8%) | 75 (51.7%) |
Disability Class: Cognitive Difficulty
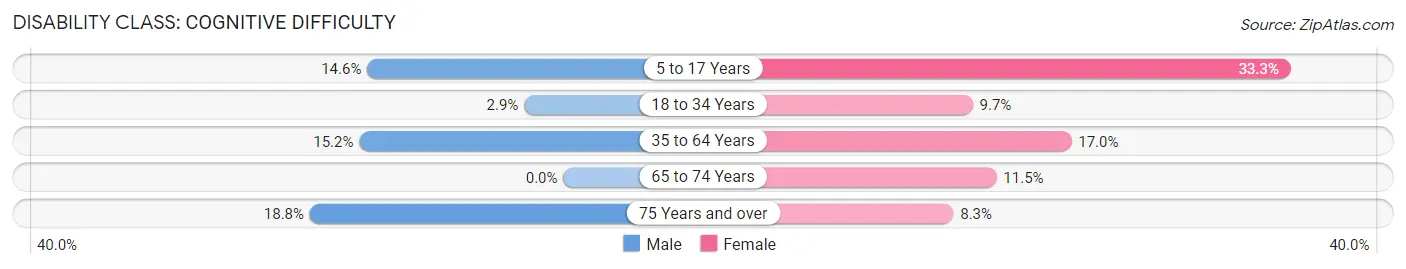
| Age Bracket | Male | Female |
| 5 to 17 Years | 23 (14.6%) | 23 (33.3%) |
| 18 to 34 Years | 5 (2.9%) | 17 (9.7%) |
| 35 to 64 Years | 50 (15.1%) | 61 (17.0%) |
| 65 to 74 Years | 0 (0.0%) | 14 (11.5%) |
| 75 Years and over | 16 (18.8%) | 12 (8.3%) |
Disability Class: Ambulatory Difficulty
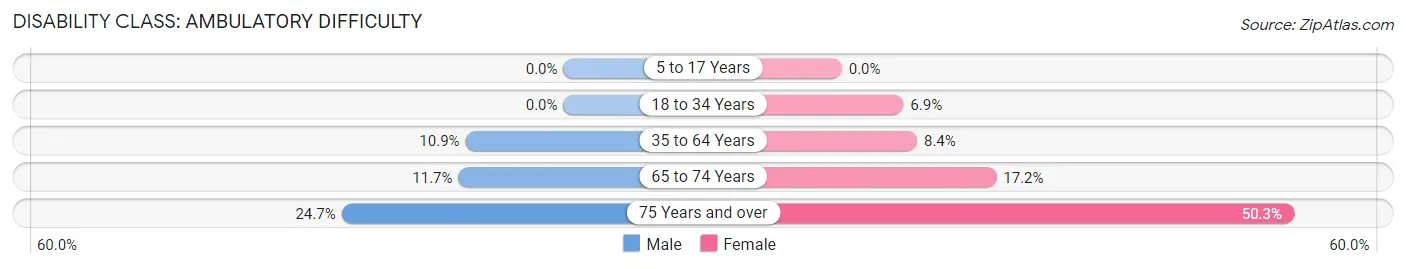
| Age Bracket | Male | Female |
| 5 to 17 Years | 0 (0.0%) | 0 (0.0%) |
| 18 to 34 Years | 0 (0.0%) | 12 (6.9%) |
| 35 to 64 Years | 36 (10.9%) | 30 (8.4%) |
| 65 to 74 Years | 18 (11.7%) | 21 (17.2%) |
| 75 Years and over | 21 (24.7%) | 73 (50.3%) |
Disability Class: Self-Care Difficulty
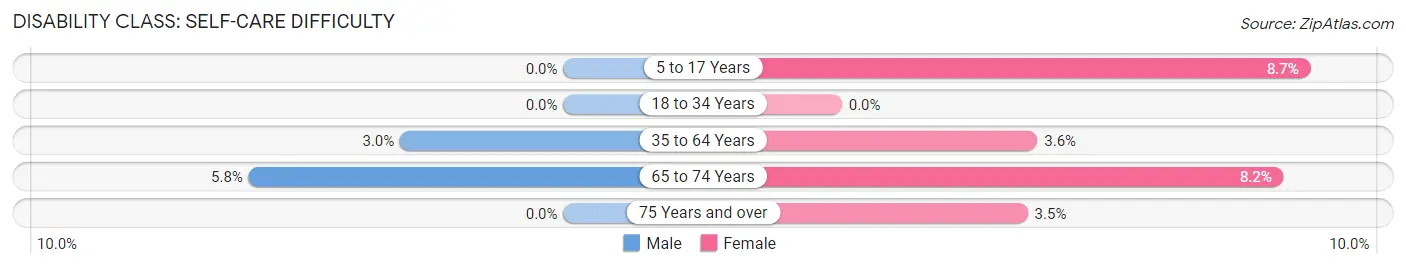
| Age Bracket | Male | Female |
| 5 to 17 Years | 0 (0.0%) | 6 (8.7%) |
| 18 to 34 Years | 0 (0.0%) | 0 (0.0%) |
| 35 to 64 Years | 10 (3.0%) | 13 (3.6%) |
| 65 to 74 Years | 9 (5.8%) | 10 (8.2%) |
| 75 Years and over | 0 (0.0%) | 5 (3.5%) |
Technology Access in Oakland
Computing Device Access in Oakland
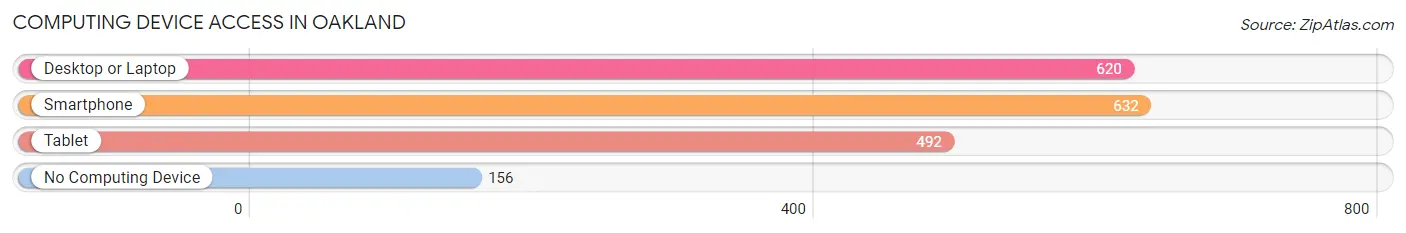
| Device Type | # Households | % Households |
| Desktop or Laptop | 620 | 68.7% |
| Smartphone | 632 | 70.1% |
| Tablet | 492 | 54.5% |
| No Computing Device | 156 | 17.3% |
| Total | 902 | 100.0% |
Internet Access in Oakland
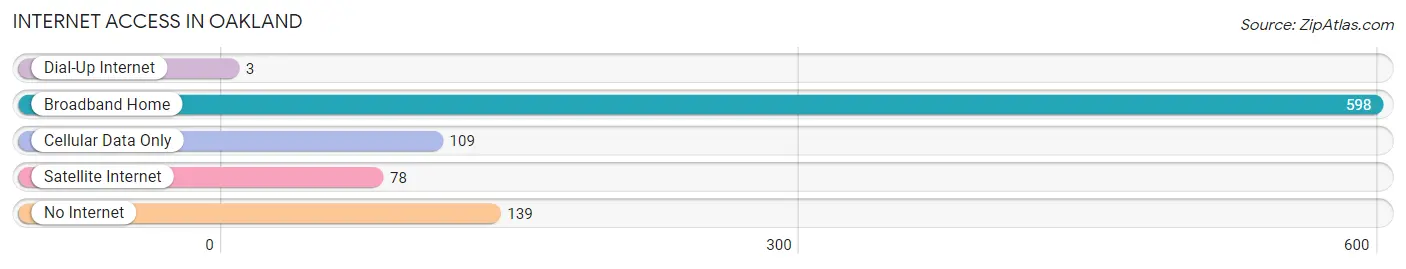
| Internet Type | # Households | % Households |
| Dial-Up Internet | 3 | 0.3% |
| Broadband Home | 598 | 66.3% |
| Cellular Data Only | 109 | 12.1% |
| Satellite Internet | 78 | 8.6% |
| No Internet | 139 | 15.4% |
| Total | 902 | 100.0% |
Oakland Summary
Oakland, Maryland is a small town located in the Appalachian Mountains of Garrett County. It is the county seat of Garrett County and is the largest town in the county. The town is situated in a valley surrounded by mountains and is located at the intersection of US Route 219 and Maryland Route 135. The population of Oakland was 2,030 at the 2010 census.
History
Oakland was founded in 1851 by a group of settlers from Pennsylvania. The town was named after the oak trees that grew in the area. The town was incorporated in 1872 and was the first town in Garrett County to be incorporated.
Oakland was an important stop on the Baltimore and Ohio Railroad. The railroad was built in 1851 and ran through Oakland until it was abandoned in 1972. The railroad was a major factor in the growth of Oakland and the surrounding area.
Oakland was also an important stop on the National Road, which was the first federally funded highway in the United States. The National Road was built in 1811 and ran through Oakland until it was replaced by US Route 40 in the 1930s.
Geography
Oakland is located in the Appalachian Mountains of Garrett County. The town is situated in a valley surrounded by mountains and is located at the intersection of US Route 219 and Maryland Route 135. The town is located at an elevation of 1,845 feet (562 m).
The town is located in a temperate climate zone and has four distinct seasons. Summers are warm and humid with temperatures reaching into the 80s (Fahrenheit). Winters are cold and snowy with temperatures reaching into the teens (Fahrenheit).
Economy
Oakland is a small town with a limited economy. The town is home to several small businesses, including restaurants, retail stores, and professional services. The town is also home to a number of small manufacturing companies.
The town is also home to a number of tourist attractions, including the Garrett County Historical Society Museum, the Garrett County Arts Council, and the Garrett County Fairgrounds.
Demographics
As of the 2010 census, the population of Oakland was 2,030. The racial makeup of the town was 95.3% White, 1.2% African American, 0.4% Native American, 0.7% Asian, 0.1% Pacific Islander, 0.7% from other races, and 1.7% from two or more races. Hispanic or Latino of any race were 2.2% of the population.
The median income for a household in Oakland was $37,917, and the median income for a family was $45,625. The per capita income for the town was $19,945. About 11.2% of families and 14.2% of the population were below the poverty line, including 18.2% of those under age 18 and 8.3% of those age 65 or over.
Common Questions
What is Per Capita Income in Oakland?
Per Capita income in Oakland is $35,092.
What is the Median Family Income in Oakland?
Median Family Income in Oakland is $78,661.
What is the Median Household income in Oakland?
Median Household Income in Oakland is $61,568.
What is Income or Wage Gap in Oakland?
Income or Wage Gap in Oakland is 5.7%.
Women in Oakland earn 94.3 cents for every dollar earned by a man.
What is Family Income Deficit in Oakland?
Family Income Deficit in Oakland is $8,470.
Families that are below poverty line in Oakland earn $8,470 less on average than the poverty threshold level.
What is Inequality or Gini Index in Oakland?
Inequality or Gini Index in Oakland is 0.43.
What is the Total Population of Oakland?
Total Population of Oakland is 1,995.
What is the Total Male Population of Oakland?
Total Male Population of Oakland is 1,047.
What is the Total Female Population of Oakland?
Total Female Population of Oakland is 948.
What is the Ratio of Males per 100 Females in Oakland?
There are 110.44 Males per 100 Females in Oakland.
What is the Ratio of Females per 100 Males in Oakland?
There are 90.54 Females per 100 Males in Oakland.
What is the Median Population Age in Oakland?
Median Population Age in Oakland is 50.2 Years.
What is the Average Family Size in Oakland
Average Family Size in Oakland is 3.0 People.
What is the Average Household Size in Oakland
Average Household Size in Oakland is 2.0 People.
How Large is the Labor Force in Oakland?
There are 880 People in the Labor Forcein in Oakland.
What is the Percentage of People in the Labor Force in Oakland?
51.8% of People are in the Labor Force in Oakland.
What is the Unemployment Rate in Oakland?
Unemployment Rate in Oakland is 2.0%.