Perryman, MD Map & Demographics
Perryman Map
Perryman Overview
$30,713
PER CAPITA INCOME
$70,000
AVG FAMILY INCOME
$48,158
AVG HOUSEHOLD INCOME
8.1%
WAGE / INCOME GAP [ % ]
91.9¢/ $1
WAGE / INCOME GAP [ $ ]
0.52
INEQUALITY / GINI INDEX
2,403
TOTAL POPULATION
1,184
MALE POPULATION
1,219
FEMALE POPULATION
97.13
MALES / 100 FEMALES
102.96
FEMALES / 100 MALES
31.5
MEDIAN AGE
2.8
AVG FAMILY SIZE
2.2
AVG HOUSEHOLD SIZE
1,155
LABOR FORCE [ PEOPLE ]
64.0%
PERCENT IN LABOR FORCE
19.7%
UNEMPLOYMENT RATE
Perryman Zip Codes
Perryman Area Codes
Income in Perryman
Income Overview in Perryman
Per Capita Income in Perryman is $30,713, while median incomes of families and households are $70,000 and $48,158 respectively.
| Characteristic | Number | Measure |
| Per Capita Income | 2,403 | $30,713 |
| Median Family Income | 692 | $70,000 |
| Mean Family Income | 692 | $77,602 |
| Median Household Income | 1,062 | $48,158 |
| Mean Household Income | 1,062 | $66,662 |
| Income Deficit | 692 | $0 |
| Wage / Income Gap (%) | 2,403 | 8.07% |
| Wage / Income Gap ($) | 2,403 | 91.93¢ per $1 |
| Gini / Inequality Index | 2,403 | 0.52 |
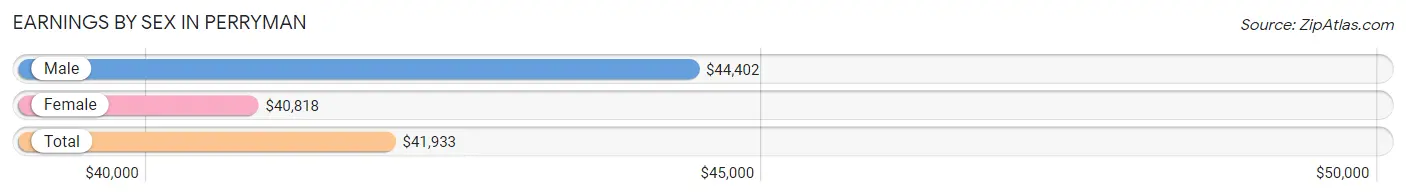
Earnings by Sex in Perryman
Average Earnings in Perryman are $41,933, $44,402 for men and $40,818 for women, a difference of 8.1%.
| Sex | Number | Average Earnings |
| Male | 535 (49.3%) | $44,402 |
| Female | 550 (50.7%) | $40,818 |
| Total | 1,085 (100.0%) | $41,933 |
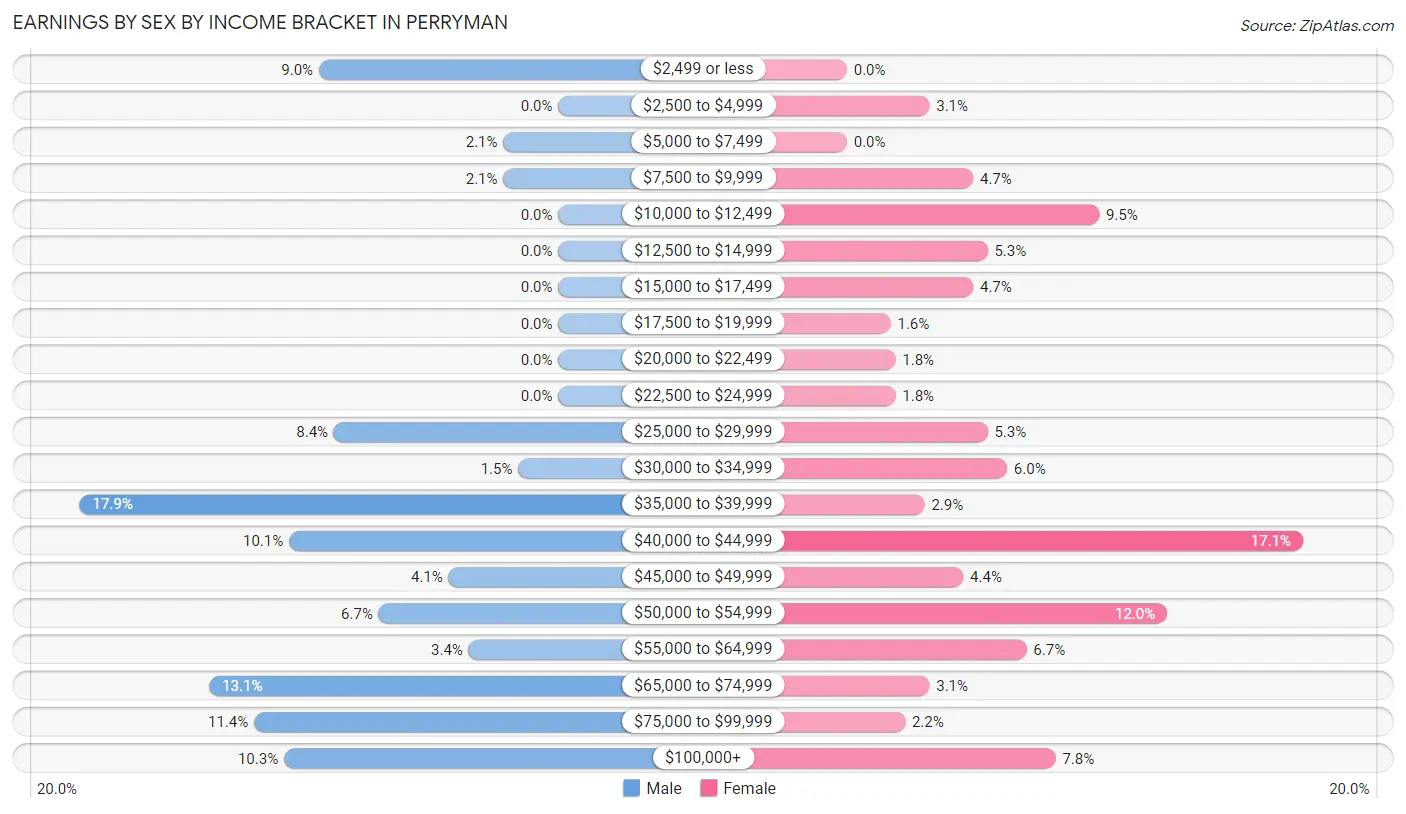
Earnings by Sex by Income Bracket in Perryman
The most common earnings brackets in Perryman are $35,000 to $39,999 for men (96 | 17.9%) and $40,000 to $44,999 for women (94 | 17.1%).
| Income | Male | Female |
| $2,499 or less | 48 (9.0%) | 0 (0.0%) |
| $2,500 to $4,999 | 0 (0.0%) | 17 (3.1%) |
| $5,000 to $7,499 | 11 (2.1%) | 0 (0.0%) |
| $7,500 to $9,999 | 11 (2.1%) | 26 (4.7%) |
| $10,000 to $12,499 | 0 (0.0%) | 52 (9.5%) |
| $12,500 to $14,999 | 0 (0.0%) | 29 (5.3%) |
| $15,000 to $17,499 | 0 (0.0%) | 26 (4.7%) |
| $17,500 to $19,999 | 0 (0.0%) | 9 (1.6%) |
| $20,000 to $22,499 | 0 (0.0%) | 10 (1.8%) |
| $22,500 to $24,999 | 0 (0.0%) | 10 (1.8%) |
| $25,000 to $29,999 | 45 (8.4%) | 29 (5.3%) |
| $30,000 to $34,999 | 8 (1.5%) | 33 (6.0%) |
| $35,000 to $39,999 | 96 (17.9%) | 16 (2.9%) |
| $40,000 to $44,999 | 54 (10.1%) | 94 (17.1%) |
| $45,000 to $49,999 | 22 (4.1%) | 24 (4.4%) |
| $50,000 to $54,999 | 36 (6.7%) | 66 (12.0%) |
| $55,000 to $64,999 | 18 (3.4%) | 37 (6.7%) |
| $65,000 to $74,999 | 70 (13.1%) | 17 (3.1%) |
| $75,000 to $99,999 | 61 (11.4%) | 12 (2.2%) |
| $100,000+ | 55 (10.3%) | 43 (7.8%) |
| Total | 535 (100.0%) | 550 (100.0%) |
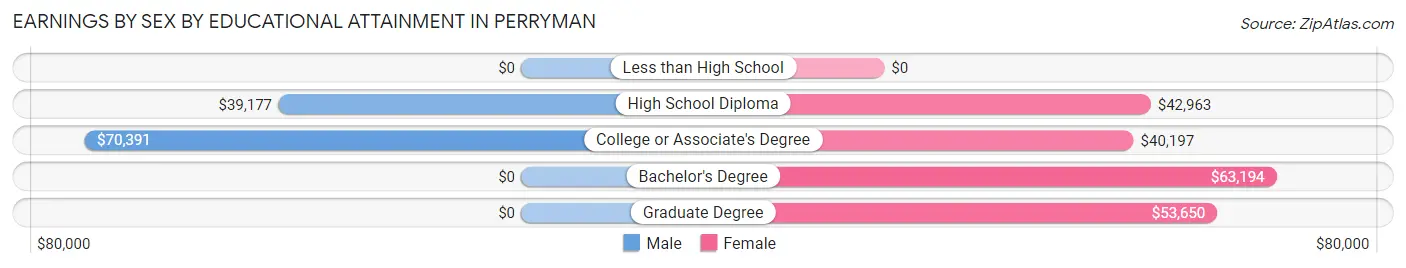
Earnings by Sex by Educational Attainment in Perryman
Average earnings in Perryman are $53,333 for men and $41,795 for women, a difference of 21.6%. Men with an educational attainment of college or associate's degree enjoy the highest average annual earnings of $70,391, while those with high school diploma education earn the least with $39,177. Women with an educational attainment of bachelor's degree earn the most with the average annual earnings of $63,194, while those with college or associate's degree education have the smallest earnings of $40,197.
| Educational Attainment | Male Income | Female Income |
| Less than High School | - | - |
| High School Diploma | $39,177 | $42,963 |
| College or Associate's Degree | $70,391 | $40,197 |
| Bachelor's Degree | - | - |
| Graduate Degree | - | - |
| Total | $53,333 | $41,795 |
Family Income in Perryman
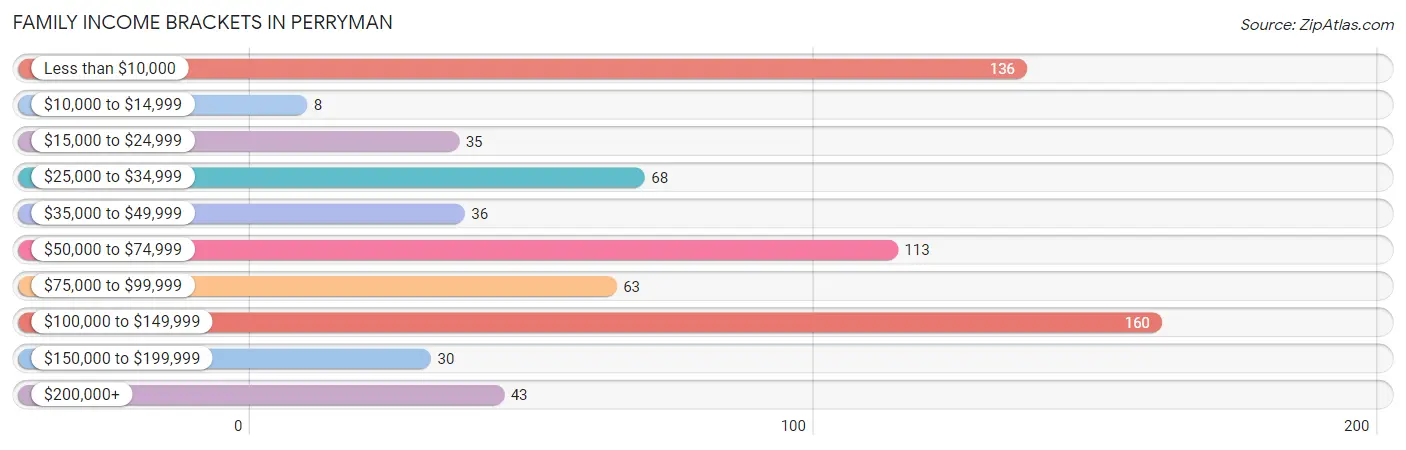
Family Income Brackets in Perryman
According to the Perryman family income data, there are 160 families falling into the $100,000 to $149,999 income range, which is the most common income bracket and makes up 23.1% of all families. Conversely, the $10,000 to $14,999 income bracket is the least frequent group with only 8 families (1.2%) belonging to this category.
| Income Bracket | # Families | % Families |
| Less than $10,000 | 136 | 19.7% |
| $10,000 to $14,999 | 8 | 1.2% |
| $15,000 to $24,999 | 35 | 5.1% |
| $25,000 to $34,999 | 68 | 9.8% |
| $35,000 to $49,999 | 36 | 5.2% |
| $50,000 to $74,999 | 113 | 16.3% |
| $75,000 to $99,999 | 63 | 9.1% |
| $100,000 to $149,999 | 160 | 23.1% |
| $150,000 to $199,999 | 30 | 4.3% |
| $200,000+ | 43 | 6.2% |
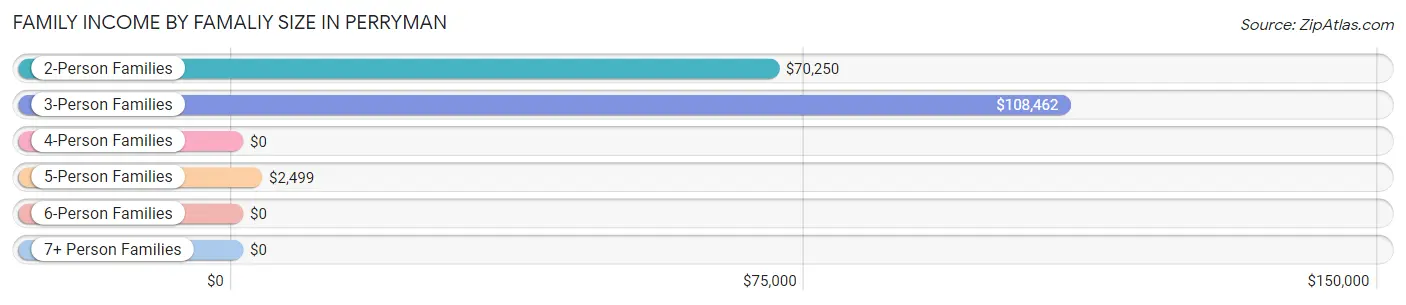
Family Income by Famaliy Size in Perryman
3-person families (222 | 32.1%) account for the highest median family income in Perryman with $108,462 per family, while 3-person families (222 | 32.1%) have the highest median income of $36,154 per family member.
| Income Bracket | # Families | Median Income |
| 2-Person Families | 350 (50.6%) | $70,250 |
| 3-Person Families | 222 (32.1%) | $108,462 |
| 4-Person Families | 56 (8.1%) | $0 |
| 5-Person Families | 64 (9.2%) | $2,499 |
| 6-Person Families | 0 (0.0%) | $0 |
| 7+ Person Families | 0 (0.0%) | $0 |
| Total | 692 (100.0%) | $70,000 |
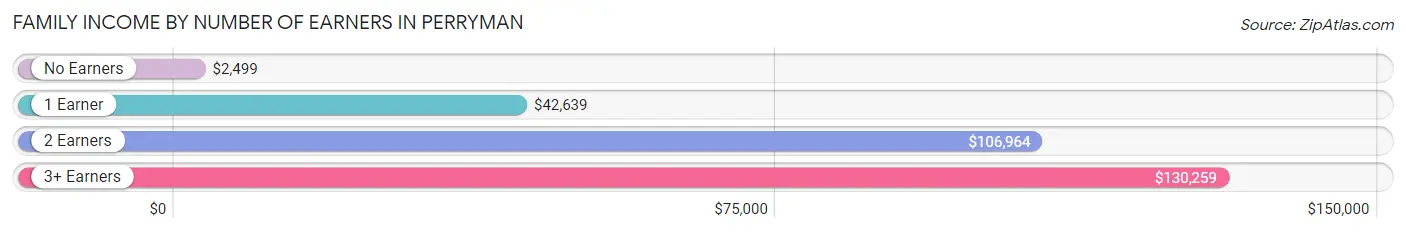
Family Income by Number of Earners in Perryman
The median family income in Perryman is $70,000, with families comprising 3+ earners (76) having the highest median family income of $130,259, while families with no earners (186) have the lowest median family income of $2,499, accounting for 11.0% and 26.9% of families, respectively.
| Number of Earners | # Families | Median Income |
| No Earners | 186 (26.9%) | $2,499 |
| 1 Earner | 295 (42.6%) | $42,639 |
| 2 Earners | 135 (19.5%) | $106,964 |
| 3+ Earners | 76 (11.0%) | $130,259 |
| Total | 692 (100.0%) | $70,000 |
Household Income in Perryman
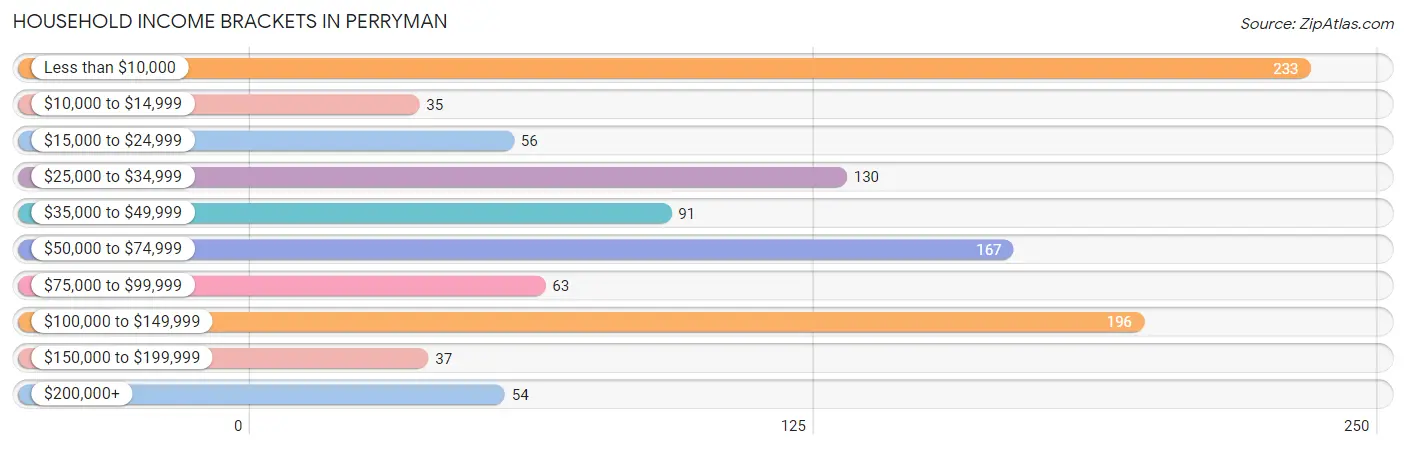
Household Income Brackets in Perryman
With 233 households falling in the category, the less than $10,000 income range is the most frequent in Perryman, accounting for 21.9% of all households. In contrast, only 35 households (3.3%) fall into the $10,000 to $14,999 income bracket, making it the least populous group.
| Income Bracket | # Households | % Households |
| Less than $10,000 | 233 | 21.9% |
| $10,000 to $14,999 | 35 | 3.3% |
| $15,000 to $24,999 | 56 | 5.3% |
| $25,000 to $34,999 | 130 | 12.2% |
| $35,000 to $49,999 | 91 | 8.6% |
| $50,000 to $74,999 | 167 | 15.7% |
| $75,000 to $99,999 | 63 | 5.9% |
| $100,000 to $149,999 | 196 | 18.5% |
| $150,000 to $199,999 | 37 | 3.5% |
| $200,000+ | 54 | 5.1% |
Household Income by Householder Age in Perryman
The median household income in Perryman is $48,158, with the highest median household income of $88,984 found in the 45 to 64 years age bracket for the primary householder. A total of 359 households (33.8%) fall into this category. Meanwhile, the 15 to 24 years age bracket for the primary householder has the lowest median household income of $2,499, with 60 households (5.7%) in this group.
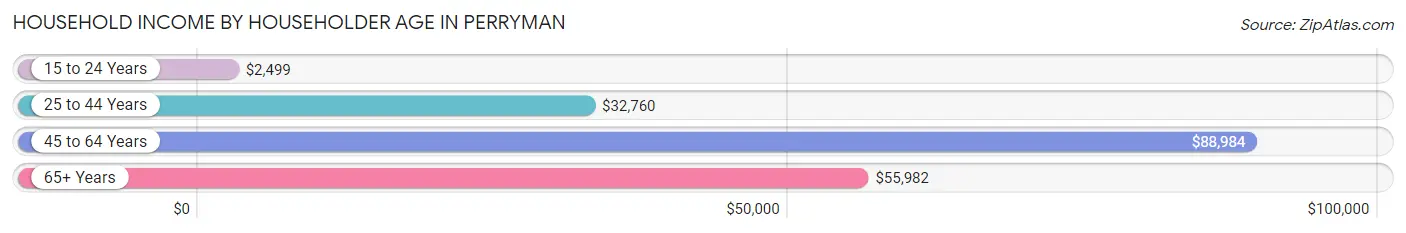
| Income Bracket | # Households | Median Income |
| 15 to 24 Years | 60 (5.7%) | $2,499 |
| 25 to 44 Years | 426 (40.1%) | $32,760 |
| 45 to 64 Years | 359 (33.8%) | $88,984 |
| 65+ Years | 217 (20.4%) | $55,982 |
| Total | 1,062 (100.0%) | $48,158 |
Poverty in Perryman
Income Below Poverty by Sex and Age in Perryman
With 28.5% poverty level for males and 32.0% for females among the residents of Perryman, under 5 year old males and 16 and 17 year old females are the most vulnerable to poverty, with 46 males (76.7%) and 9 females (100.0%) in their respective age groups living below the poverty level.
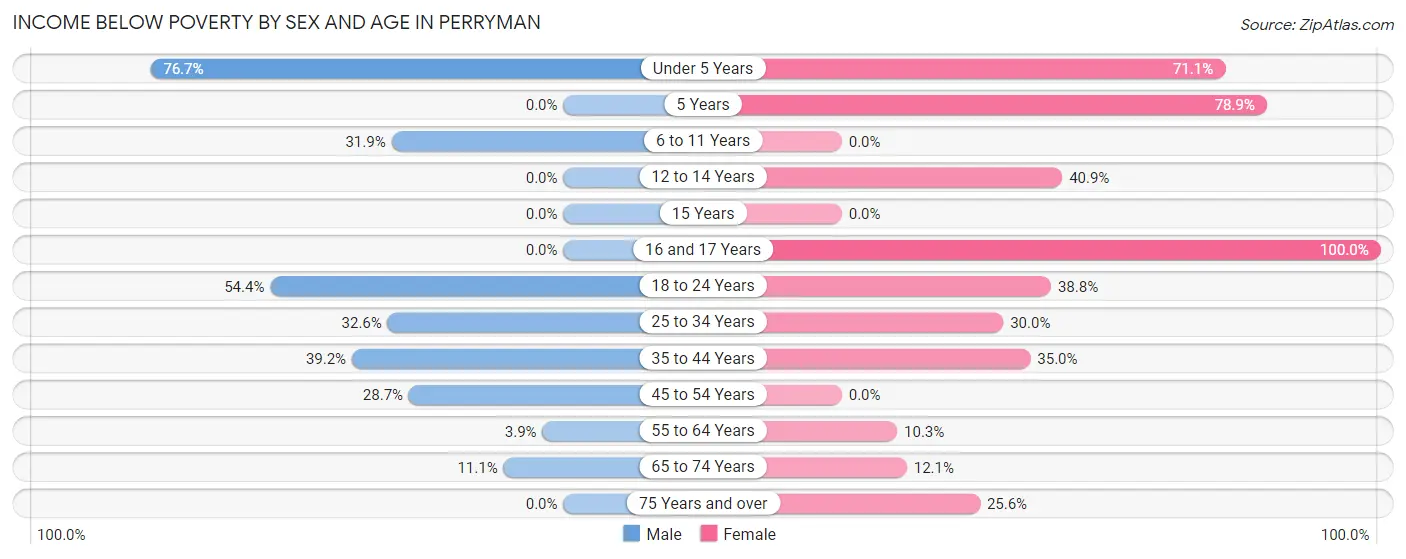
| Age Bracket | Male | Female |
| Under 5 Years | 46 (76.7%) | 101 (71.1%) |
| 5 Years | 0 (0.0%) | 56 (78.9%) |
| 6 to 11 Years | 74 (31.9%) | 0 (0.0%) |
| 12 to 14 Years | 0 (0.0%) | 9 (40.9%) |
| 15 Years | 0 (0.0%) | 0 (0.0%) |
| 16 and 17 Years | 0 (0.0%) | 9 (100.0%) |
| 18 to 24 Years | 37 (54.4%) | 40 (38.8%) |
| 25 to 34 Years | 92 (32.6%) | 101 (30.0%) |
| 35 to 44 Years | 31 (39.2%) | 14 (35.0%) |
| 45 to 54 Years | 43 (28.7%) | 0 (0.0%) |
| 55 to 64 Years | 4 (3.9%) | 19 (10.3%) |
| 65 to 74 Years | 10 (11.1%) | 7 (12.1%) |
| 75 Years and over | 0 (0.0%) | 30 (25.6%) |
| Total | 337 (28.5%) | 386 (32.0%) |
Income Above Poverty by Sex and Age in Perryman
According to the poverty statistics in Perryman, males aged 5 years and females aged 6 to 11 years are the age groups that are most secure financially, with 100.0% of males and 100.0% of females in these age groups living above the poverty line.
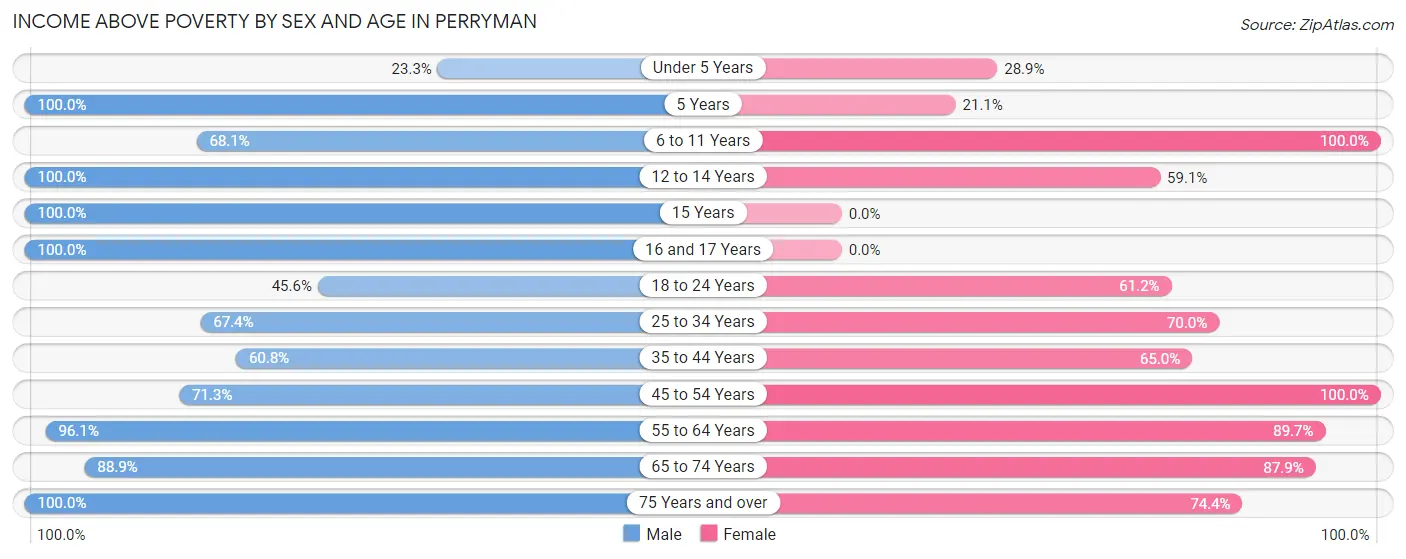
| Age Bracket | Male | Female |
| Under 5 Years | 14 (23.3%) | 41 (28.9%) |
| 5 Years | 12 (100.0%) | 15 (21.1%) |
| 6 to 11 Years | 158 (68.1%) | 16 (100.0%) |
| 12 to 14 Years | 27 (100.0%) | 13 (59.1%) |
| 15 Years | 17 (100.0%) | 0 (0.0%) |
| 16 and 17 Years | 11 (100.0%) | 0 (0.0%) |
| 18 to 24 Years | 31 (45.6%) | 63 (61.2%) |
| 25 to 34 Years | 190 (67.4%) | 236 (70.0%) |
| 35 to 44 Years | 48 (60.8%) | 26 (65.0%) |
| 45 to 54 Years | 107 (71.3%) | 108 (100.0%) |
| 55 to 64 Years | 99 (96.1%) | 166 (89.7%) |
| 65 to 74 Years | 80 (88.9%) | 51 (87.9%) |
| 75 Years and over | 53 (100.0%) | 87 (74.4%) |
| Total | 847 (71.5%) | 822 (68.0%) |
Income Below Poverty Among Married-Couple Families in Perryman
The poverty statistics for married-couple families in Perryman show that 14.8% or 52 of the total 352 families live below the poverty line. Families with 3 or 4 children have the highest poverty rate of 81.2%, comprising of 52 families. On the other hand, families with no children have the lowest poverty rate of 0.0%, which includes 0 families.
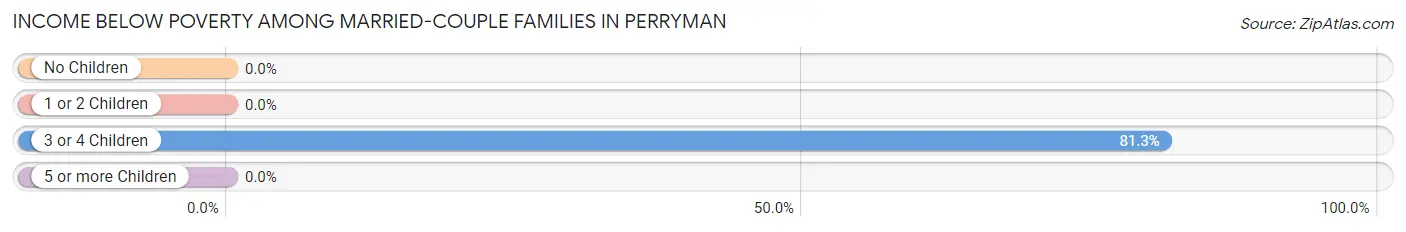
| Children | Above Poverty | Below Poverty |
| No Children | 228 (100.0%) | 0 (0.0%) |
| 1 or 2 Children | 60 (100.0%) | 0 (0.0%) |
| 3 or 4 Children | 12 (18.8%) | 52 (81.2%) |
| 5 or more Children | 0 (0.0%) | 0 (0.0%) |
| Total | 300 (85.2%) | 52 (14.8%) |
Income Below Poverty Among Single-Parent Households in Perryman
According to the poverty data in Perryman, 40.2% or 35 single-father households and 37.9% or 96 single-mother households are living below the poverty line. Among single-father households, those with no children have the highest poverty rate, with 35 households (40.2%) experiencing poverty. Likewise, among single-mother households, those with 1 or 2 children have the highest poverty rate, with 96 households (56.5%) falling below the poverty line.
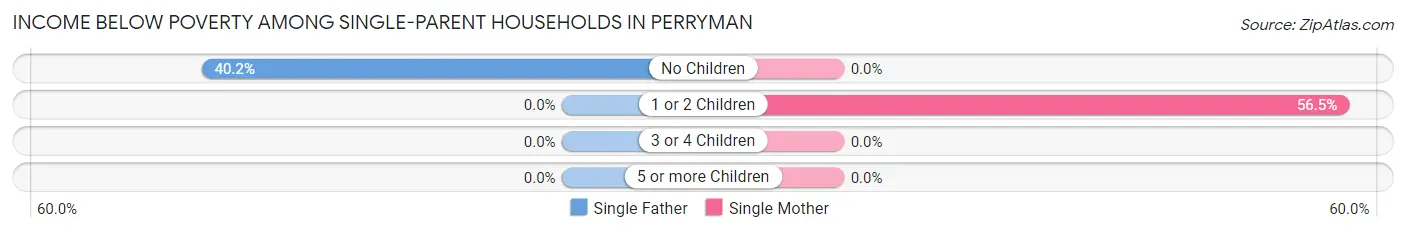
| Children | Single Father | Single Mother |
| No Children | 35 (40.2%) | 0 (0.0%) |
| 1 or 2 Children | 0 (0.0%) | 96 (56.5%) |
| 3 or 4 Children | 0 (0.0%) | 0 (0.0%) |
| 5 or more Children | 0 (0.0%) | 0 (0.0%) |
| Total | 35 (40.2%) | 96 (37.9%) |
Income Below Poverty Among Married-Couple vs Single-Parent Households in Perryman
The poverty data for Perryman shows that 52 of the married-couple family households (14.8%) and 131 of the single-parent households (38.5%) are living below the poverty level. Within the married-couple family households, those with 3 or 4 children have the highest poverty rate, with 52 households (81.2%) falling below the poverty line. Among the single-parent households, those with 1 or 2 children have the highest poverty rate, with 96 household (56.5%) living below poverty.
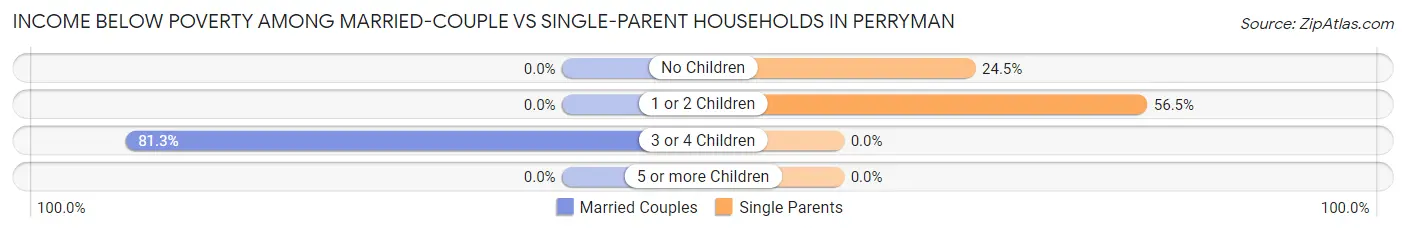
| Children | Married-Couple Families | Single-Parent Households |
| No Children | 0 (0.0%) | 35 (24.5%) |
| 1 or 2 Children | 0 (0.0%) | 96 (56.5%) |
| 3 or 4 Children | 52 (81.2%) | 0 (0.0%) |
| 5 or more Children | 0 (0.0%) | 0 (0.0%) |
| Total | 52 (14.8%) | 131 (38.5%) |
Race in Perryman
The most populous races in Perryman are White / Caucasian (1,334 | 55.5%), Black / African American (880 | 36.6%), and Hispanic or Latino (185 | 7.7%).
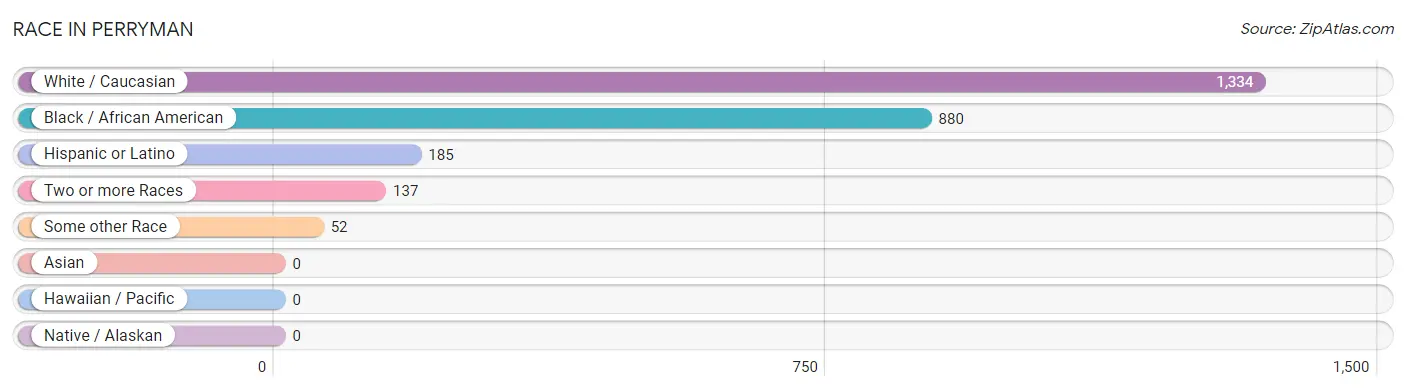
| Race | # Population | % Population |
| Asian | 0 | 0.0% |
| Black / African American | 880 | 36.6% |
| Hawaiian / Pacific | 0 | 0.0% |
| Hispanic or Latino | 185 | 7.7% |
| Native / Alaskan | 0 | 0.0% |
| White / Caucasian | 1,334 | 55.5% |
| Two or more Races | 137 | 5.7% |
| Some other Race | 52 | 2.2% |
| Total | 2,403 | 100.0% |
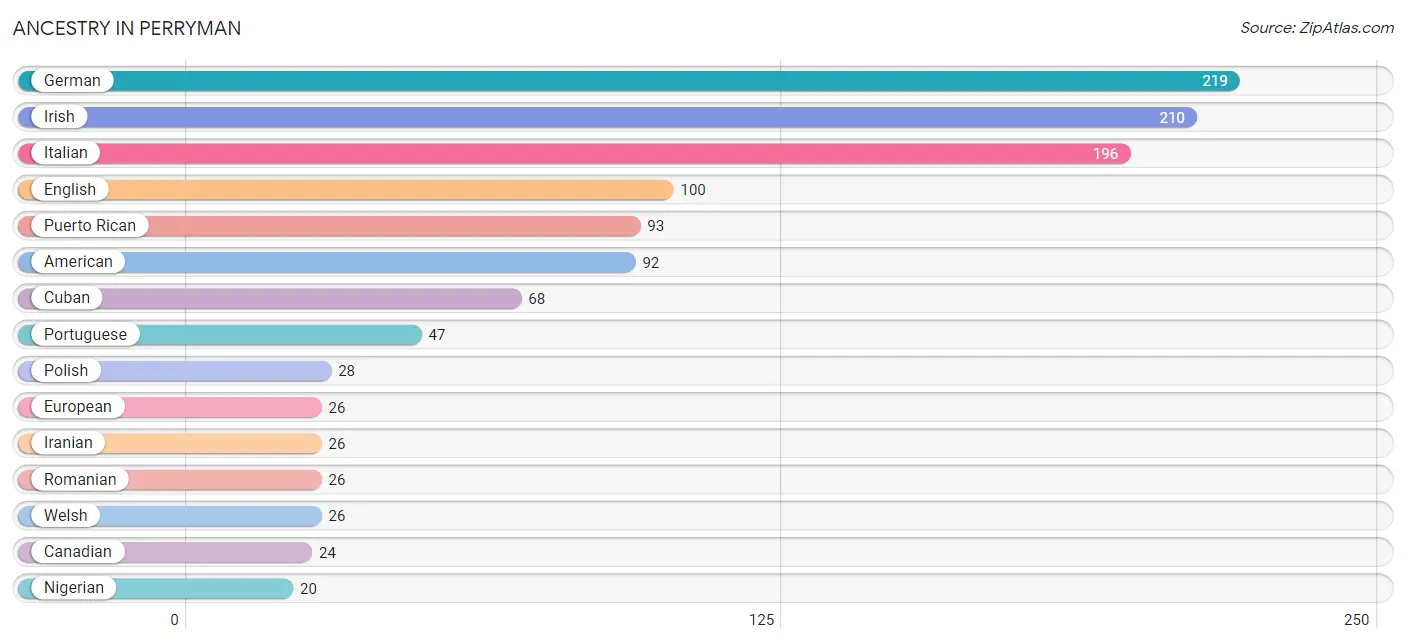
Ancestry in Perryman
The most populous ancestries reported in Perryman are German (219 | 9.1%), Irish (210 | 8.7%), Italian (196 | 8.2%), English (100 | 4.2%), and Puerto Rican (93 | 3.9%), together accounting for 34.0% of all Perryman residents.
| Ancestry | # Population | % Population |
| American | 92 | 3.8% |
| Austrian | 11 | 0.5% |
| British | 9 | 0.4% |
| Canadian | 24 | 1.0% |
| Central American | 14 | 0.6% |
| Cherokee | 7 | 0.3% |
| Croatian | 17 | 0.7% |
| Cuban | 68 | 2.8% |
| English | 100 | 4.2% |
| European | 26 | 1.1% |
| French | 8 | 0.3% |
| French Canadian | 12 | 0.5% |
| German | 219 | 9.1% |
| Honduran | 14 | 0.6% |
| Iranian | 26 | 1.1% |
| Irish | 210 | 8.7% |
| Italian | 196 | 8.2% |
| Jamaican | 12 | 0.5% |
| Nigerian | 20 | 0.8% |
| Pennsylvania German | 10 | 0.4% |
| Peruvian | 10 | 0.4% |
| Polish | 28 | 1.2% |
| Portuguese | 47 | 2.0% |
| Puerto Rican | 93 | 3.9% |
| Romanian | 26 | 1.1% |
| Scottish | 16 | 0.7% |
| South American | 10 | 0.4% |
| Subsaharan African | 20 | 0.8% |
| Swedish | 20 | 0.8% |
| Welsh | 26 | 1.1% | View All 30 Rows |
Immigrants in Perryman
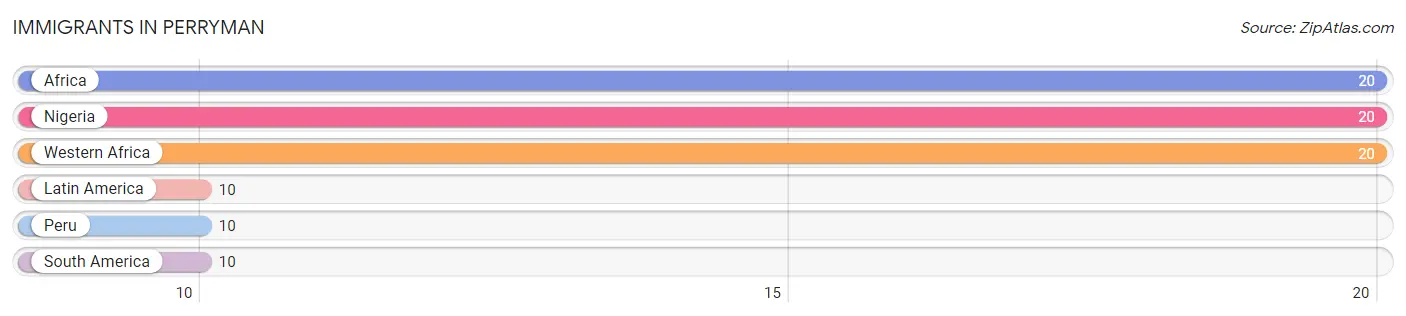
The most numerous immigrant groups reported in Perryman came from Africa (20 | 0.8%), Nigeria (20 | 0.8%), Western Africa (20 | 0.8%), Latin America (10 | 0.4%), and Peru (10 | 0.4%), together accounting for 3.3% of all Perryman residents.
| Immigration Origin | # Population | % Population |
| Africa | 20 | 0.8% |
| Latin America | 10 | 0.4% |
| Nigeria | 20 | 0.8% |
| Peru | 10 | 0.4% |
| South America | 10 | 0.4% |
| Western Africa | 20 | 0.8% | View All 6 Rows |
Sex and Age in Perryman
Sex and Age in Perryman
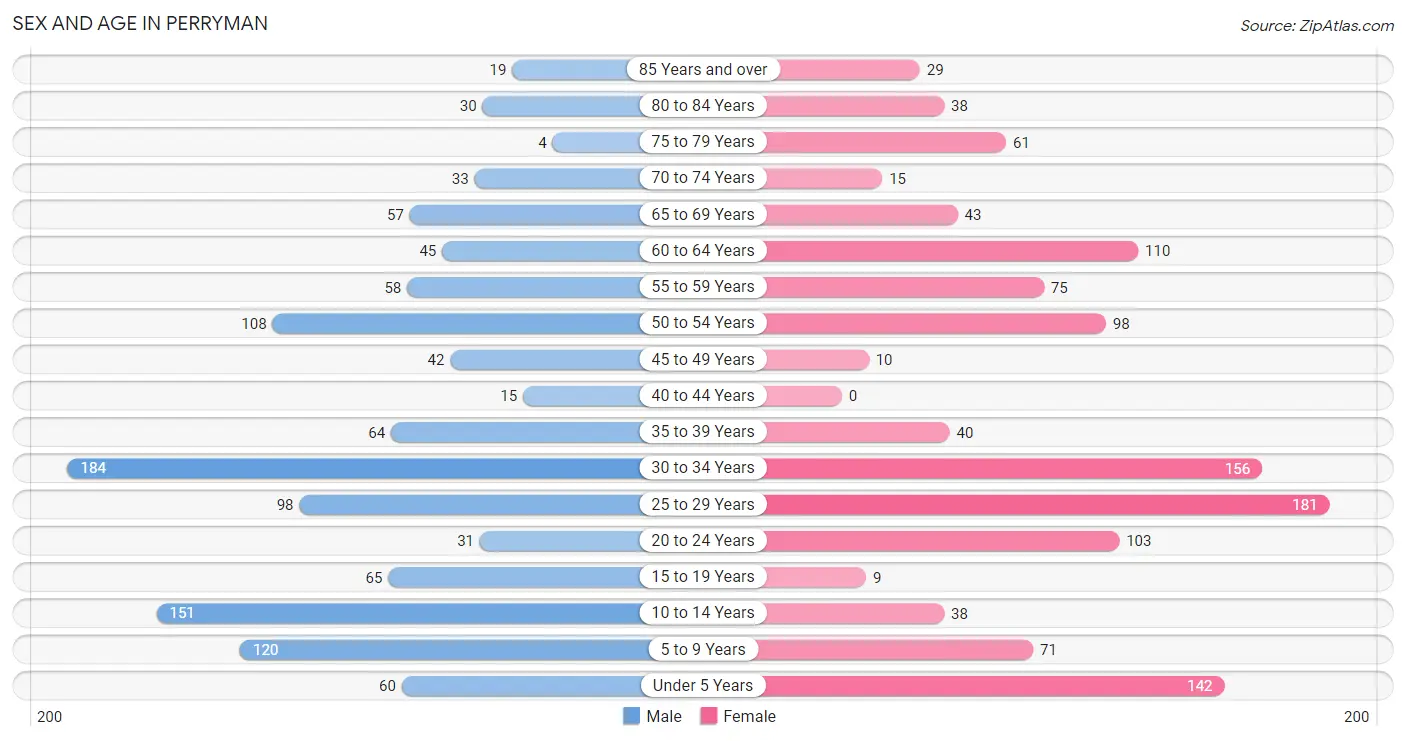
The most populous age groups in Perryman are 30 to 34 Years (184 | 15.5%) for men and 25 to 29 Years (181 | 14.8%) for women.
| Age Bracket | Male | Female |
| Under 5 Years | 60 (5.1%) | 142 (11.7%) |
| 5 to 9 Years | 120 (10.1%) | 71 (5.8%) |
| 10 to 14 Years | 151 (12.8%) | 38 (3.1%) |
| 15 to 19 Years | 65 (5.5%) | 9 (0.7%) |
| 20 to 24 Years | 31 (2.6%) | 103 (8.5%) |
| 25 to 29 Years | 98 (8.3%) | 181 (14.8%) |
| 30 to 34 Years | 184 (15.5%) | 156 (12.8%) |
| 35 to 39 Years | 64 (5.4%) | 40 (3.3%) |
| 40 to 44 Years | 15 (1.3%) | 0 (0.0%) |
| 45 to 49 Years | 42 (3.5%) | 10 (0.8%) |
| 50 to 54 Years | 108 (9.1%) | 98 (8.0%) |
| 55 to 59 Years | 58 (4.9%) | 75 (6.1%) |
| 60 to 64 Years | 45 (3.8%) | 110 (9.0%) |
| 65 to 69 Years | 57 (4.8%) | 43 (3.5%) |
| 70 to 74 Years | 33 (2.8%) | 15 (1.2%) |
| 75 to 79 Years | 4 (0.3%) | 61 (5.0%) |
| 80 to 84 Years | 30 (2.5%) | 38 (3.1%) |
| 85 Years and over | 19 (1.6%) | 29 (2.4%) |
| Total | 1,184 (100.0%) | 1,219 (100.0%) |
Families and Households in Perryman
Median Family Size in Perryman
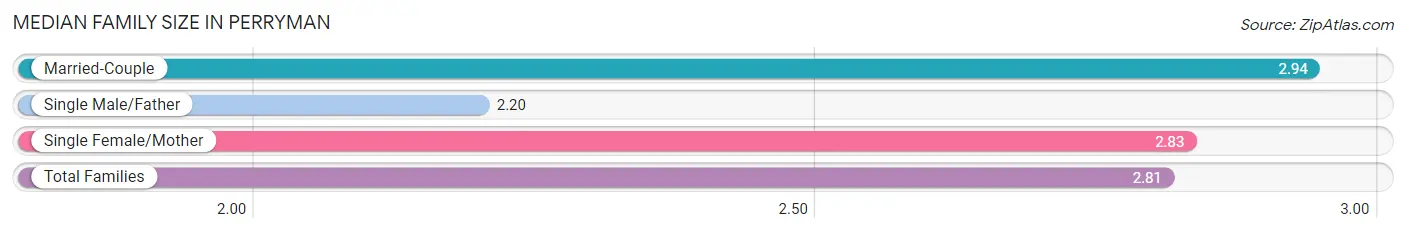
The median family size in Perryman is 2.81 persons per family, with married-couple families (352 | 50.9%) accounting for the largest median family size of 2.94 persons per family. On the other hand, single male/father families (87 | 12.6%) represent the smallest median family size with 2.20 persons per family.
| Family Type | # Families | Family Size |
| Married-Couple | 352 (50.9%) | 2.94 |
| Single Male/Father | 87 (12.6%) | 2.20 |
| Single Female/Mother | 253 (36.6%) | 2.83 |
| Total Families | 692 (100.0%) | 2.81 |
Median Household Size in Perryman
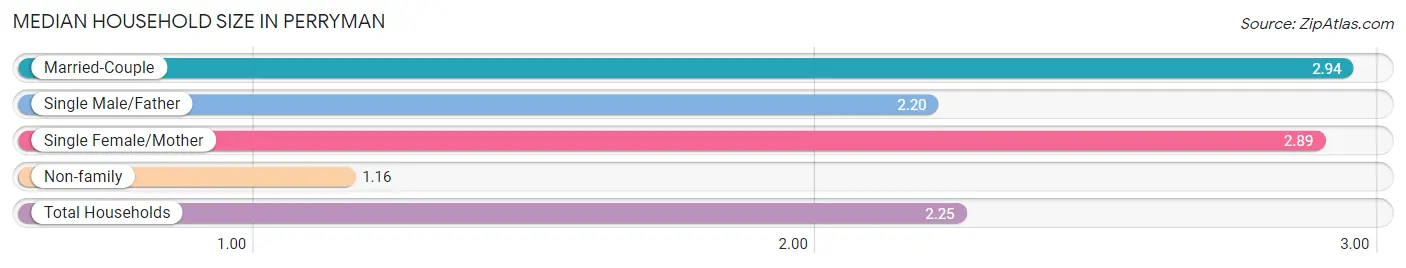
The median household size in Perryman is 2.25 persons per household, with married-couple households (352 | 33.2%) accounting for the largest median household size of 2.94 persons per household. non-family households (370 | 34.8%) represent the smallest median household size with 1.16 persons per household.
| Household Type | # Households | Household Size |
| Married-Couple | 352 (33.2%) | 2.94 |
| Single Male/Father | 87 (8.2%) | 2.20 |
| Single Female/Mother | 253 (23.8%) | 2.89 |
| Non-family | 370 (34.8%) | 1.16 |
| Total Households | 1,062 (100.0%) | 2.25 |
Household Size by Marriage Status in Perryman
Out of a total of 1,062 households in Perryman, 692 (65.2%) are family households, while 370 (34.8%) are nonfamily households. The most numerous type of family households are 2-person households, comprising 350, and the most common type of nonfamily households are 1-person households, comprising 316.
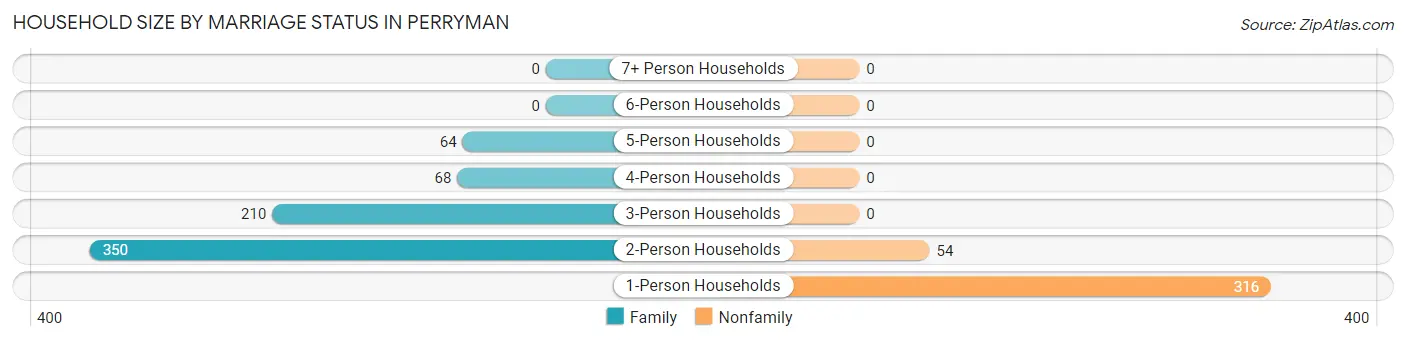
| Household Size | Family Households | Nonfamily Households |
| 1-Person Households | - | 316 (29.8%) |
| 2-Person Households | 350 (33.0%) | 54 (5.1%) |
| 3-Person Households | 210 (19.8%) | 0 (0.0%) |
| 4-Person Households | 68 (6.4%) | 0 (0.0%) |
| 5-Person Households | 64 (6.0%) | 0 (0.0%) |
| 6-Person Households | 0 (0.0%) | 0 (0.0%) |
| 7+ Person Households | 0 (0.0%) | 0 (0.0%) |
| Total | 692 (65.2%) | 370 (34.8%) |
Female Fertility in Perryman
Fertility by Age in Perryman
Average fertility rate in Perryman is 89.0 births per 1,000 women. Women in the age bracket of 20 to 34 years have the highest fertility rate with 102.0 births per 1,000 women. Women in the age bracket of 20 to 34 years acount for 100.0% of all women with births.
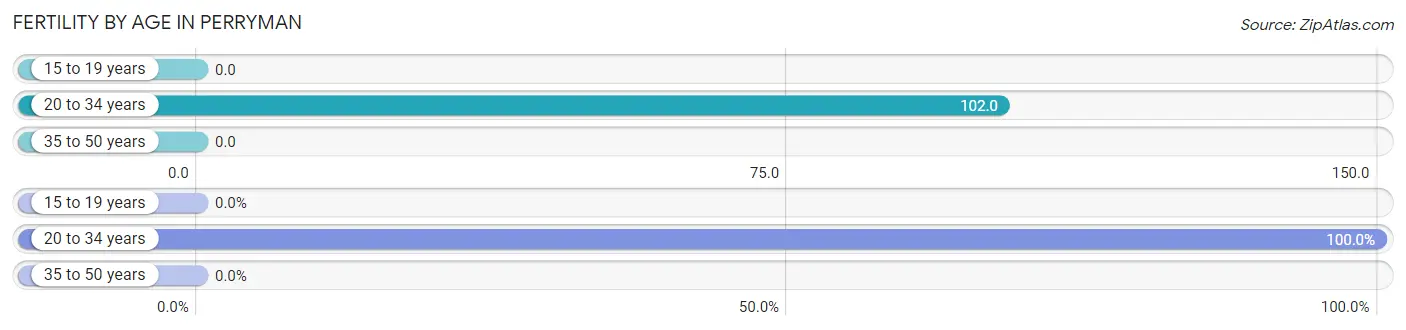
| Age Bracket | Women with Births | Births / 1,000 Women |
| 15 to 19 years | 0 (0.0%) | 0.0 |
| 20 to 34 years | 45 (100.0%) | 102.0 |
| 35 to 50 years | 0 (0.0%) | 0.0 |
| Total | 45 (100.0%) | 89.0 |
Fertility by Age by Marriage Status in Perryman
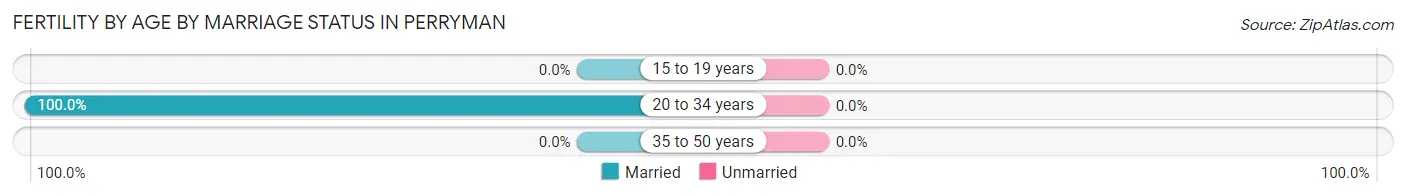
| Age Bracket | Married | Unmarried |
| 15 to 19 years | 0 (0.0%) | 0 (0.0%) |
| 20 to 34 years | 45 (100.0%) | 0 (0.0%) |
| 35 to 50 years | 0 (0.0%) | 0 (0.0%) |
| Total | 45 (100.0%) | 0 (0.0%) |
Fertility by Education in Perryman
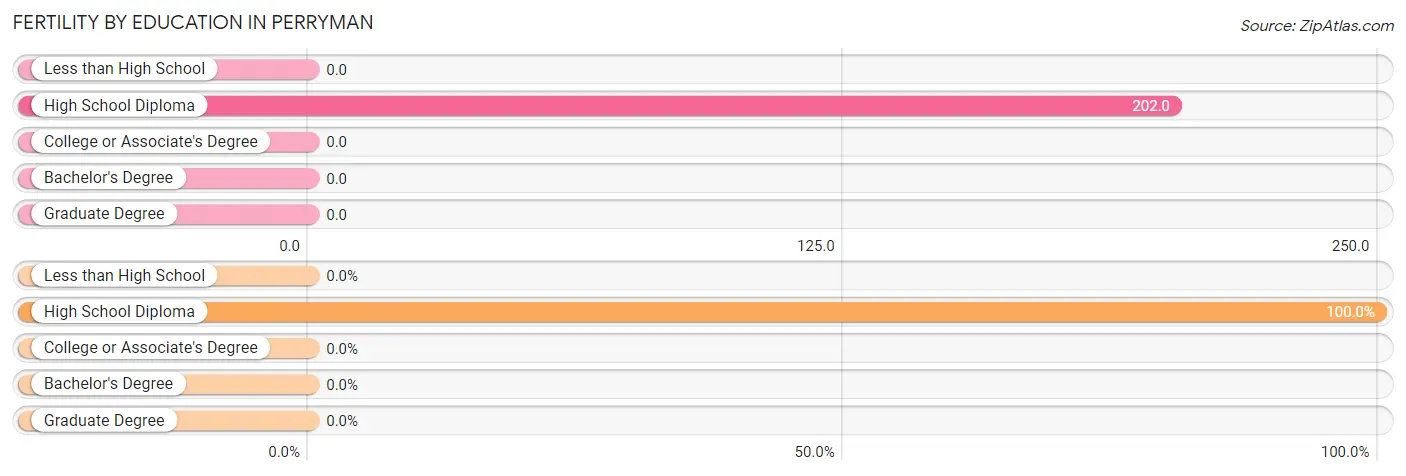
| Educational Attainment | Women with Births | Births / 1,000 Women |
| Less than High School | 0 (0.0%) | 0.0 |
| High School Diploma | 45 (100.0%) | 202.0 |
| College or Associate's Degree | 0 (0.0%) | 0.0 |
| Bachelor's Degree | 0 (0.0%) | 0.0 |
| Graduate Degree | 0 (0.0%) | 0.0 |
| Total | 45 (100.0%) | 89.0 |
Fertility by Education by Marriage Status in Perryman
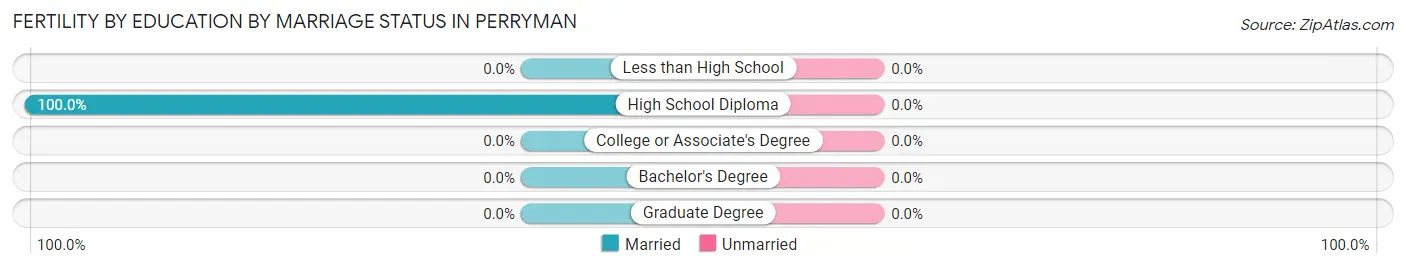
| Educational Attainment | Married | Unmarried |
| Less than High School | 0 (0.0%) | 0 (0.0%) |
| High School Diploma | 45 (100.0%) | 0 (0.0%) |
| College or Associate's Degree | 0 (0.0%) | 0 (0.0%) |
| Bachelor's Degree | 0 (0.0%) | 0 (0.0%) |
| Graduate Degree | 0 (0.0%) | 0 (0.0%) |
| Total | 45 (100.0%) | 0 (0.0%) |
Employment Characteristics in Perryman
Employment by Class of Employer in Perryman
Among the 876 employed individuals in Perryman, private company employees (647 | 73.9%), federal government employees (69 | 7.9%), and not-for-profit organizations (68 | 7.8%) make up the most common classes of employment.
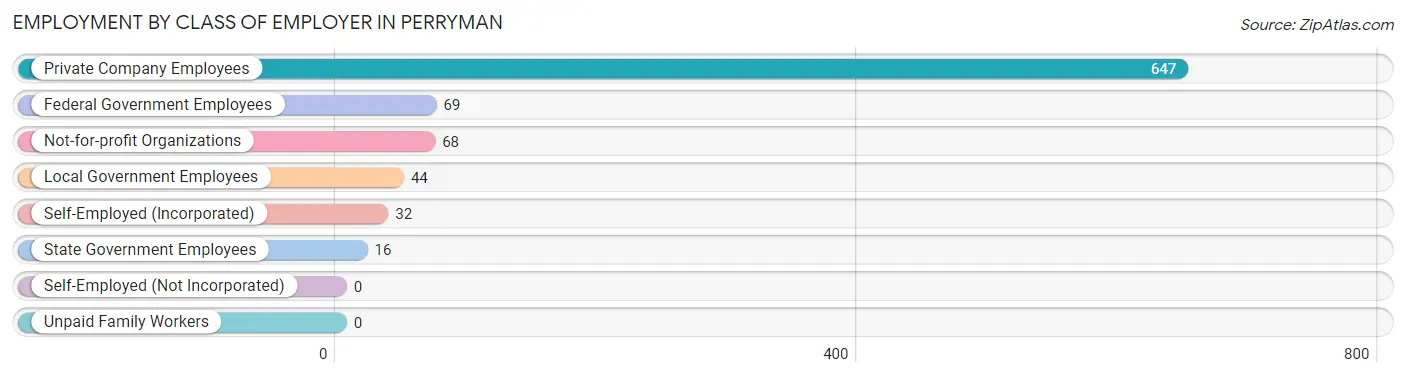
| Employer Class | # Employees | % Employees |
| Private Company Employees | 647 | 73.9% |
| Self-Employed (Incorporated) | 32 | 3.6% |
| Self-Employed (Not Incorporated) | 0 | 0.0% |
| Not-for-profit Organizations | 68 | 7.8% |
| Local Government Employees | 44 | 5.0% |
| State Government Employees | 16 | 1.8% |
| Federal Government Employees | 69 | 7.9% |
| Unpaid Family Workers | 0 | 0.0% |
| Total | 876 | 100.0% |
Employment Status by Age in Perryman
According to the labor force statistics for Perryman, out of the total population over 16 years of age (1,804), 64.0% or 1,155 individuals are in the labor force, with 19.7% or 228 of them unemployed. The age group with the highest labor force participation rate is 20 to 24 years, with 100.0% or 134 individuals in the labor force. Within the labor force, the 65 to 74 years age range has the highest percentage of unemployed individuals, with 63.6% or 21 of them being unemployed.
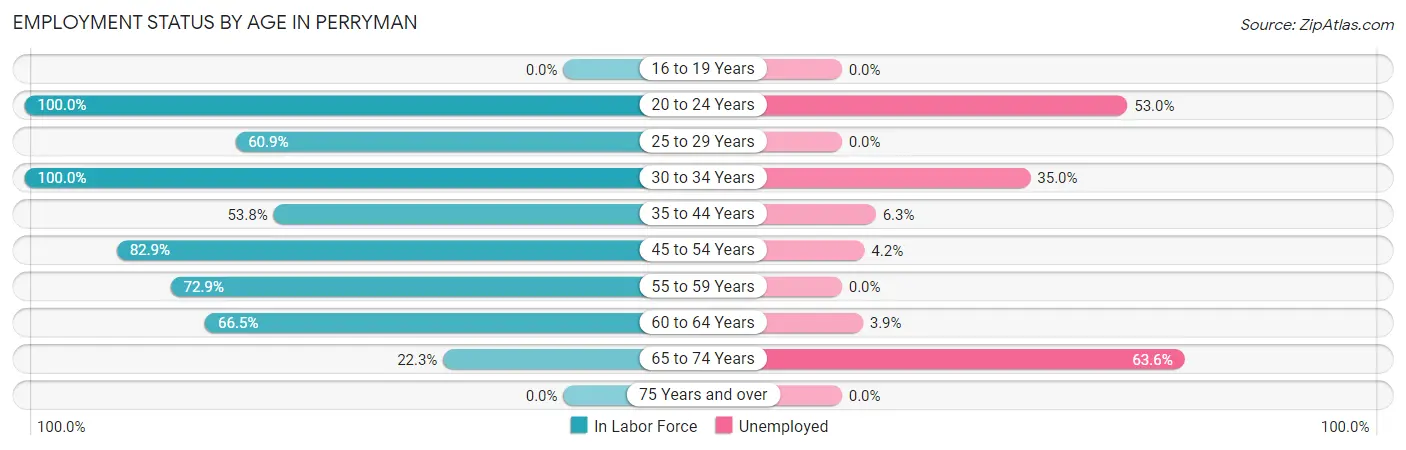
| Age Bracket | In Labor Force | Unemployed |
| 16 to 19 Years | 0 (0.0%) | 0 (0.0%) |
| 20 to 24 Years | 134 (100.0%) | 71 (53.0%) |
| 25 to 29 Years | 170 (60.9%) | 0 (0.0%) |
| 30 to 34 Years | 340 (100.0%) | 119 (35.0%) |
| 35 to 44 Years | 64 (53.8%) | 4 (6.3%) |
| 45 to 54 Years | 214 (82.9%) | 9 (4.2%) |
| 55 to 59 Years | 97 (72.9%) | 0 (0.0%) |
| 60 to 64 Years | 103 (66.5%) | 4 (3.9%) |
| 65 to 74 Years | 33 (22.3%) | 21 (63.6%) |
| 75 Years and over | 0 (0.0%) | 0 (0.0%) |
| Total | 1,155 (64.0%) | 228 (19.7%) |
Employment Status by Educational Attainment in Perryman
According to labor force statistics for Perryman, 76.9% of individuals (987) out of the total population between 25 and 64 years of age (1,284) are in the labor force, with 13.8% or 136 of them being unemployed. The group with the highest labor force participation rate are those with the educational attainment of bachelor's degree or higher, with 89.1% or 156 individuals in the labor force. Within the labor force, individuals with high school diploma education have the highest percentage of unemployment, with 19.8% or 97 of them being unemployed.
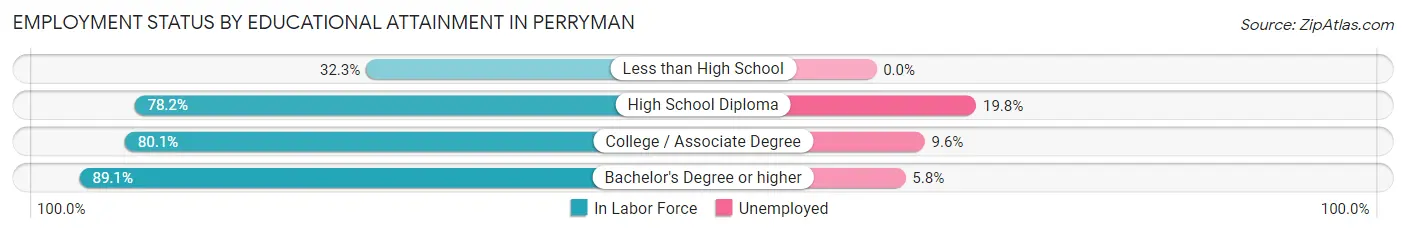
| Educational Attainment | In Labor Force | Unemployed |
| Less than High School | 30 (32.3%) | 0 (0.0%) |
| High School Diploma | 489 (78.2%) | 124 (19.8%) |
| College / Associate Degree | 313 (80.1%) | 38 (9.6%) |
| Bachelor's Degree or higher | 156 (89.1%) | 10 (5.8%) |
| Total | 987 (76.9%) | 177 (13.8%) |
Employment Occupations by Sex in Perryman
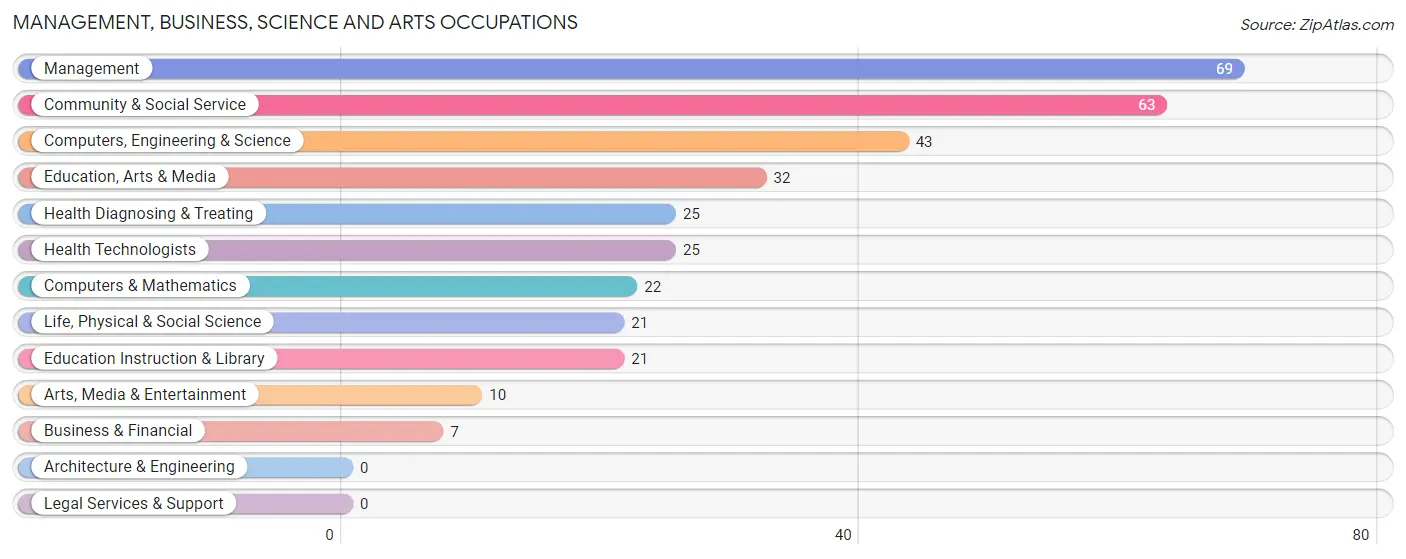
Management, Business, Science and Arts Occupations
The most common Management, Business, Science and Arts occupations in Perryman are Management (69 | 7.4%), Community & Social Service (63 | 6.8%), Computers, Engineering & Science (43 | 4.6%), Education, Arts & Media (32 | 3.5%), and Health Diagnosing & Treating (25 | 2.7%).
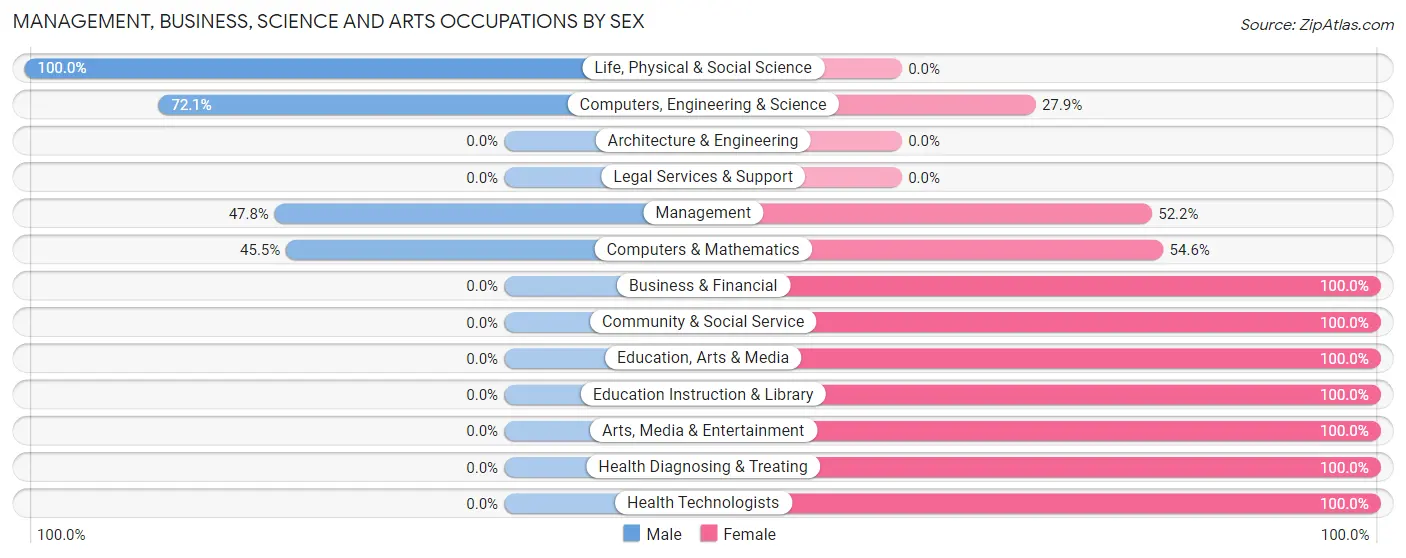
Management, Business, Science and Arts Occupations by Sex
Within the Management, Business, Science and Arts occupations in Perryman, the most male-oriented occupations are Life, Physical & Social Science (100.0%), Computers, Engineering & Science (72.1%), and Management (47.8%), while the most female-oriented occupations are Business & Financial (100.0%), Community & Social Service (100.0%), and Education, Arts & Media (100.0%).
| Occupation | Male | Female |
| Management | 33 (47.8%) | 36 (52.2%) |
| Business & Financial | 0 (0.0%) | 7 (100.0%) |
| Computers, Engineering & Science | 31 (72.1%) | 12 (27.9%) |
| Computers & Mathematics | 10 (45.5%) | 12 (54.5%) |
| Architecture & Engineering | 0 (0.0%) | 0 (0.0%) |
| Life, Physical & Social Science | 21 (100.0%) | 0 (0.0%) |
| Community & Social Service | 0 (0.0%) | 63 (100.0%) |
| Education, Arts & Media | 0 (0.0%) | 32 (100.0%) |
| Legal Services & Support | 0 (0.0%) | 0 (0.0%) |
| Education Instruction & Library | 0 (0.0%) | 21 (100.0%) |
| Arts, Media & Entertainment | 0 (0.0%) | 10 (100.0%) |
| Health Diagnosing & Treating | 0 (0.0%) | 25 (100.0%) |
| Health Technologists | 0 (0.0%) | 25 (100.0%) |
| Total (Category) | 64 (30.9%) | 143 (69.1%) |
| Total (Overall) | 445 (48.0%) | 482 (52.0%) |
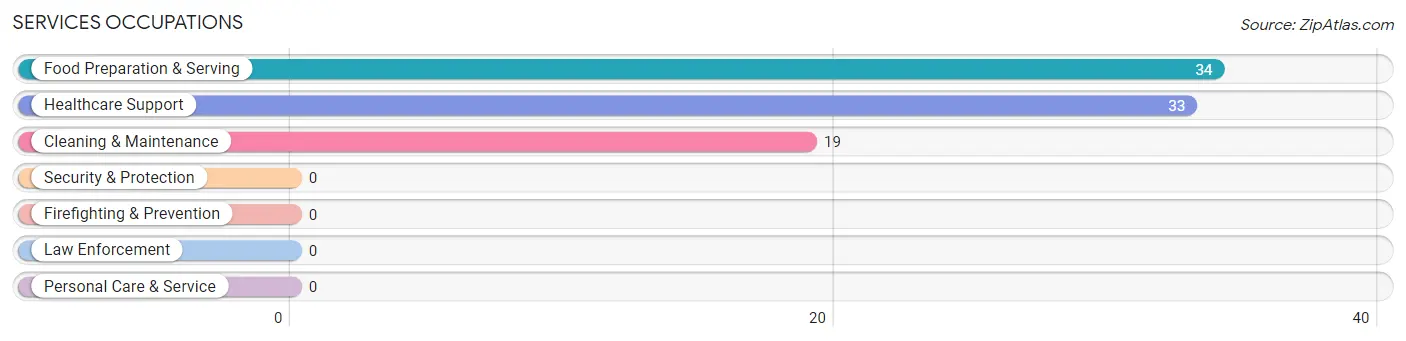
Services Occupations
The most common Services occupations in Perryman are Food Preparation & Serving (34 | 3.7%), Healthcare Support (33 | 3.6%), and Cleaning & Maintenance (19 | 2.1%).
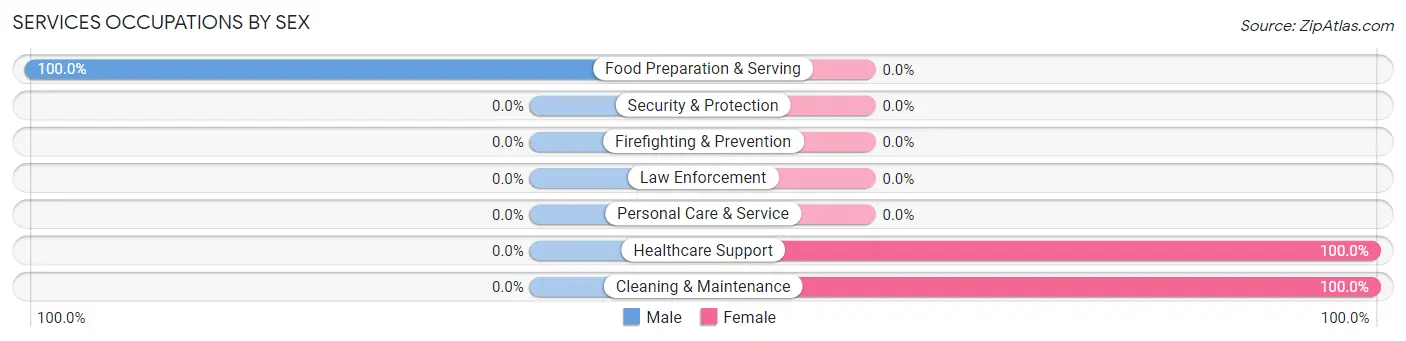
Services Occupations by Sex
| Occupation | Male | Female |
| Healthcare Support | 0 (0.0%) | 33 (100.0%) |
| Security & Protection | 0 (0.0%) | 0 (0.0%) |
| Firefighting & Prevention | 0 (0.0%) | 0 (0.0%) |
| Law Enforcement | 0 (0.0%) | 0 (0.0%) |
| Food Preparation & Serving | 34 (100.0%) | 0 (0.0%) |
| Cleaning & Maintenance | 0 (0.0%) | 19 (100.0%) |
| Personal Care & Service | 0 (0.0%) | 0 (0.0%) |
| Total (Category) | 34 (39.5%) | 52 (60.5%) |
| Total (Overall) | 445 (48.0%) | 482 (52.0%) |
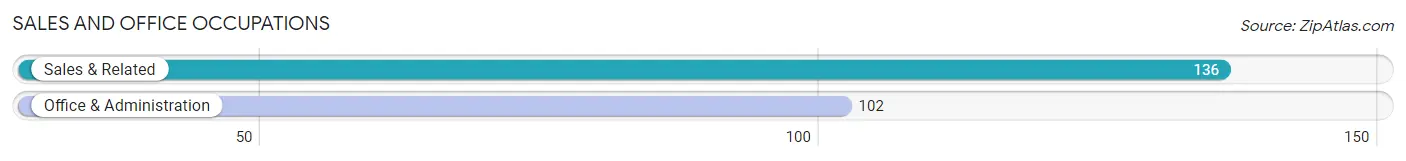
Sales and Office Occupations
The most common Sales and Office occupations in Perryman are Sales & Related (136 | 14.7%), and Office & Administration (102 | 11.0%).
Sales and Office Occupations by Sex
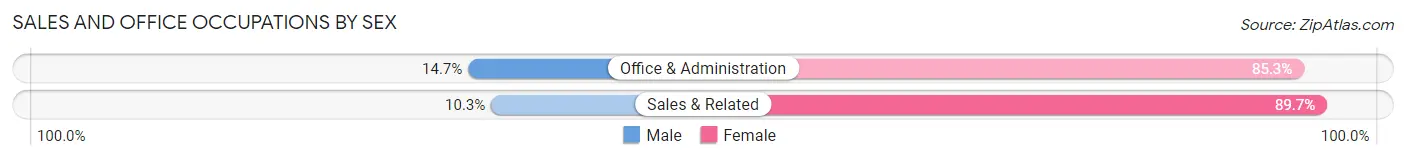
| Occupation | Male | Female |
| Sales & Related | 14 (10.3%) | 122 (89.7%) |
| Office & Administration | 15 (14.7%) | 87 (85.3%) |
| Total (Category) | 29 (12.2%) | 209 (87.8%) |
| Total (Overall) | 445 (48.0%) | 482 (52.0%) |
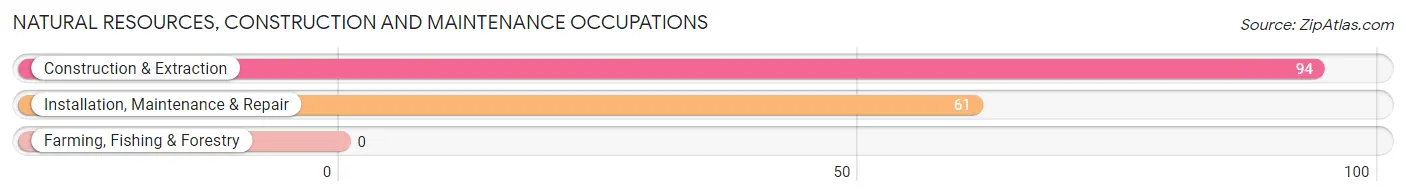
Natural Resources, Construction and Maintenance Occupations
The most common Natural Resources, Construction and Maintenance occupations in Perryman are Construction & Extraction (94 | 10.1%), and Installation, Maintenance & Repair (61 | 6.6%).
Natural Resources, Construction and Maintenance Occupations by Sex
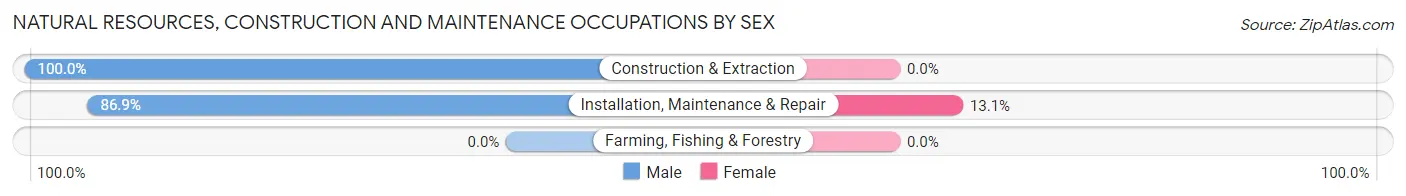
| Occupation | Male | Female |
| Farming, Fishing & Forestry | 0 (0.0%) | 0 (0.0%) |
| Construction & Extraction | 94 (100.0%) | 0 (0.0%) |
| Installation, Maintenance & Repair | 53 (86.9%) | 8 (13.1%) |
| Total (Category) | 147 (94.8%) | 8 (5.2%) |
| Total (Overall) | 445 (48.0%) | 482 (52.0%) |
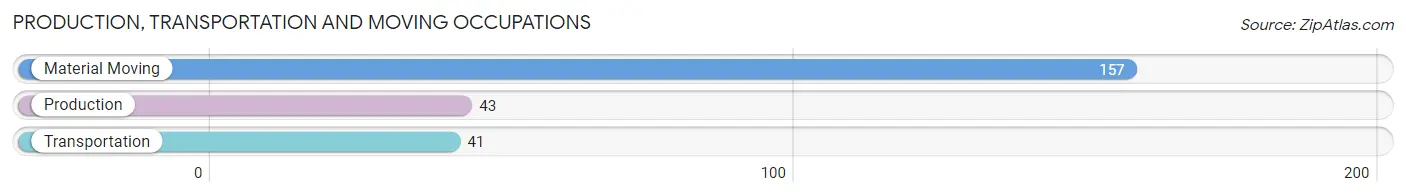
Production, Transportation and Moving Occupations
The most common Production, Transportation and Moving occupations in Perryman are Material Moving (157 | 16.9%), Production (43 | 4.6%), and Transportation (41 | 4.4%).
Production, Transportation and Moving Occupations by Sex
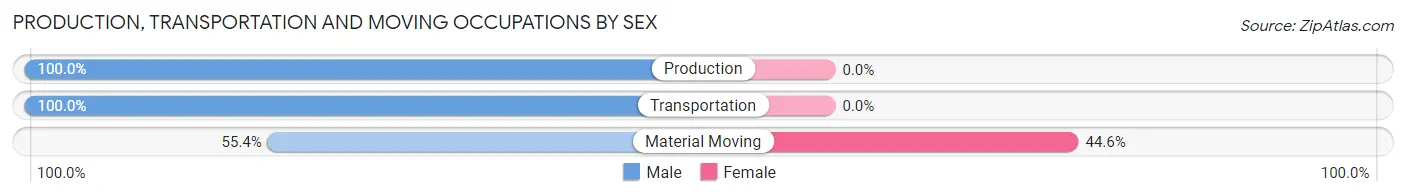
| Occupation | Male | Female |
| Production | 43 (100.0%) | 0 (0.0%) |
| Transportation | 41 (100.0%) | 0 (0.0%) |
| Material Moving | 87 (55.4%) | 70 (44.6%) |
| Total (Category) | 171 (71.0%) | 70 (29.0%) |
| Total (Overall) | 445 (48.0%) | 482 (52.0%) |
Employment Industries by Sex in Perryman
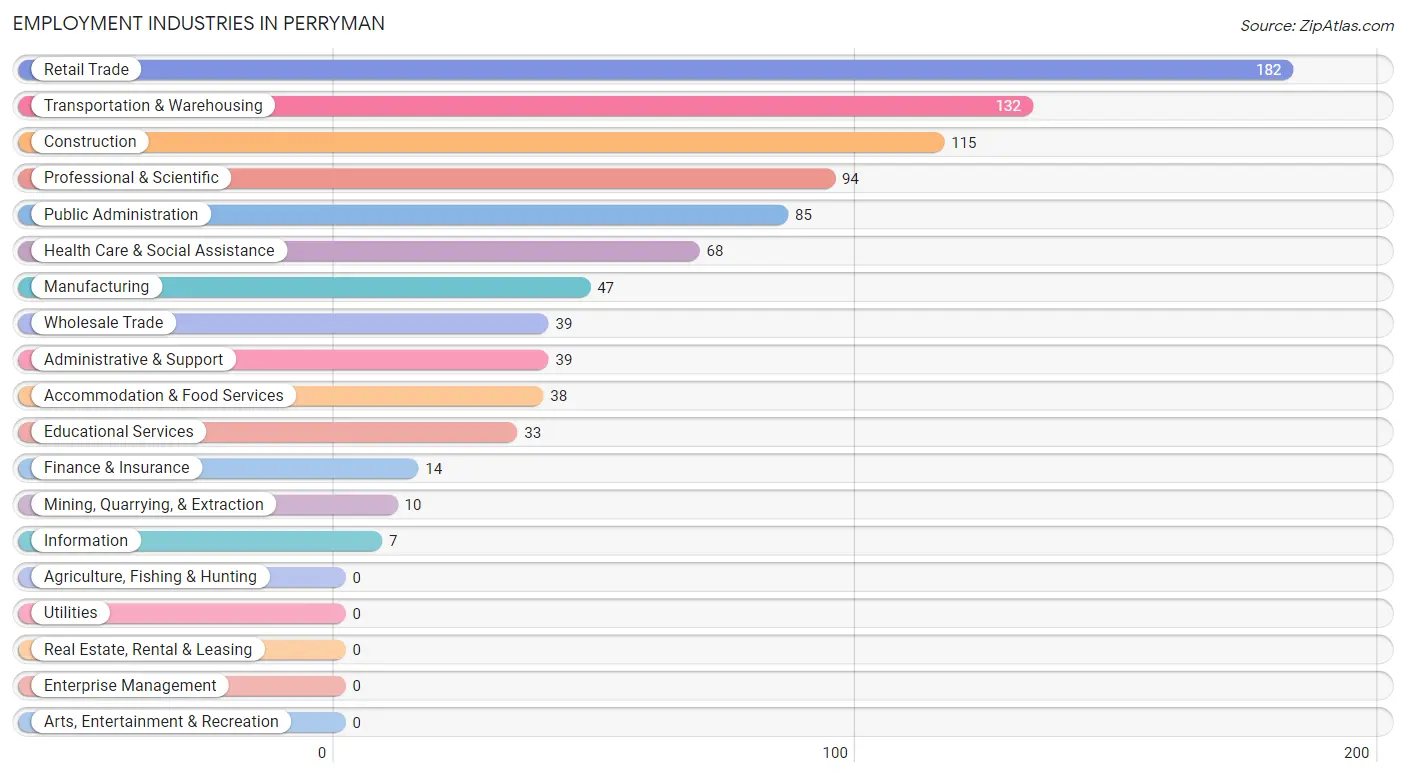
Employment Industries in Perryman
The major employment industries in Perryman include Retail Trade (182 | 19.6%), Transportation & Warehousing (132 | 14.2%), Construction (115 | 12.4%), Professional & Scientific (94 | 10.1%), and Public Administration (85 | 9.2%).
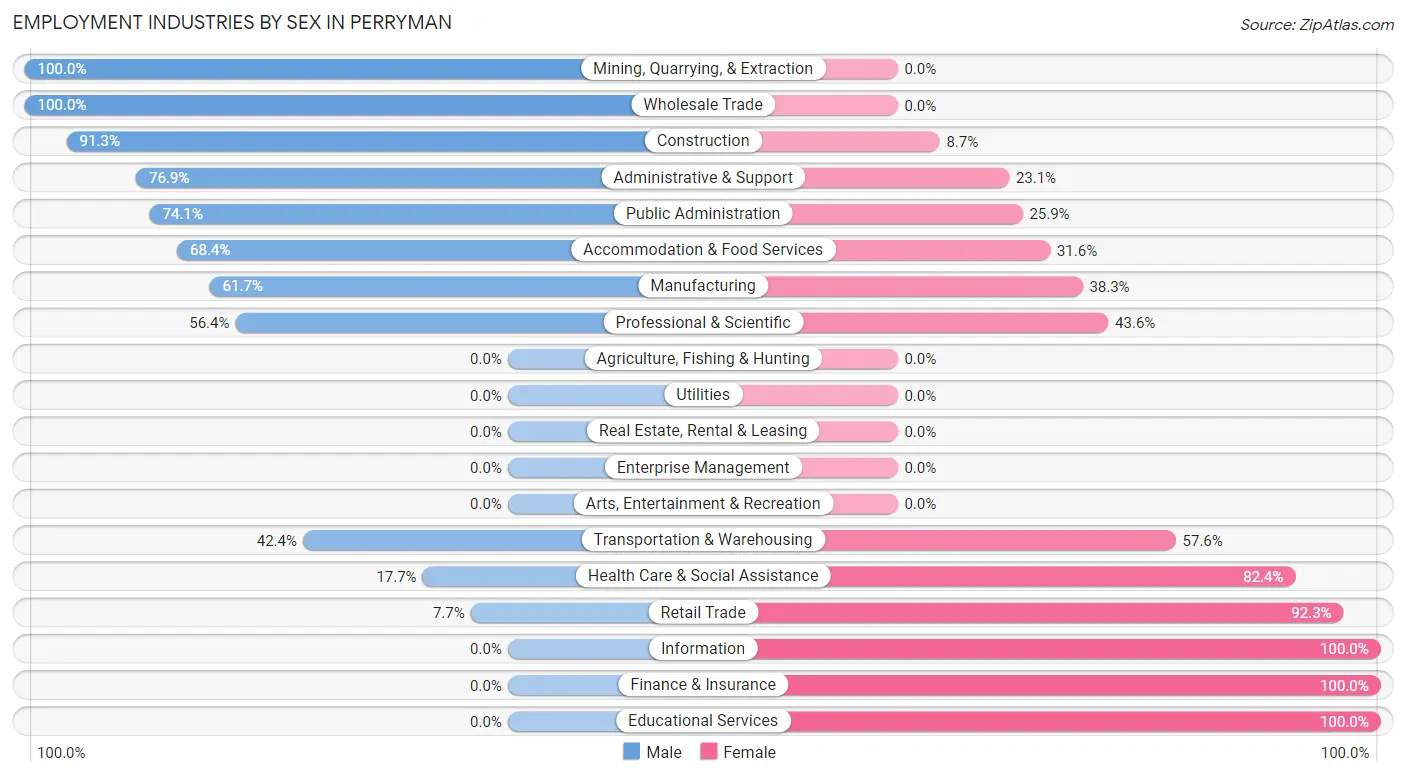
Employment Industries by Sex in Perryman
The Perryman industries that see more men than women are Mining, Quarrying, & Extraction (100.0%), Wholesale Trade (100.0%), and Construction (91.3%), whereas the industries that tend to have a higher number of women are Information (100.0%), Finance & Insurance (100.0%), and Educational Services (100.0%).
| Industry | Male | Female |
| Agriculture, Fishing & Hunting | 0 (0.0%) | 0 (0.0%) |
| Mining, Quarrying, & Extraction | 10 (100.0%) | 0 (0.0%) |
| Construction | 105 (91.3%) | 10 (8.7%) |
| Manufacturing | 29 (61.7%) | 18 (38.3%) |
| Wholesale Trade | 39 (100.0%) | 0 (0.0%) |
| Retail Trade | 14 (7.7%) | 168 (92.3%) |
| Transportation & Warehousing | 56 (42.4%) | 76 (57.6%) |
| Utilities | 0 (0.0%) | 0 (0.0%) |
| Information | 0 (0.0%) | 7 (100.0%) |
| Finance & Insurance | 0 (0.0%) | 14 (100.0%) |
| Real Estate, Rental & Leasing | 0 (0.0%) | 0 (0.0%) |
| Professional & Scientific | 53 (56.4%) | 41 (43.6%) |
| Enterprise Management | 0 (0.0%) | 0 (0.0%) |
| Administrative & Support | 30 (76.9%) | 9 (23.1%) |
| Educational Services | 0 (0.0%) | 33 (100.0%) |
| Health Care & Social Assistance | 12 (17.6%) | 56 (82.4%) |
| Arts, Entertainment & Recreation | 0 (0.0%) | 0 (0.0%) |
| Accommodation & Food Services | 26 (68.4%) | 12 (31.6%) |
| Public Administration | 63 (74.1%) | 22 (25.9%) |
| Total | 445 (48.0%) | 482 (52.0%) |
Education in Perryman
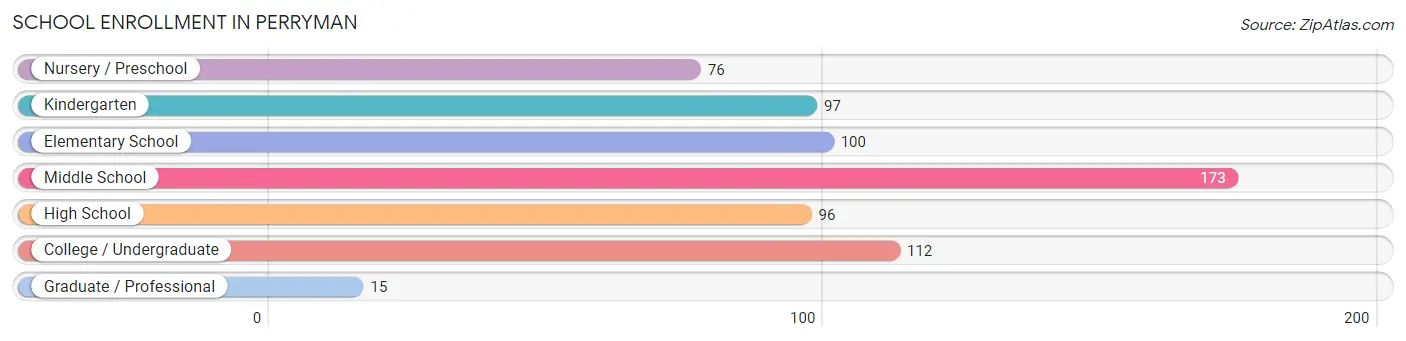
School Enrollment in Perryman
The most common levels of schooling among the 669 students in Perryman are middle school (173 | 25.9%), college / undergraduate (112 | 16.7%), and elementary school (100 | 14.9%).
| School Level | # Students | % Students |
| Nursery / Preschool | 76 | 11.4% |
| Kindergarten | 97 | 14.5% |
| Elementary School | 100 | 14.9% |
| Middle School | 173 | 25.9% |
| High School | 96 | 14.3% |
| College / Undergraduate | 112 | 16.7% |
| Graduate / Professional | 15 | 2.2% |
| Total | 669 | 100.0% |
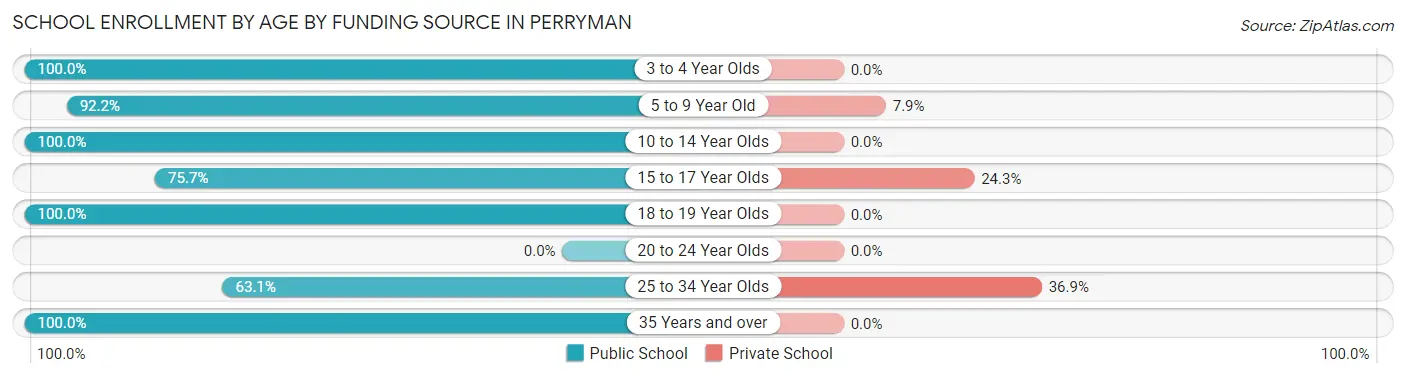
School Enrollment by Age by Funding Source in Perryman
Out of a total of 669 students who are enrolled in schools in Perryman, 69 (10.3%) attend a private institution, while the remaining 600 (89.7%) are enrolled in public schools. The age group of 25 to 34 year olds has the highest likelihood of being enrolled in private schools, with 45 (36.9% in the age bracket) enrolled. Conversely, the age group of 3 to 4 year olds has the lowest likelihood of being enrolled in a private school, with 66 (100.0% in the age bracket) attending a public institution.
| Age Bracket | Public School | Private School |
| 3 to 4 Year Olds | 66 (100.0%) | 0 (0.0%) |
| 5 to 9 Year Old | 176 (92.1%) | 15 (7.9%) |
| 10 to 14 Year Olds | 189 (100.0%) | 0 (0.0%) |
| 15 to 17 Year Olds | 28 (75.7%) | 9 (24.3%) |
| 18 to 19 Year Olds | 37 (100.0%) | 0 (0.0%) |
| 20 to 24 Year Olds | 0 (0.0%) | 0 (0.0%) |
| 25 to 34 Year Olds | 77 (63.1%) | 45 (36.9%) |
| 35 Years and over | 27 (100.0%) | 0 (0.0%) |
| Total | 600 (89.7%) | 69 (10.3%) |
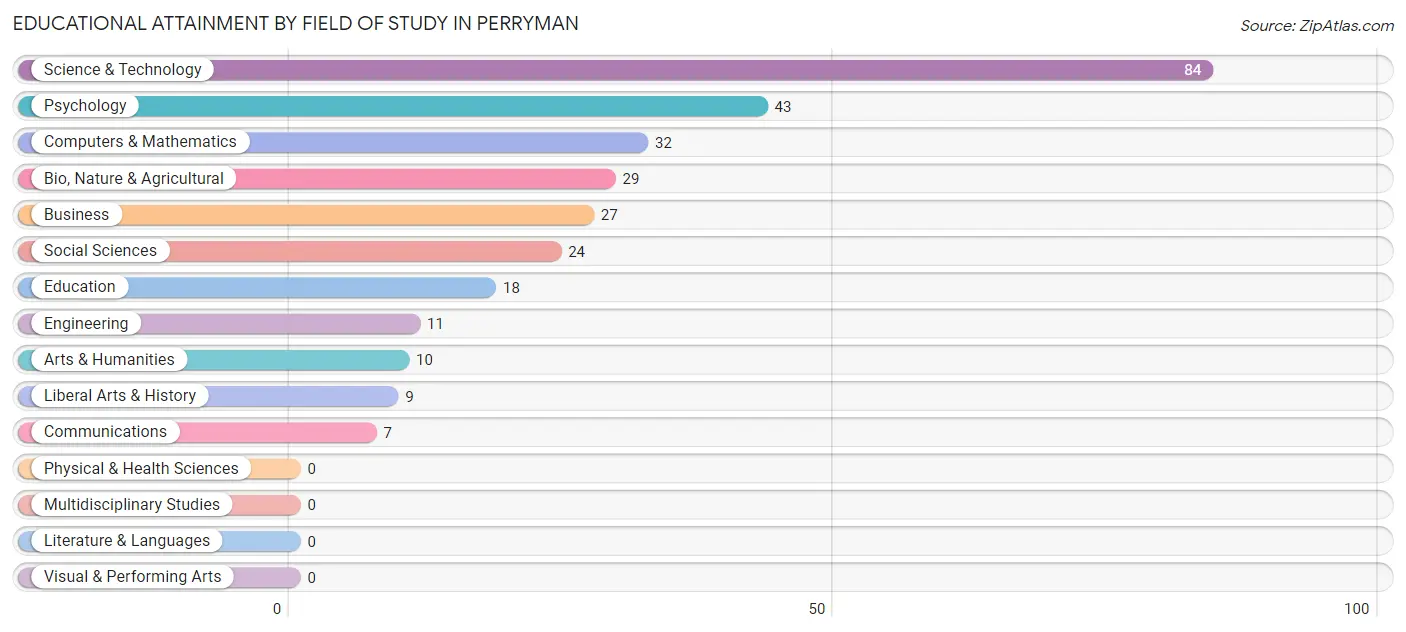
Educational Attainment by Field of Study in Perryman
Science & technology (84 | 28.6%), psychology (43 | 14.6%), computers & mathematics (32 | 10.9%), bio, nature & agricultural (29 | 9.9%), and business (27 | 9.2%) are the most common fields of study among 294 individuals in Perryman who have obtained a bachelor's degree or higher.
| Field of Study | # Graduates | % Graduates |
| Computers & Mathematics | 32 | 10.9% |
| Bio, Nature & Agricultural | 29 | 9.9% |
| Physical & Health Sciences | 0 | 0.0% |
| Psychology | 43 | 14.6% |
| Social Sciences | 24 | 8.2% |
| Engineering | 11 | 3.7% |
| Multidisciplinary Studies | 0 | 0.0% |
| Science & Technology | 84 | 28.6% |
| Business | 27 | 9.2% |
| Education | 18 | 6.1% |
| Literature & Languages | 0 | 0.0% |
| Liberal Arts & History | 9 | 3.1% |
| Visual & Performing Arts | 0 | 0.0% |
| Communications | 7 | 2.4% |
| Arts & Humanities | 10 | 3.4% |
| Total | 294 | 100.0% |
Transportation & Commute in Perryman
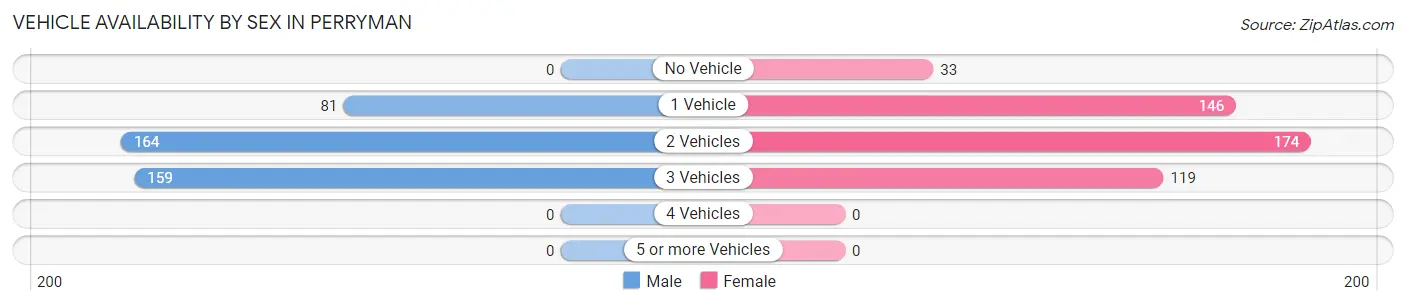
Vehicle Availability by Sex in Perryman
The most prevalent vehicle ownership categories in Perryman are males with 2 vehicles (164, accounting for 40.6%) and females with 2 vehicles (174, making up 34.7%).
| Vehicles Available | Male | Female |
| No Vehicle | 0 (0.0%) | 33 (7.0%) |
| 1 Vehicle | 81 (20.1%) | 146 (30.9%) |
| 2 Vehicles | 164 (40.6%) | 174 (36.9%) |
| 3 Vehicles | 159 (39.4%) | 119 (25.2%) |
| 4 Vehicles | 0 (0.0%) | 0 (0.0%) |
| 5 or more Vehicles | 0 (0.0%) | 0 (0.0%) |
| Total | 404 (100.0%) | 472 (100.0%) |
Commute Time in Perryman
The most frequently occuring commute durations in Perryman are 5 to 9 minutes (158 commuters, 19.2%), 30 to 34 minutes (132 commuters, 16.0%), and 25 to 29 minutes (131 commuters, 15.9%).
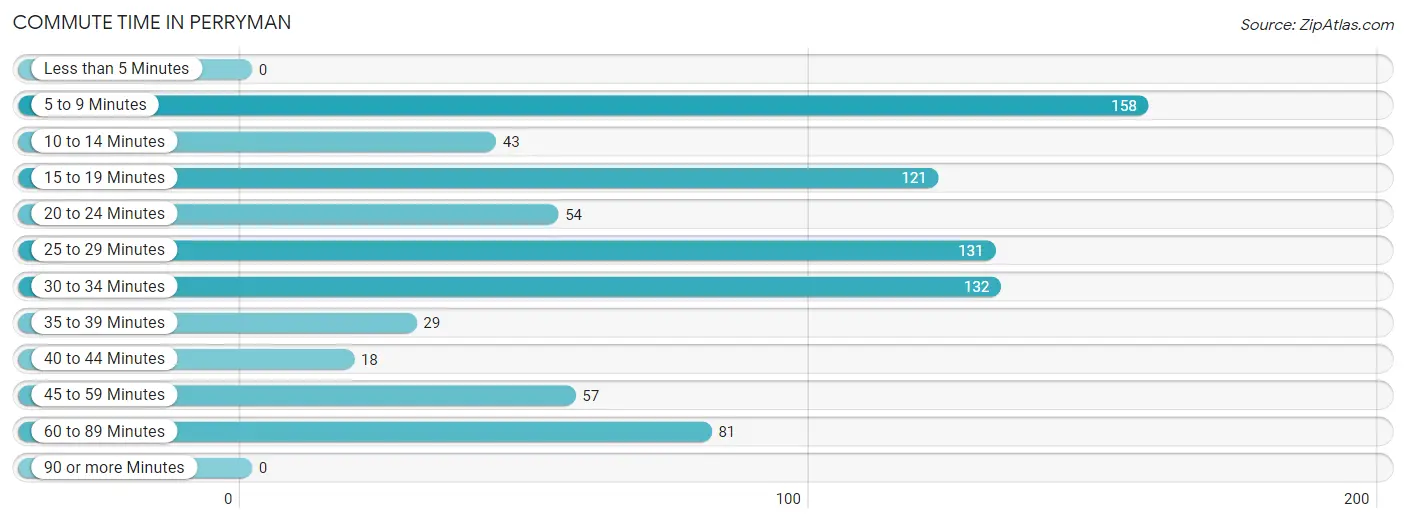
| Commute Time | # Commuters | % Commuters |
| Less than 5 Minutes | 0 | 0.0% |
| 5 to 9 Minutes | 158 | 19.2% |
| 10 to 14 Minutes | 43 | 5.2% |
| 15 to 19 Minutes | 121 | 14.7% |
| 20 to 24 Minutes | 54 | 6.6% |
| 25 to 29 Minutes | 131 | 15.9% |
| 30 to 34 Minutes | 132 | 16.0% |
| 35 to 39 Minutes | 29 | 3.5% |
| 40 to 44 Minutes | 18 | 2.2% |
| 45 to 59 Minutes | 57 | 6.9% |
| 60 to 89 Minutes | 81 | 9.8% |
| 90 or more Minutes | 0 | 0.0% |
Commute Time by Sex in Perryman
The most common commute times in Perryman are 5 to 9 minutes (98 commuters, 27.1%) for males and 25 to 29 minutes (106 commuters, 22.9%) for females.
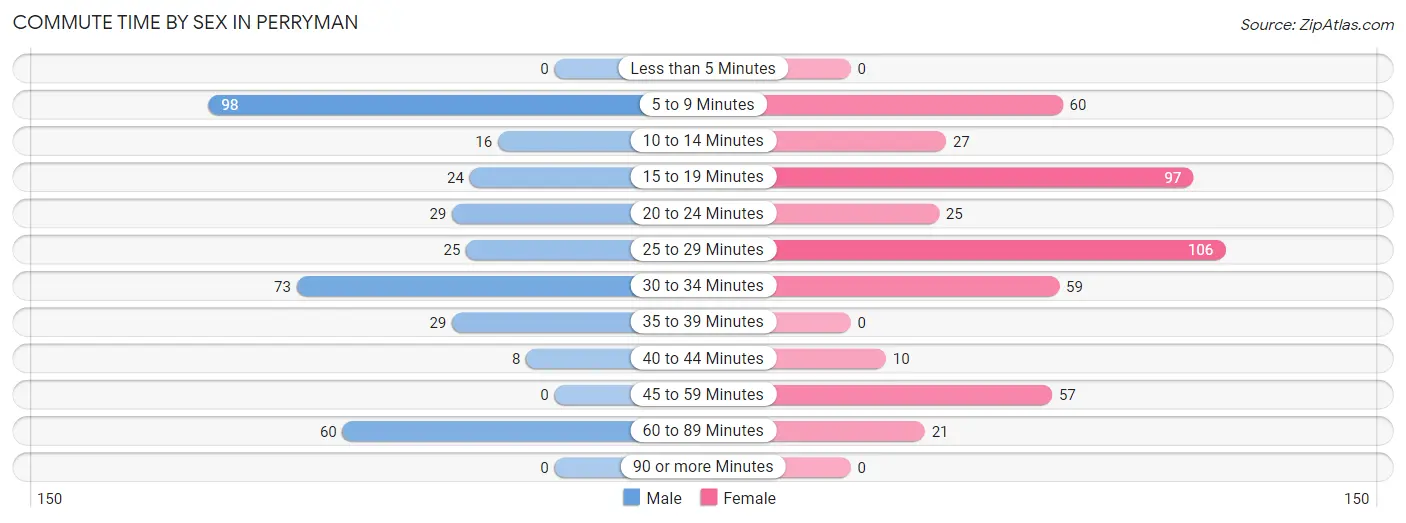
| Commute Time | Male | Female |
| Less than 5 Minutes | 0 (0.0%) | 0 (0.0%) |
| 5 to 9 Minutes | 98 (27.1%) | 60 (13.0%) |
| 10 to 14 Minutes | 16 (4.4%) | 27 (5.8%) |
| 15 to 19 Minutes | 24 (6.6%) | 97 (21.0%) |
| 20 to 24 Minutes | 29 (8.0%) | 25 (5.4%) |
| 25 to 29 Minutes | 25 (6.9%) | 106 (22.9%) |
| 30 to 34 Minutes | 73 (20.2%) | 59 (12.8%) |
| 35 to 39 Minutes | 29 (8.0%) | 0 (0.0%) |
| 40 to 44 Minutes | 8 (2.2%) | 10 (2.2%) |
| 45 to 59 Minutes | 0 (0.0%) | 57 (12.3%) |
| 60 to 89 Minutes | 60 (16.6%) | 21 (4.5%) |
| 90 or more Minutes | 0 (0.0%) | 0 (0.0%) |
Time of Departure to Work by Sex in Perryman
The most frequent times of departure to work in Perryman are 7:30 AM to 7:59 AM (73, 20.2%) for males and 7:30 AM to 7:59 AM (91, 19.7%) for females.
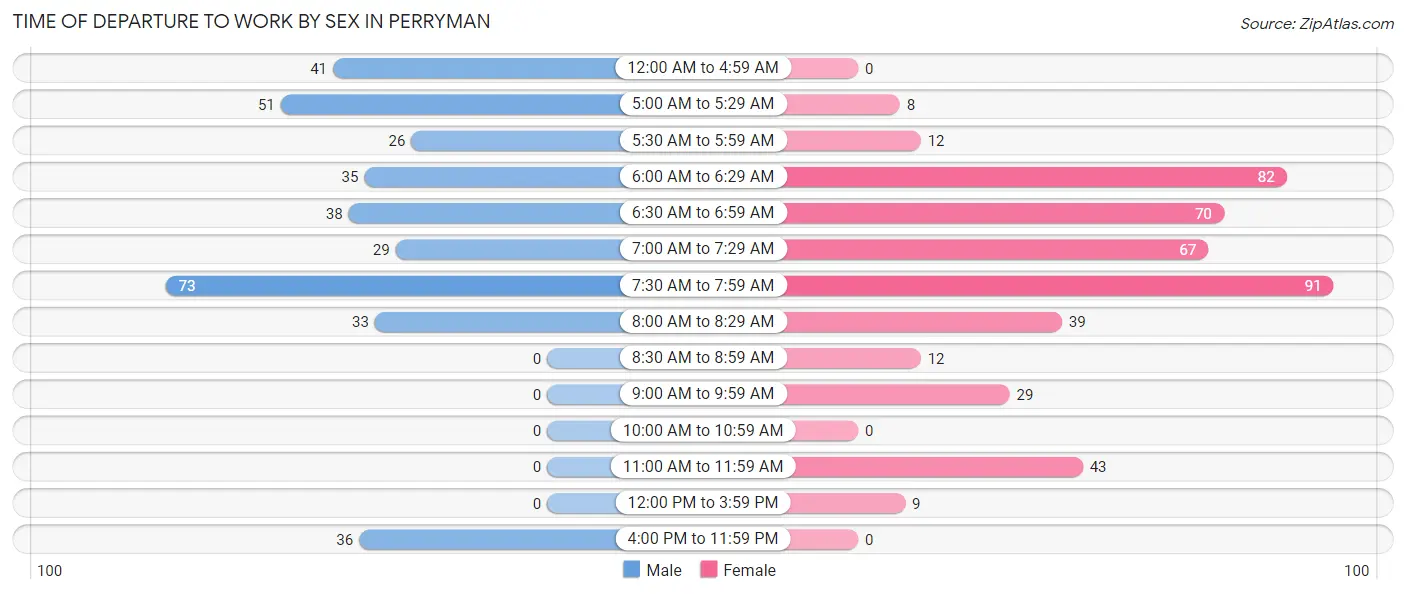
| Time of Departure | Male | Female |
| 12:00 AM to 4:59 AM | 41 (11.3%) | 0 (0.0%) |
| 5:00 AM to 5:29 AM | 51 (14.1%) | 8 (1.7%) |
| 5:30 AM to 5:59 AM | 26 (7.2%) | 12 (2.6%) |
| 6:00 AM to 6:29 AM | 35 (9.7%) | 82 (17.7%) |
| 6:30 AM to 6:59 AM | 38 (10.5%) | 70 (15.1%) |
| 7:00 AM to 7:29 AM | 29 (8.0%) | 67 (14.5%) |
| 7:30 AM to 7:59 AM | 73 (20.2%) | 91 (19.7%) |
| 8:00 AM to 8:29 AM | 33 (9.1%) | 39 (8.4%) |
| 8:30 AM to 8:59 AM | 0 (0.0%) | 12 (2.6%) |
| 9:00 AM to 9:59 AM | 0 (0.0%) | 29 (6.3%) |
| 10:00 AM to 10:59 AM | 0 (0.0%) | 0 (0.0%) |
| 11:00 AM to 11:59 AM | 0 (0.0%) | 43 (9.3%) |
| 12:00 PM to 3:59 PM | 0 (0.0%) | 9 (1.9%) |
| 4:00 PM to 11:59 PM | 36 (9.9%) | 0 (0.0%) |
| Total | 362 (100.0%) | 462 (100.0%) |
Housing Occupancy in Perryman
Occupancy by Ownership in Perryman
Of the total 1,062 dwellings in Perryman, owner-occupied units account for 603 (56.8%), while renter-occupied units make up 459 (43.2%).
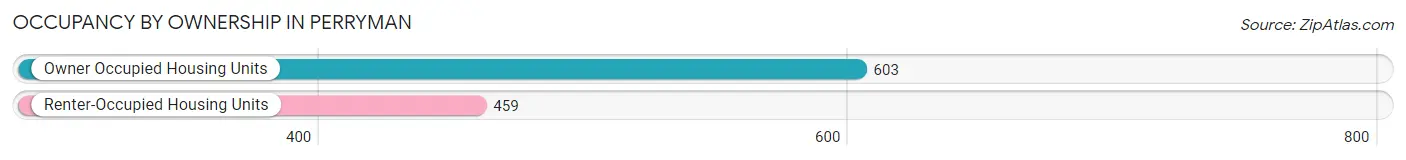
| Occupancy | # Housing Units | % Housing Units |
| Owner Occupied Housing Units | 603 | 56.8% |
| Renter-Occupied Housing Units | 459 | 43.2% |
| Total Occupied Housing Units | 1,062 | 100.0% |
Occupancy by Household Size in Perryman
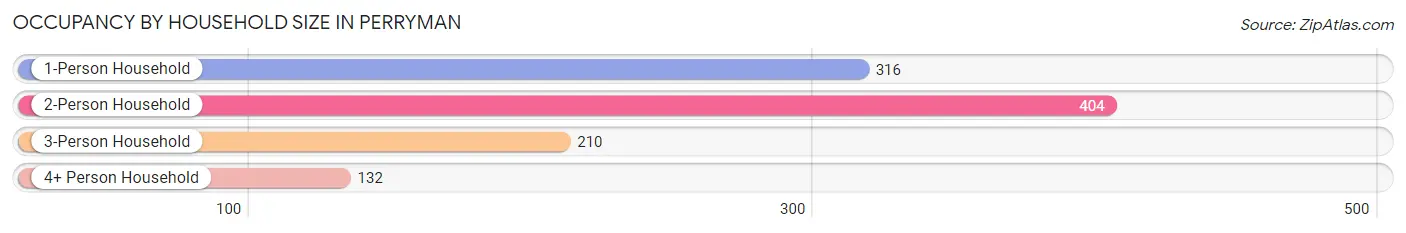
| Household Size | # Housing Units | % Housing Units |
| 1-Person Household | 316 | 29.8% |
| 2-Person Household | 404 | 38.0% |
| 3-Person Household | 210 | 19.8% |
| 4+ Person Household | 132 | 12.4% |
| Total Housing Units | 1,062 | 100.0% |
Occupancy by Ownership by Household Size in Perryman
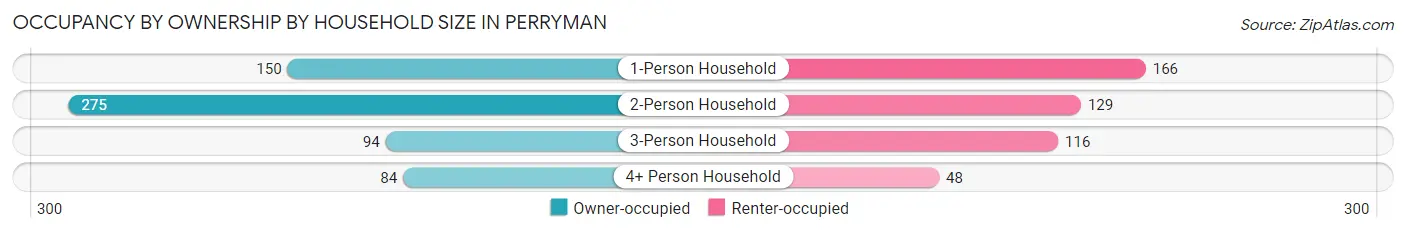
| Household Size | Owner-occupied | Renter-occupied |
| 1-Person Household | 150 (47.5%) | 166 (52.5%) |
| 2-Person Household | 275 (68.1%) | 129 (31.9%) |
| 3-Person Household | 94 (44.8%) | 116 (55.2%) |
| 4+ Person Household | 84 (63.6%) | 48 (36.4%) |
| Total Housing Units | 603 (56.8%) | 459 (43.2%) |
Occupancy by Educational Attainment in Perryman
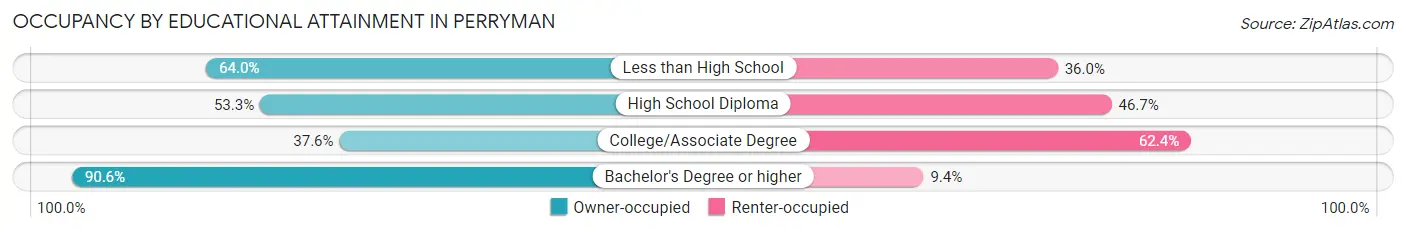
| Household Size | Owner-occupied | Renter-occupied |
| Less than High School | 64 (64.0%) | 36 (36.0%) |
| High School Diploma | 256 (53.3%) | 224 (46.7%) |
| College/Associate Degree | 109 (37.6%) | 181 (62.4%) |
| Bachelor's Degree or higher | 174 (90.6%) | 18 (9.4%) |
Occupancy by Age of Householder in Perryman
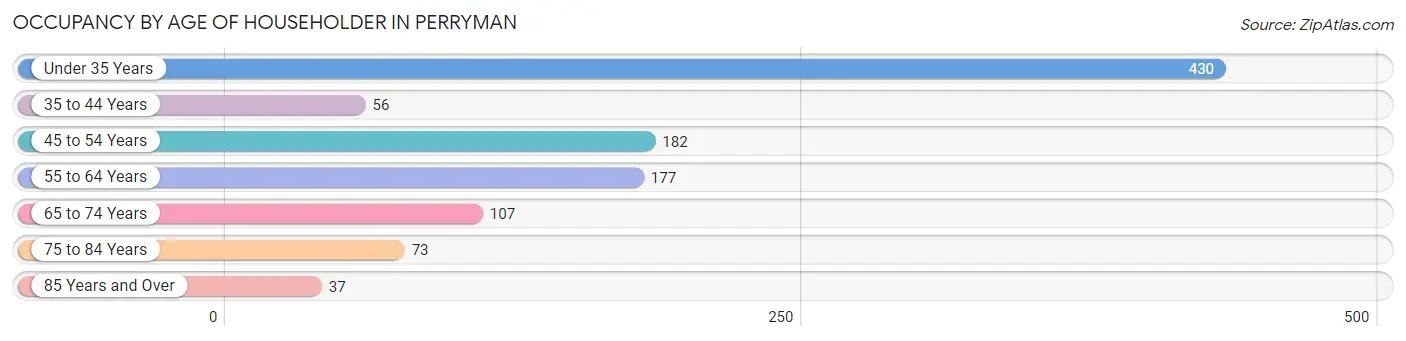
| Age Bracket | # Households | % Households |
| Under 35 Years | 430 | 40.5% |
| 35 to 44 Years | 56 | 5.3% |
| 45 to 54 Years | 182 | 17.1% |
| 55 to 64 Years | 177 | 16.7% |
| 65 to 74 Years | 107 | 10.1% |
| 75 to 84 Years | 73 | 6.9% |
| 85 Years and Over | 37 | 3.5% |
| Total | 1,062 | 100.0% |
Housing Finances in Perryman
Median Income by Occupancy in Perryman
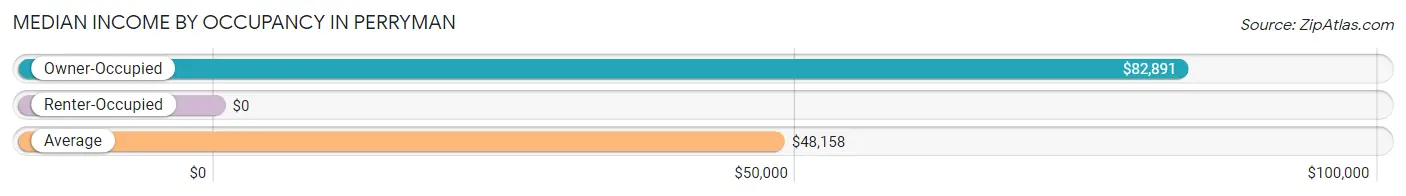
| Occupancy Type | # Households | Median Income |
| Owner-Occupied | 603 (56.8%) | $82,891 |
| Renter-Occupied | 459 (43.2%) | $0 |
| Average | 1,062 (100.0%) | $48,158 |
Occupancy by Householder Income Bracket in Perryman
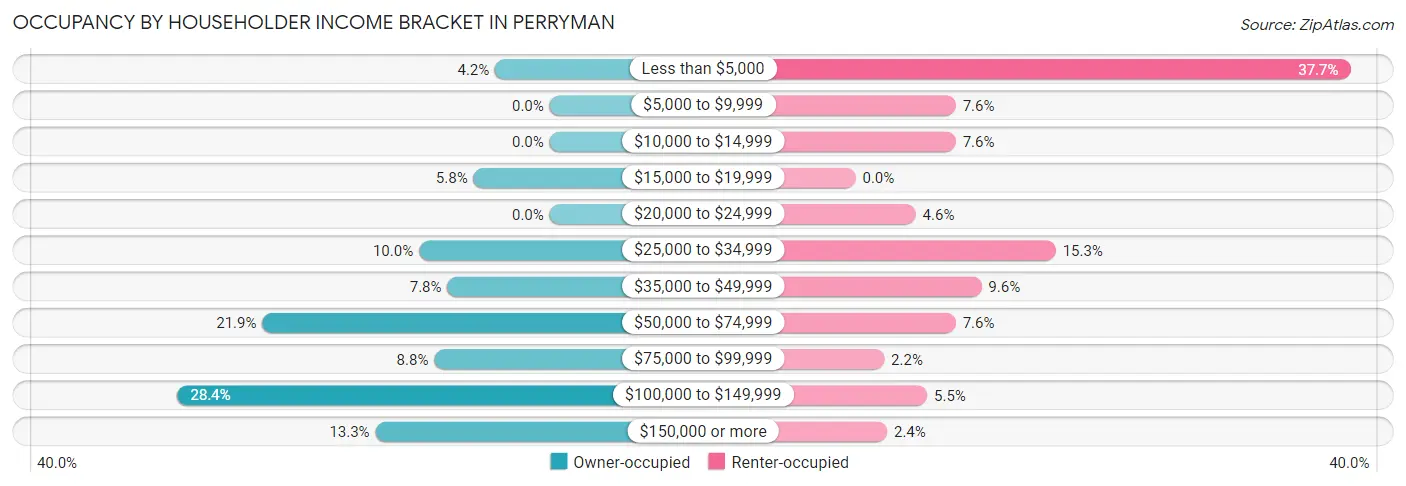
| Income Bracket | Owner-occupied | Renter-occupied |
| Less than $5,000 | 25 (4.2%) | 173 (37.7%) |
| $5,000 to $9,999 | 0 (0.0%) | 35 (7.6%) |
| $10,000 to $14,999 | 0 (0.0%) | 35 (7.6%) |
| $15,000 to $19,999 | 35 (5.8%) | 0 (0.0%) |
| $20,000 to $24,999 | 0 (0.0%) | 21 (4.6%) |
| $25,000 to $34,999 | 60 (10.0%) | 70 (15.2%) |
| $35,000 to $49,999 | 47 (7.8%) | 44 (9.6%) |
| $50,000 to $74,999 | 132 (21.9%) | 35 (7.6%) |
| $75,000 to $99,999 | 53 (8.8%) | 10 (2.2%) |
| $100,000 to $149,999 | 171 (28.4%) | 25 (5.4%) |
| $150,000 or more | 80 (13.3%) | 11 (2.4%) |
| Total | 603 (100.0%) | 459 (100.0%) |
Monthly Housing Cost Tiers in Perryman
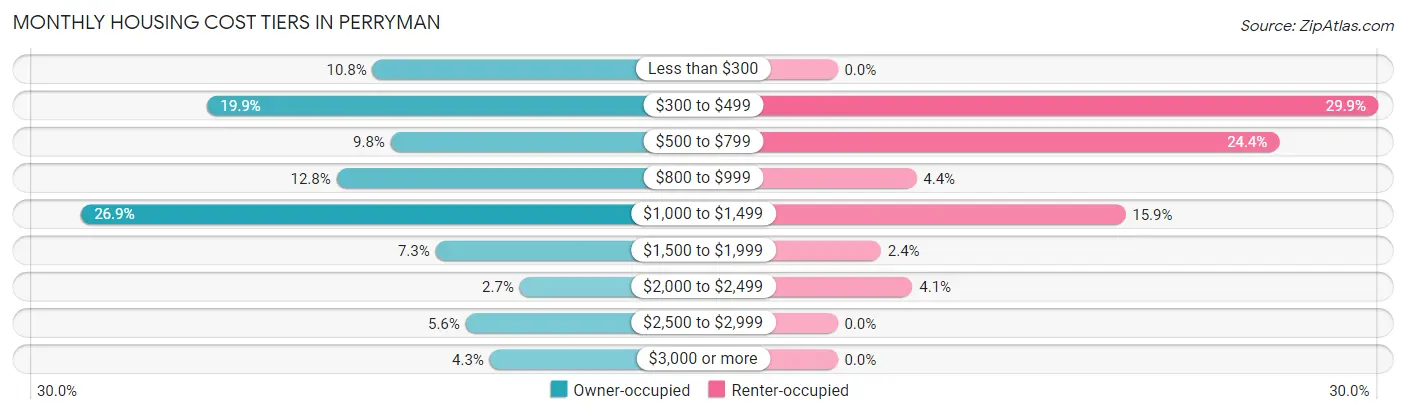
| Monthly Cost | Owner-occupied | Renter-occupied |
| Less than $300 | 65 (10.8%) | 0 (0.0%) |
| $300 to $499 | 120 (19.9%) | 137 (29.8%) |
| $500 to $799 | 59 (9.8%) | 112 (24.4%) |
| $800 to $999 | 77 (12.8%) | 20 (4.4%) |
| $1,000 to $1,499 | 162 (26.9%) | 73 (15.9%) |
| $1,500 to $1,999 | 44 (7.3%) | 11 (2.4%) |
| $2,000 to $2,499 | 16 (2.6%) | 19 (4.1%) |
| $2,500 to $2,999 | 34 (5.6%) | 0 (0.0%) |
| $3,000 or more | 26 (4.3%) | 0 (0.0%) |
| Total | 603 (100.0%) | 459 (100.0%) |
Physical Housing Characteristics in Perryman
Housing Structures in Perryman
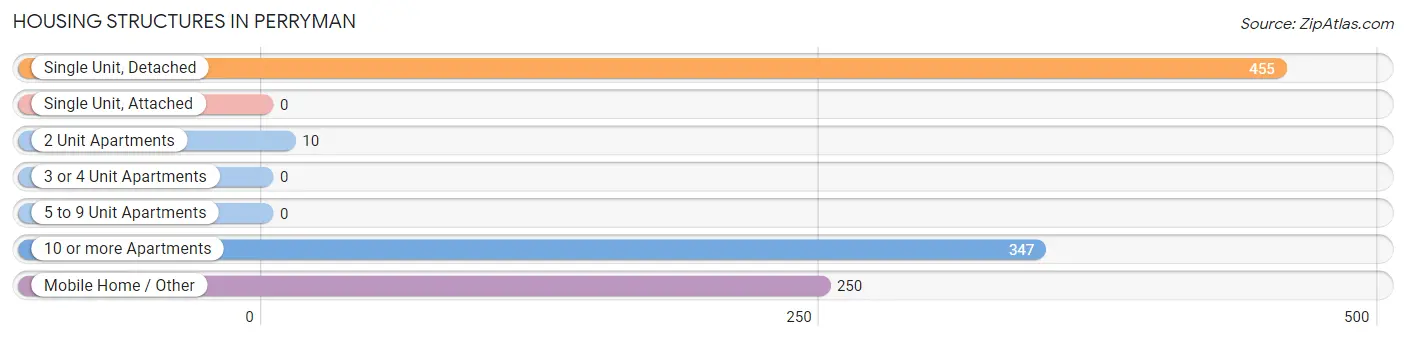
| Structure Type | # Housing Units | % Housing Units |
| Single Unit, Detached | 455 | 42.8% |
| Single Unit, Attached | 0 | 0.0% |
| 2 Unit Apartments | 10 | 0.9% |
| 3 or 4 Unit Apartments | 0 | 0.0% |
| 5 to 9 Unit Apartments | 0 | 0.0% |
| 10 or more Apartments | 347 | 32.7% |
| Mobile Home / Other | 250 | 23.5% |
| Total | 1,062 | 100.0% |
Housing Structures by Occupancy in Perryman
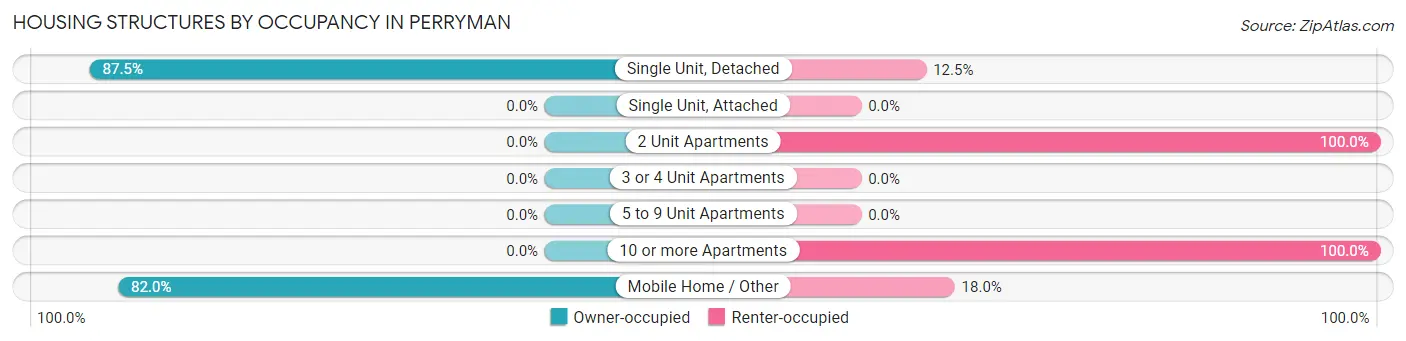
| Structure Type | Owner-occupied | Renter-occupied |
| Single Unit, Detached | 398 (87.5%) | 57 (12.5%) |
| Single Unit, Attached | 0 (0.0%) | 0 (0.0%) |
| 2 Unit Apartments | 0 (0.0%) | 10 (100.0%) |
| 3 or 4 Unit Apartments | 0 (0.0%) | 0 (0.0%) |
| 5 to 9 Unit Apartments | 0 (0.0%) | 0 (0.0%) |
| 10 or more Apartments | 0 (0.0%) | 347 (100.0%) |
| Mobile Home / Other | 205 (82.0%) | 45 (18.0%) |
| Total | 603 (56.8%) | 459 (43.2%) |
Housing Structures by Number of Rooms in Perryman
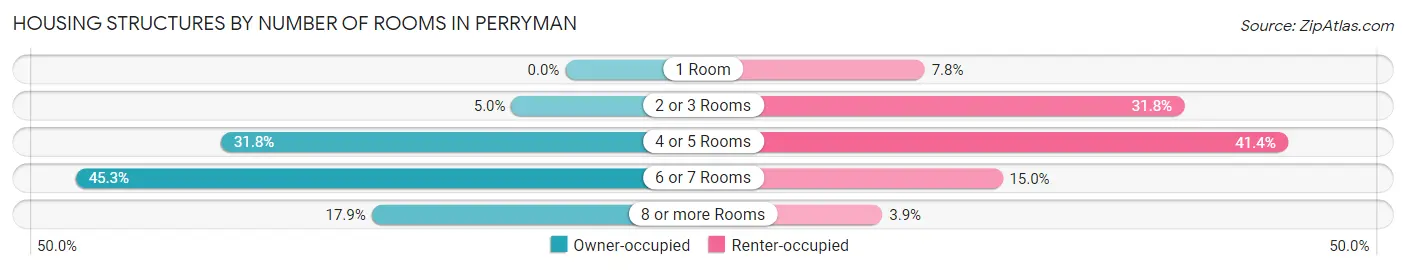
| Number of Rooms | Owner-occupied | Renter-occupied |
| 1 Room | 0 (0.0%) | 36 (7.8%) |
| 2 or 3 Rooms | 30 (5.0%) | 146 (31.8%) |
| 4 or 5 Rooms | 192 (31.8%) | 190 (41.4%) |
| 6 or 7 Rooms | 273 (45.3%) | 69 (15.0%) |
| 8 or more Rooms | 108 (17.9%) | 18 (3.9%) |
| Total | 603 (100.0%) | 459 (100.0%) |
Housing Structure by Heating Type in Perryman
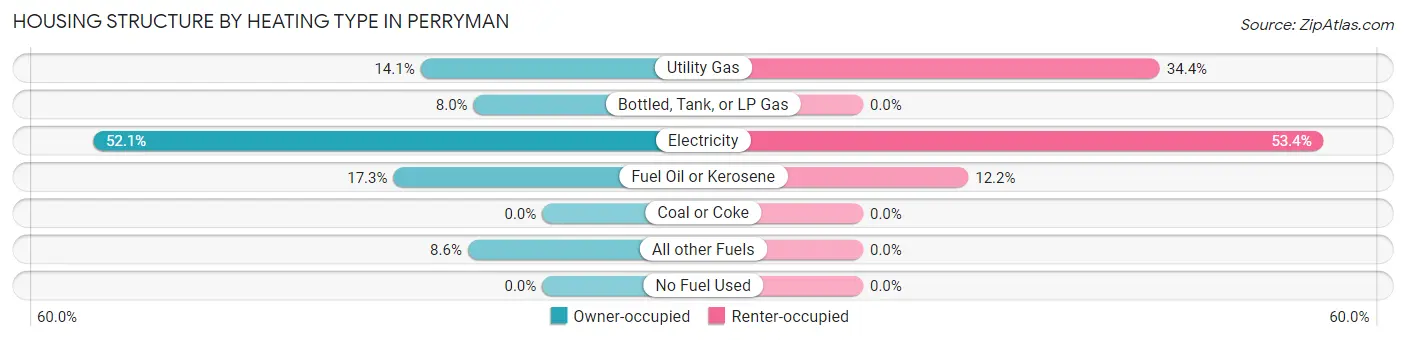
| Heating Type | Owner-occupied | Renter-occupied |
| Utility Gas | 85 (14.1%) | 158 (34.4%) |
| Bottled, Tank, or LP Gas | 48 (8.0%) | 0 (0.0%) |
| Electricity | 314 (52.1%) | 245 (53.4%) |
| Fuel Oil or Kerosene | 104 (17.2%) | 56 (12.2%) |
| Coal or Coke | 0 (0.0%) | 0 (0.0%) |
| All other Fuels | 52 (8.6%) | 0 (0.0%) |
| No Fuel Used | 0 (0.0%) | 0 (0.0%) |
| Total | 603 (100.0%) | 459 (100.0%) |
Household Vehicle Usage in Perryman
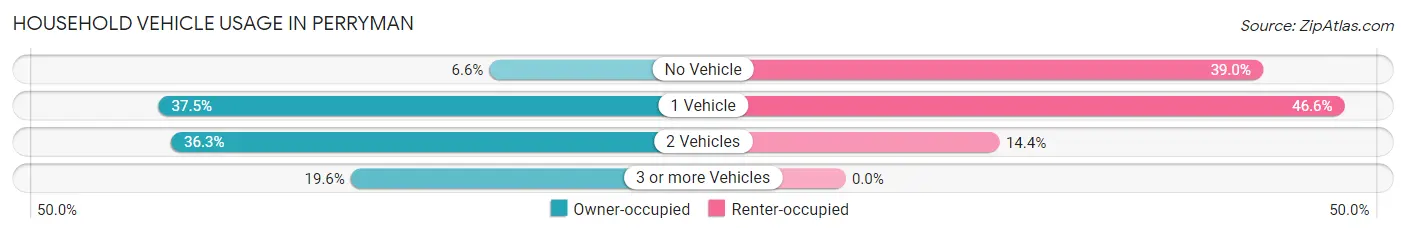
| Vehicles per Household | Owner-occupied | Renter-occupied |
| No Vehicle | 40 (6.6%) | 179 (39.0%) |
| 1 Vehicle | 226 (37.5%) | 214 (46.6%) |
| 2 Vehicles | 219 (36.3%) | 66 (14.4%) |
| 3 or more Vehicles | 118 (19.6%) | 0 (0.0%) |
| Total | 603 (100.0%) | 459 (100.0%) |
Real Estate & Mortgages in Perryman
Real Estate and Mortgage Overview in Perryman
| Characteristic | Without Mortgage | With Mortgage |
| Housing Units | 327 | 276 |
| Median Property Value | - | - |
| Median Household Income | $71,425 | $41 |
| Monthly Housing Costs | $681 | $26 |
| Real Estate Taxes | $2,840 | $35 |
Property Value by Mortgage Status in Perryman
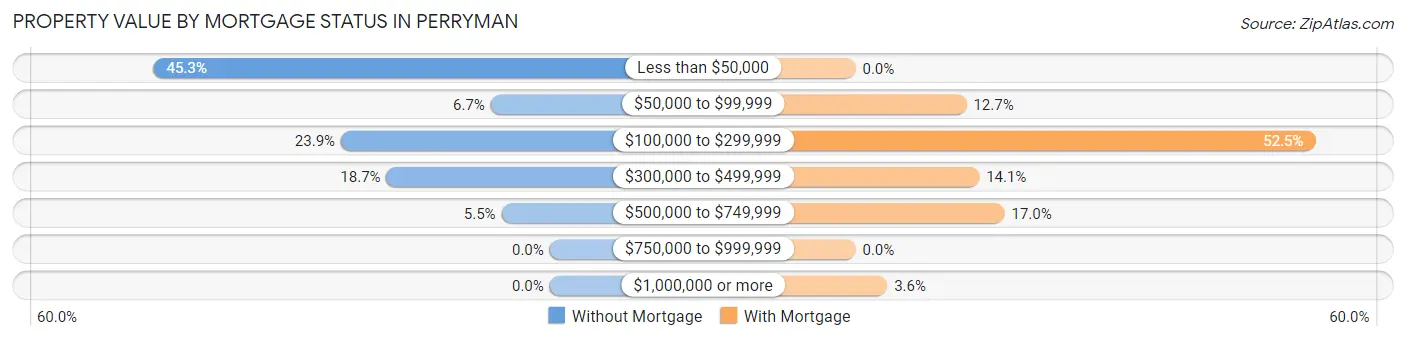
| Property Value | Without Mortgage | With Mortgage |
| Less than $50,000 | 148 (45.3%) | 0 (0.0%) |
| $50,000 to $99,999 | 22 (6.7%) | 35 (12.7%) |
| $100,000 to $299,999 | 78 (23.8%) | 145 (52.5%) |
| $300,000 to $499,999 | 61 (18.6%) | 39 (14.1%) |
| $500,000 to $749,999 | 18 (5.5%) | 47 (17.0%) |
| $750,000 to $999,999 | 0 (0.0%) | 0 (0.0%) |
| $1,000,000 or more | 0 (0.0%) | 10 (3.6%) |
| Total | 327 (100.0%) | 276 (100.0%) |
Household Income by Mortgage Status in Perryman
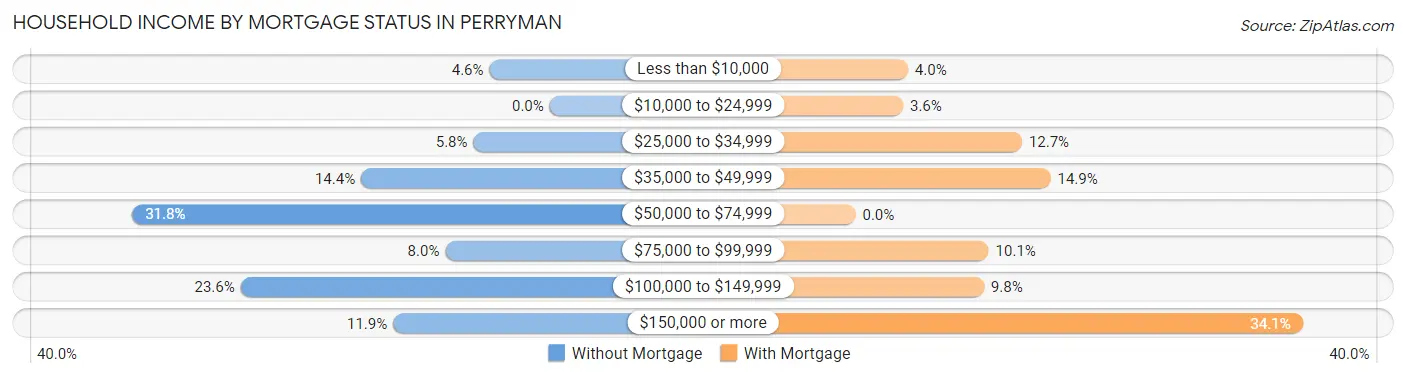
| Household Income | Without Mortgage | With Mortgage |
| Less than $10,000 | 15 (4.6%) | 11 (4.0%) |
| $10,000 to $24,999 | 0 (0.0%) | 10 (3.6%) |
| $25,000 to $34,999 | 19 (5.8%) | 35 (12.7%) |
| $35,000 to $49,999 | 47 (14.4%) | 41 (14.9%) |
| $50,000 to $74,999 | 104 (31.8%) | 0 (0.0%) |
| $75,000 to $99,999 | 26 (8.0%) | 28 (10.1%) |
| $100,000 to $149,999 | 77 (23.5%) | 27 (9.8%) |
| $150,000 or more | 39 (11.9%) | 94 (34.1%) |
| Total | 327 (100.0%) | 276 (100.0%) |
Property Value to Household Income Ratio in Perryman
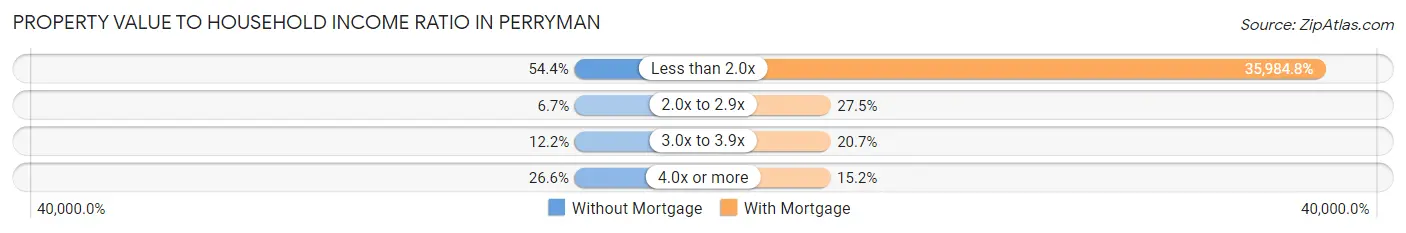
| Value-to-Income Ratio | Without Mortgage | With Mortgage |
| Less than 2.0x | 178 (54.4%) | 99,318 (35,984.8%) |
| 2.0x to 2.9x | 22 (6.7%) | 76 (27.5%) |
| 3.0x to 3.9x | 40 (12.2%) | 57 (20.6%) |
| 4.0x or more | 87 (26.6%) | 42 (15.2%) |
| Total | 327 (100.0%) | 276 (100.0%) |
Real Estate Taxes by Mortgage Status in Perryman
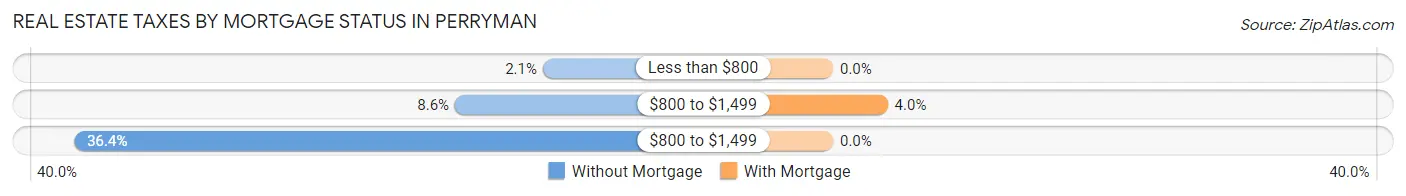
| Property Taxes | Without Mortgage | With Mortgage |
| Less than $800 | 7 (2.1%) | 0 (0.0%) |
| $800 to $1,499 | 28 (8.6%) | 11 (4.0%) |
| $800 to $1,499 | 119 (36.4%) | 0 (0.0%) |
| Total | 327 (100.0%) | 276 (100.0%) |
Health & Disability in Perryman
Health Insurance Coverage by Age in Perryman
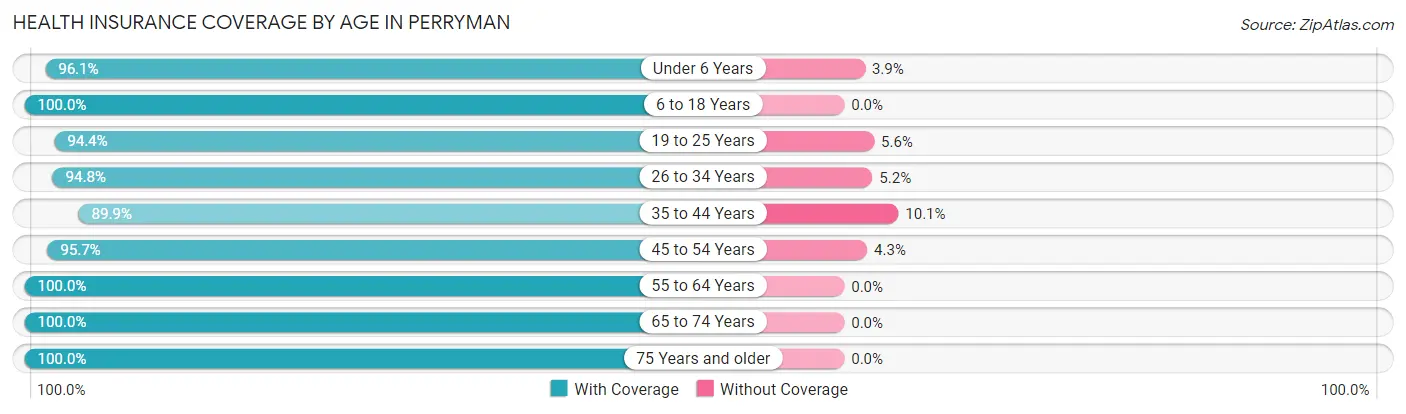
| Age Bracket | With Coverage | Without Coverage |
| Under 6 Years | 274 (96.1%) | 11 (3.9%) |
| 6 to 18 Years | 371 (100.0%) | 0 (0.0%) |
| 19 to 25 Years | 170 (94.4%) | 10 (5.6%) |
| 26 to 34 Years | 543 (94.8%) | 30 (5.2%) |
| 35 to 44 Years | 107 (89.9%) | 12 (10.1%) |
| 45 to 54 Years | 247 (95.7%) | 11 (4.3%) |
| 55 to 64 Years | 288 (100.0%) | 0 (0.0%) |
| 65 to 74 Years | 148 (100.0%) | 0 (0.0%) |
| 75 Years and older | 170 (100.0%) | 0 (0.0%) |
| Total | 2,318 (96.9%) | 74 (3.1%) |
Health Insurance Coverage by Citizenship Status in Perryman
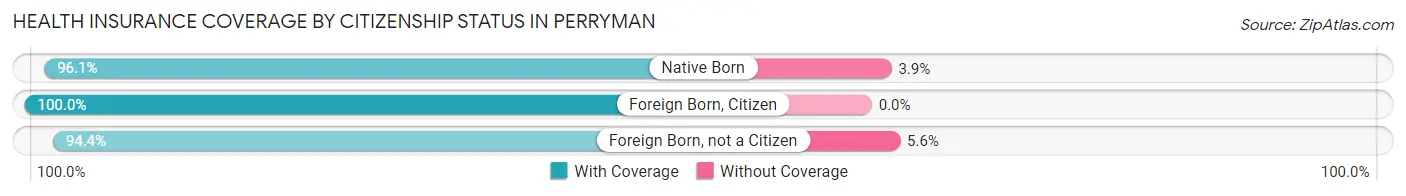
| Citizenship Status | With Coverage | Without Coverage |
| Native Born | 274 (96.1%) | 11 (3.9%) |
| Foreign Born, Citizen | 371 (100.0%) | 0 (0.0%) |
| Foreign Born, not a Citizen | 170 (94.4%) | 10 (5.6%) |
Health Insurance Coverage by Household Income in Perryman
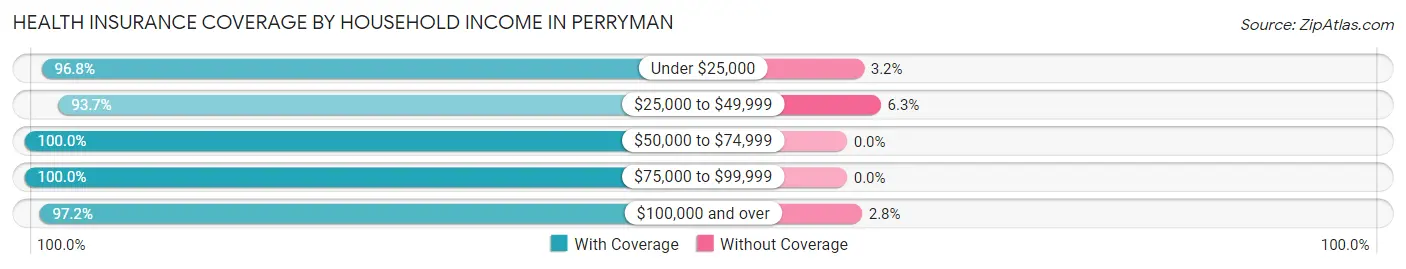
| Household Income | With Coverage | Without Coverage |
| Under $25,000 | 669 (96.8%) | 22 (3.2%) |
| $25,000 to $49,999 | 444 (93.7%) | 30 (6.3%) |
| $50,000 to $74,999 | 313 (100.0%) | 0 (0.0%) |
| $75,000 to $99,999 | 127 (100.0%) | 0 (0.0%) |
| $100,000 and over | 760 (97.2%) | 22 (2.8%) |
Public vs Private Health Insurance Coverage by Age in Perryman
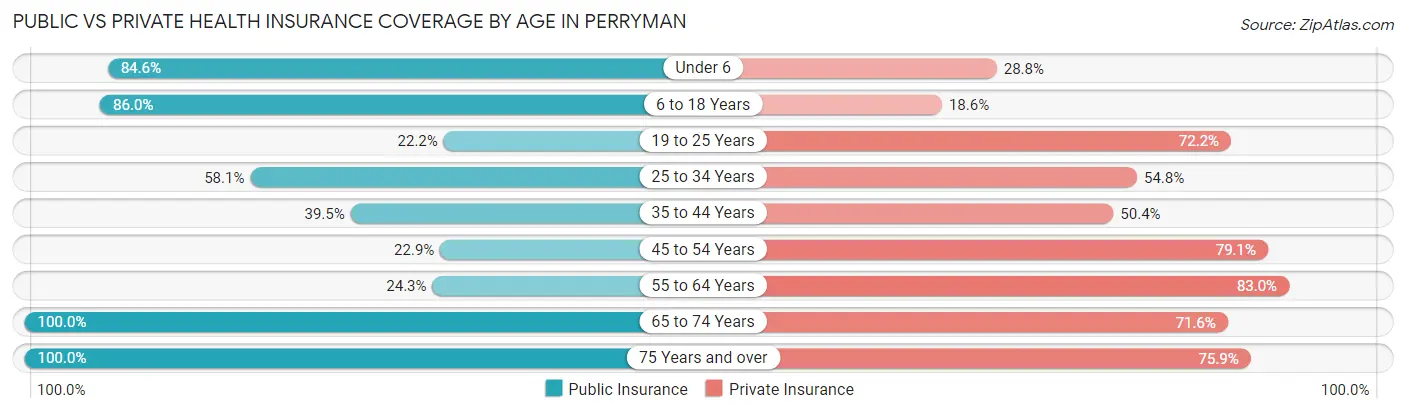
| Age Bracket | Public Insurance | Private Insurance |
| Under 6 | 241 (84.6%) | 82 (28.8%) |
| 6 to 18 Years | 319 (86.0%) | 69 (18.6%) |
| 19 to 25 Years | 40 (22.2%) | 130 (72.2%) |
| 25 to 34 Years | 333 (58.1%) | 314 (54.8%) |
| 35 to 44 Years | 47 (39.5%) | 60 (50.4%) |
| 45 to 54 Years | 59 (22.9%) | 204 (79.1%) |
| 55 to 64 Years | 70 (24.3%) | 239 (83.0%) |
| 65 to 74 Years | 148 (100.0%) | 106 (71.6%) |
| 75 Years and over | 170 (100.0%) | 129 (75.9%) |
| Total | 1,427 (59.7%) | 1,333 (55.7%) |
Disability Status by Sex by Age in Perryman
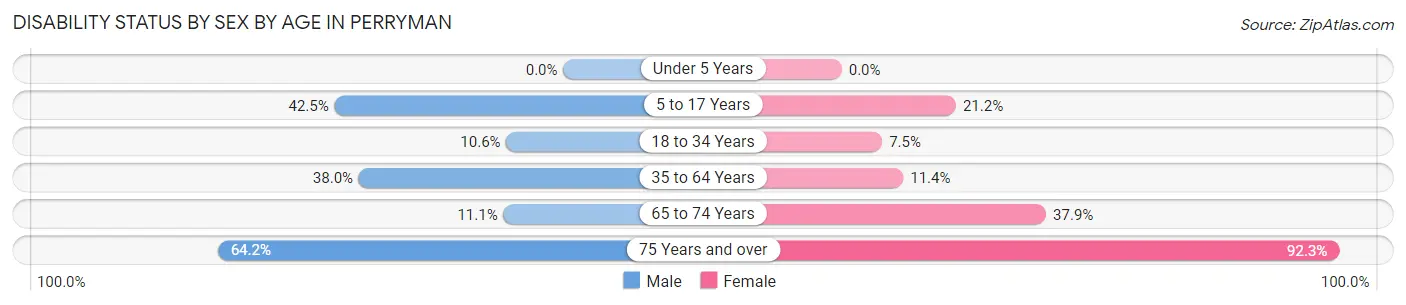
| Age Bracket | Male | Female |
| Under 5 Years | 0 (0.0%) | 0 (0.0%) |
| 5 to 17 Years | 127 (42.5%) | 25 (21.2%) |
| 18 to 34 Years | 37 (10.6%) | 33 (7.5%) |
| 35 to 64 Years | 126 (38.0%) | 38 (11.4%) |
| 65 to 74 Years | 10 (11.1%) | 22 (37.9%) |
| 75 Years and over | 34 (64.1%) | 108 (92.3%) |
Disability Class by Sex by Age in Perryman
Disability Class: Hearing Difficulty
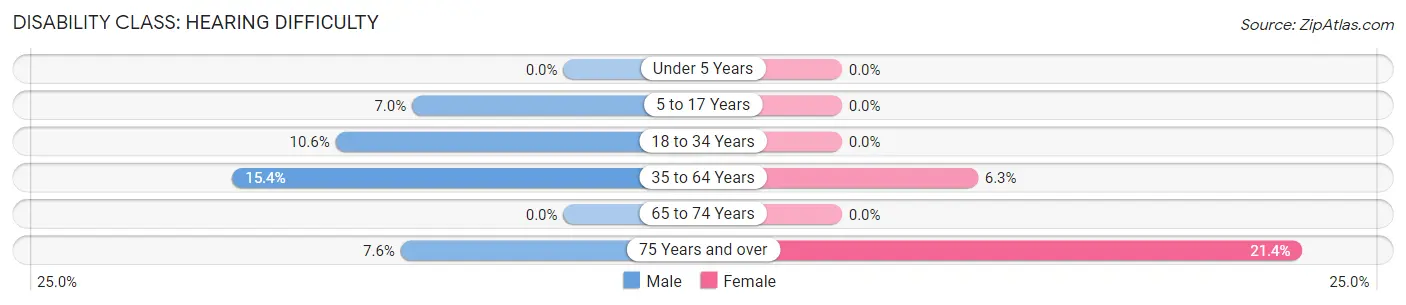
| Age Bracket | Male | Female |
| Under 5 Years | 0 (0.0%) | 0 (0.0%) |
| 5 to 17 Years | 21 (7.0%) | 0 (0.0%) |
| 18 to 34 Years | 37 (10.6%) | 0 (0.0%) |
| 35 to 64 Years | 51 (15.4%) | 21 (6.3%) |
| 65 to 74 Years | 0 (0.0%) | 0 (0.0%) |
| 75 Years and over | 4 (7.5%) | 25 (21.4%) |
Disability Class: Vision Difficulty
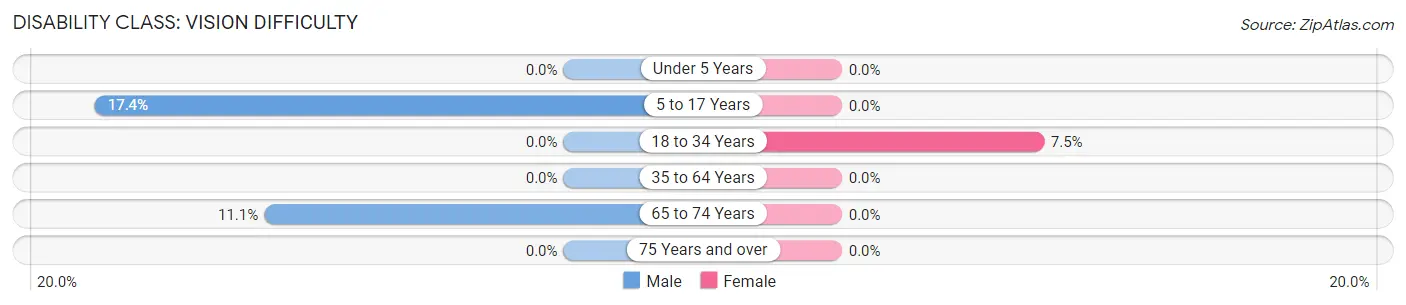
| Age Bracket | Male | Female |
| Under 5 Years | 0 (0.0%) | 0 (0.0%) |
| 5 to 17 Years | 52 (17.4%) | 0 (0.0%) |
| 18 to 34 Years | 0 (0.0%) | 33 (7.5%) |
| 35 to 64 Years | 0 (0.0%) | 0 (0.0%) |
| 65 to 74 Years | 10 (11.1%) | 0 (0.0%) |
| 75 Years and over | 0 (0.0%) | 0 (0.0%) |
Disability Class: Cognitive Difficulty
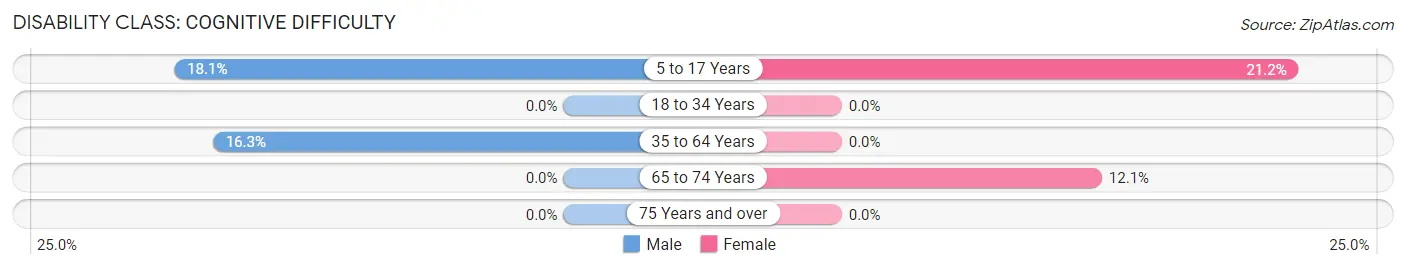
| Age Bracket | Male | Female |
| 5 to 17 Years | 54 (18.1%) | 25 (21.2%) |
| 18 to 34 Years | 0 (0.0%) | 0 (0.0%) |
| 35 to 64 Years | 54 (16.3%) | 0 (0.0%) |
| 65 to 74 Years | 0 (0.0%) | 7 (12.1%) |
| 75 Years and over | 0 (0.0%) | 0 (0.0%) |
Disability Class: Ambulatory Difficulty
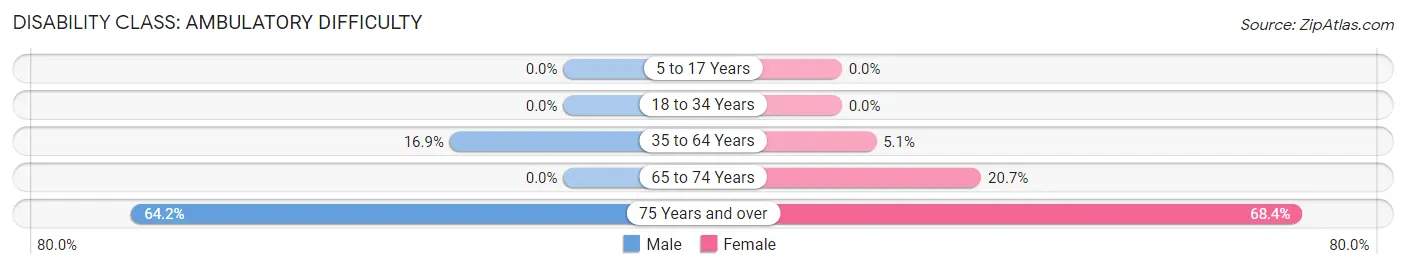
| Age Bracket | Male | Female |
| 5 to 17 Years | 0 (0.0%) | 0 (0.0%) |
| 18 to 34 Years | 0 (0.0%) | 0 (0.0%) |
| 35 to 64 Years | 56 (16.9%) | 17 (5.1%) |
| 65 to 74 Years | 0 (0.0%) | 12 (20.7%) |
| 75 Years and over | 34 (64.1%) | 80 (68.4%) |
Disability Class: Self-Care Difficulty
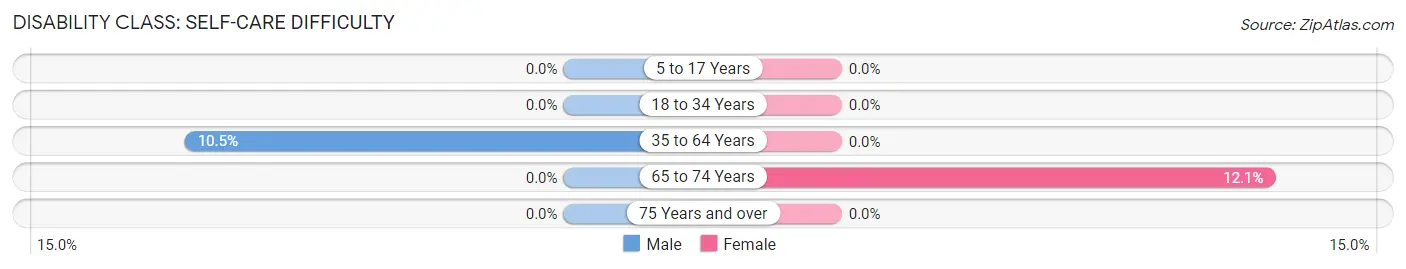
| Age Bracket | Male | Female |
| 5 to 17 Years | 0 (0.0%) | 0 (0.0%) |
| 18 to 34 Years | 0 (0.0%) | 0 (0.0%) |
| 35 to 64 Years | 35 (10.5%) | 0 (0.0%) |
| 65 to 74 Years | 0 (0.0%) | 7 (12.1%) |
| 75 Years and over | 0 (0.0%) | 0 (0.0%) |
Technology Access in Perryman
Computing Device Access in Perryman
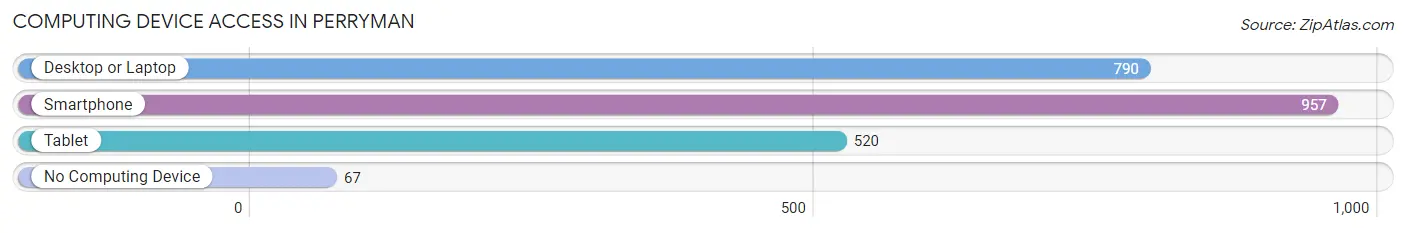
| Device Type | # Households | % Households |
| Desktop or Laptop | 790 | 74.4% |
| Smartphone | 957 | 90.1% |
| Tablet | 520 | 49.0% |
| No Computing Device | 67 | 6.3% |
| Total | 1,062 | 100.0% |
Internet Access in Perryman
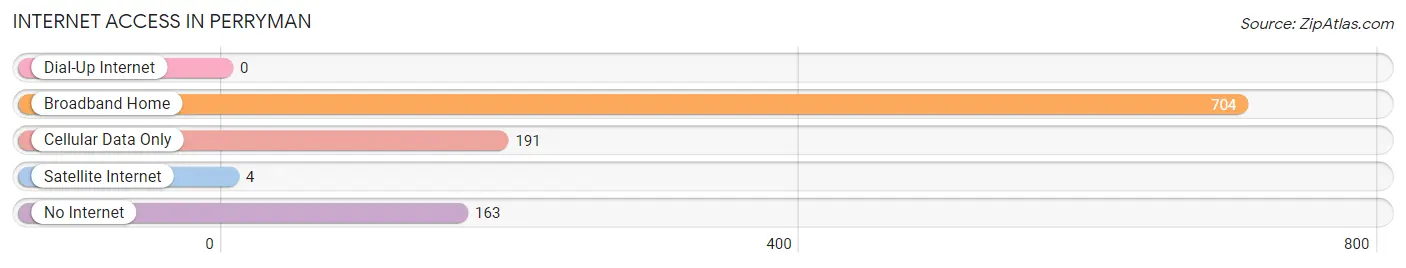
| Internet Type | # Households | % Households |
| Dial-Up Internet | 0 | 0.0% |
| Broadband Home | 704 | 66.3% |
| Cellular Data Only | 191 | 18.0% |
| Satellite Internet | 4 | 0.4% |
| No Internet | 163 | 15.3% |
| Total | 1,062 | 100.0% |
Perryman Summary
Perryman, Maryland is a small unincorporated community located in Harford County, Maryland. It is situated along the banks of the Susquehanna River, approximately 25 miles northeast of Baltimore. The community is home to a population of approximately 1,000 people, and is known for its rural charm and close-knit community.
History
The area that is now Perryman was first settled in the late 1700s by a group of German immigrants. The community was originally known as “Germantown”, and was home to a number of small farms and businesses. In 1820, the town was renamed “Perryman” after a local landowner, William Perryman.
The town grew slowly over the next century, and by the early 1900s, it had become a popular destination for weekend visitors from Baltimore and Washington, D.C. The town was home to a number of small businesses, including a general store, a post office, a blacksmith shop, and a grist mill.
In the 1950s, the town began to decline as many of its residents moved away in search of better economic opportunities. By the 1970s, the town had become a virtual ghost town, with only a handful of residents remaining.
In the 1980s, the town began to experience a resurgence as new residents moved in and began to restore the town’s historic buildings. Today, Perryman is a vibrant community with a strong sense of community and a commitment to preserving its rural charm.
Geography
Perryman is located in Harford County, Maryland, approximately 25 miles northeast of Baltimore. The town is situated along the banks of the Susquehanna River, and is surrounded by rolling hills and farmland. The town is home to a number of small parks and recreational areas, including the Perryman Park and the Perryman Nature Center.
Economy
The economy of Perryman is largely based on agriculture and tourism. The town is home to a number of small farms, which produce a variety of crops, including corn, soybeans, and hay. The town is also home to a number of small businesses, including a general store, a post office, and a blacksmith shop.
In recent years, the town has become a popular destination for weekend visitors from Baltimore and Washington, D.C. The town is home to a number of bed and breakfasts, as well as a number of restaurants and shops.
Demographics
As of the 2010 census, the population of Perryman was 1,000. The town is predominantly white (94.7%), with a small African American population (3.3%). The median household income in Perryman is $50,000, and the median home value is $150,000. The town is home to a number of churches, including the Perryman United Methodist Church and the Perryman Baptist Church.
Common Questions
What is Per Capita Income in Perryman?
Per Capita income in Perryman is $30,713.
What is the Median Family Income in Perryman?
Median Family Income in Perryman is $70,000.
What is the Median Household income in Perryman?
Median Household Income in Perryman is $48,158.
What is Income or Wage Gap in Perryman?
Income or Wage Gap in Perryman is 8.1%.
Women in Perryman earn 91.9 cents for every dollar earned by a man.
What is Inequality or Gini Index in Perryman?
Inequality or Gini Index in Perryman is 0.52.
What is the Total Population of Perryman?
Total Population of Perryman is 2,403.
What is the Total Male Population of Perryman?
Total Male Population of Perryman is 1,184.
What is the Total Female Population of Perryman?
Total Female Population of Perryman is 1,219.
What is the Ratio of Males per 100 Females in Perryman?
There are 97.13 Males per 100 Females in Perryman.
What is the Ratio of Females per 100 Males in Perryman?
There are 102.96 Females per 100 Males in Perryman.
What is the Median Population Age in Perryman?
Median Population Age in Perryman is 31.5 Years.
What is the Average Family Size in Perryman
Average Family Size in Perryman is 2.8 People.
What is the Average Household Size in Perryman
Average Household Size in Perryman is 2.2 People.
How Large is the Labor Force in Perryman?
There are 1,155 People in the Labor Forcein in Perryman.
What is the Percentage of People in the Labor Force in Perryman?
64.0% of People are in the Labor Force in Perryman.
What is the Unemployment Rate in Perryman?
Unemployment Rate in Perryman is 19.7%.