Fruitland, MD Map & Demographics
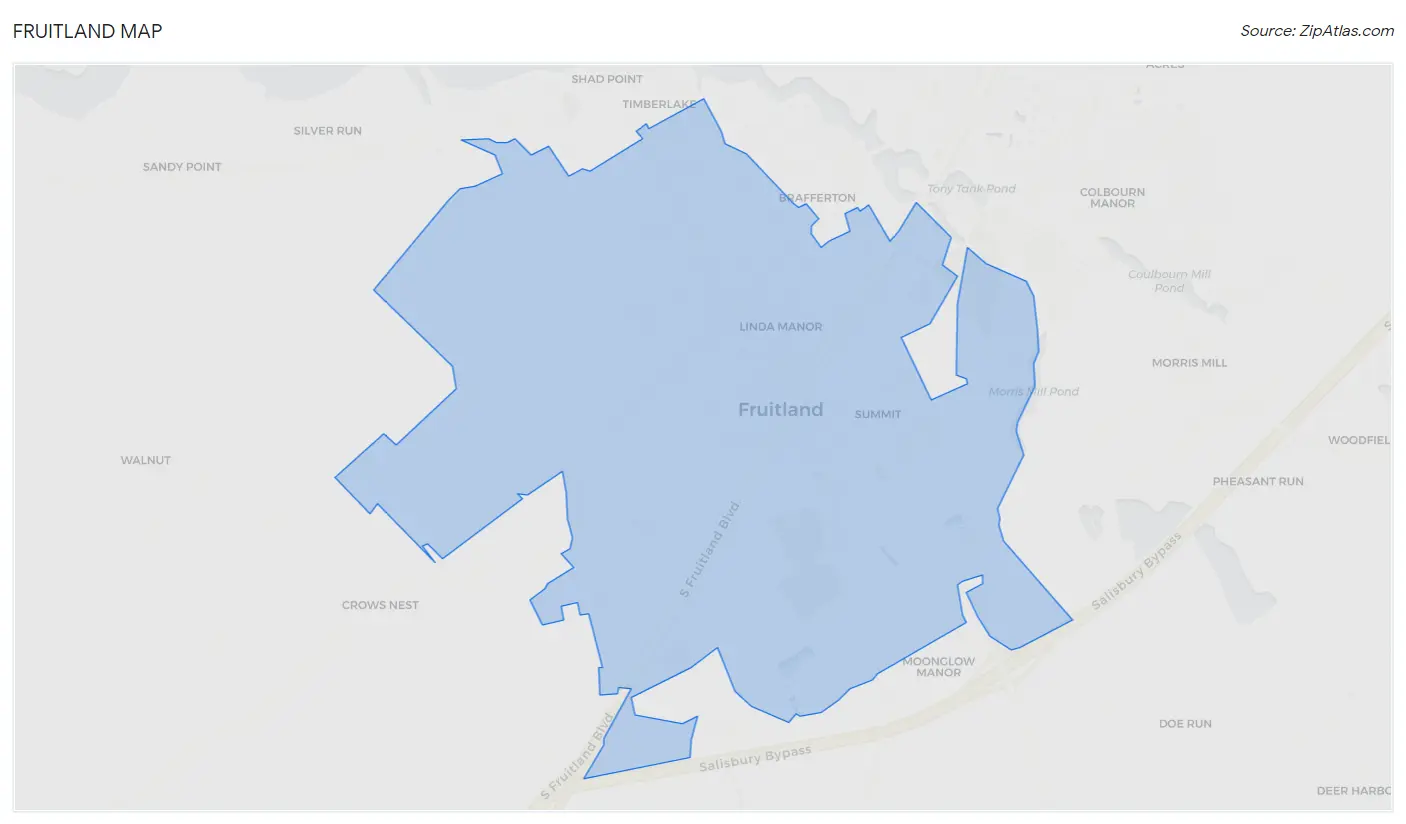
Fruitland Map
Fruitland Overview
$28,277
PER CAPITA INCOME
$84,643
AVG FAMILY INCOME
$61,205
AVG HOUSEHOLD INCOME
9.4%
WAGE / INCOME GAP [ % ]
90.6¢/ $1
WAGE / INCOME GAP [ $ ]
0.38
INEQUALITY / GINI INDEX
5,603
TOTAL POPULATION
2,577
MALE POPULATION
3,026
FEMALE POPULATION
85.16
MALES / 100 FEMALES
117.42
FEMALES / 100 MALES
28.9
MEDIAN AGE
3.4
AVG FAMILY SIZE
2.8
AVG HOUSEHOLD SIZE
2,765
LABOR FORCE [ PEOPLE ]
62.2%
PERCENT IN LABOR FORCE
11.1%
UNEMPLOYMENT RATE
Fruitland Zip Codes
Fruitland Area Codes
Income in Fruitland
Income Overview in Fruitland
Per Capita Income in Fruitland is $28,277, while median incomes of families and households are $84,643 and $61,205 respectively.
| Characteristic | Number | Measure |
| Per Capita Income | 5,603 | $28,277 |
| Median Family Income | 1,186 | $84,643 |
| Mean Family Income | 1,186 | $94,232 |
| Median Household Income | 2,016 | $61,205 |
| Mean Household Income | 2,016 | $76,336 |
| Income Deficit | 1,186 | $0 |
| Wage / Income Gap (%) | 5,603 | 9.40% |
| Wage / Income Gap ($) | 5,603 | 90.60¢ per $1 |
| Gini / Inequality Index | 5,603 | 0.38 |
Earnings by Sex in Fruitland
Average Earnings in Fruitland are $33,532, $35,046 for men and $31,753 for women, a difference of 9.4%.
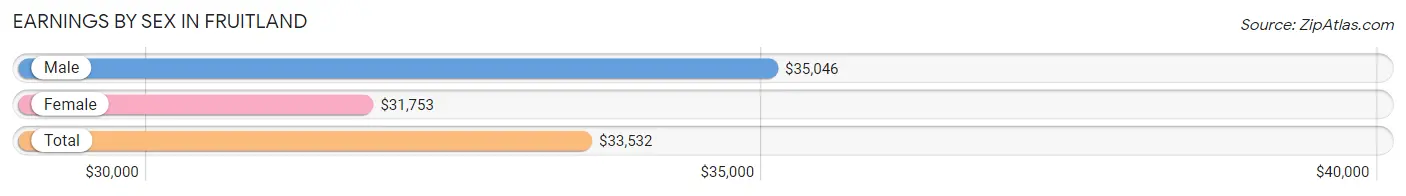
| Sex | Number | Average Earnings |
| Male | 1,351 (45.4%) | $35,046 |
| Female | 1,627 (54.6%) | $31,753 |
| Total | 2,978 (100.0%) | $33,532 |
Earnings by Sex by Income Bracket in Fruitland
The most common earnings brackets in Fruitland are $55,000 to $64,999 for men (150 | 11.1%) and $35,000 to $39,999 for women (153 | 9.4%).
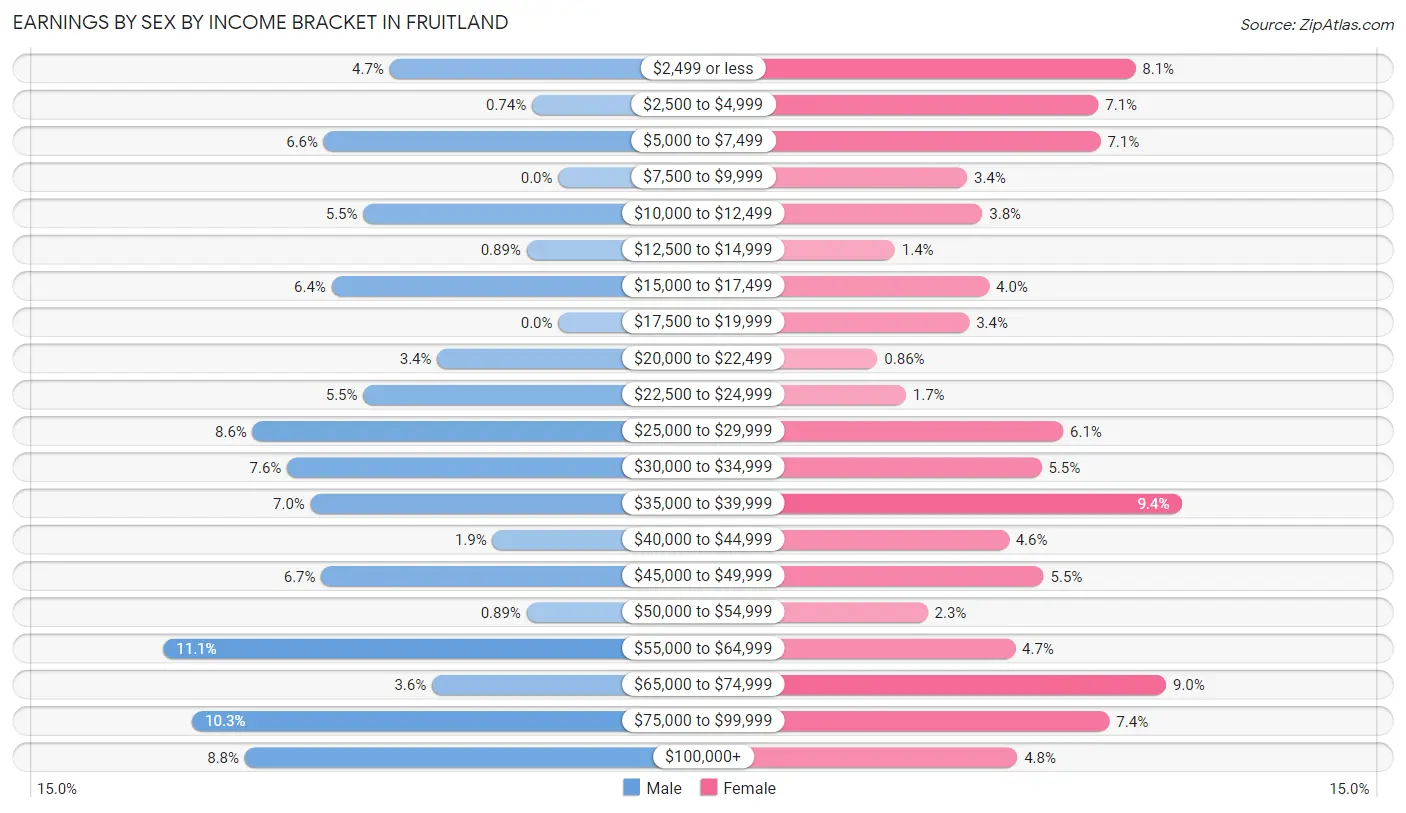
| Income | Male | Female |
| $2,499 or less | 64 (4.7%) | 132 (8.1%) |
| $2,500 to $4,999 | 10 (0.7%) | 115 (7.1%) |
| $5,000 to $7,499 | 89 (6.6%) | 116 (7.1%) |
| $7,500 to $9,999 | 0 (0.0%) | 55 (3.4%) |
| $10,000 to $12,499 | 74 (5.5%) | 62 (3.8%) |
| $12,500 to $14,999 | 12 (0.9%) | 22 (1.3%) |
| $15,000 to $17,499 | 86 (6.4%) | 65 (4.0%) |
| $17,500 to $19,999 | 0 (0.0%) | 56 (3.4%) |
| $20,000 to $22,499 | 46 (3.4%) | 14 (0.9%) |
| $22,500 to $24,999 | 74 (5.5%) | 27 (1.7%) |
| $25,000 to $29,999 | 116 (8.6%) | 99 (6.1%) |
| $30,000 to $34,999 | 103 (7.6%) | 89 (5.5%) |
| $35,000 to $39,999 | 94 (7.0%) | 153 (9.4%) |
| $40,000 to $44,999 | 25 (1.8%) | 74 (4.5%) |
| $45,000 to $49,999 | 90 (6.7%) | 90 (5.5%) |
| $50,000 to $54,999 | 12 (0.9%) | 37 (2.3%) |
| $55,000 to $64,999 | 150 (11.1%) | 77 (4.7%) |
| $65,000 to $74,999 | 48 (3.5%) | 146 (9.0%) |
| $75,000 to $99,999 | 139 (10.3%) | 120 (7.4%) |
| $100,000+ | 119 (8.8%) | 78 (4.8%) |
| Total | 1,351 (100.0%) | 1,627 (100.0%) |
Earnings by Sex by Educational Attainment in Fruitland
Average earnings in Fruitland are $47,668 for men and $43,661 for women, a difference of 8.4%. Men with an educational attainment of bachelor's degree enjoy the highest average annual earnings of $81,452, while those with high school diploma education earn the least with $35,244. Women with an educational attainment of graduate degree earn the most with the average annual earnings of $66,304, while those with high school diploma education have the smallest earnings of $30,871.
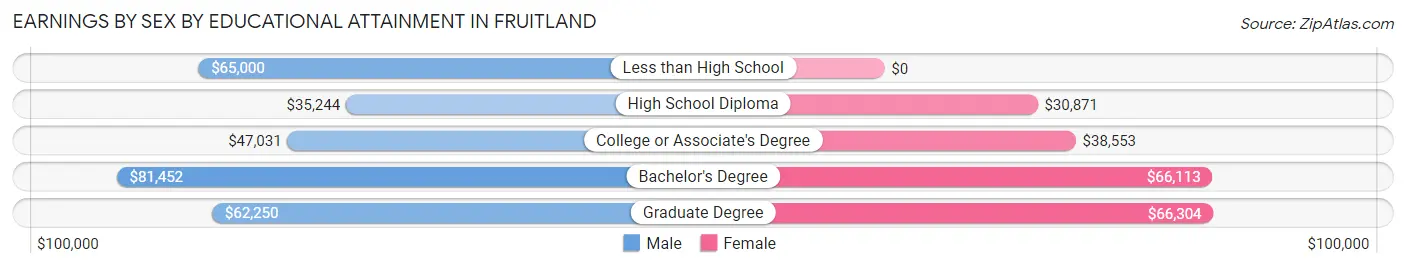
| Educational Attainment | Male Income | Female Income |
| Less than High School | $65,000 | $0 |
| High School Diploma | $35,244 | $30,871 |
| College or Associate's Degree | $47,031 | $38,553 |
| Bachelor's Degree | $81,452 | $66,113 |
| Graduate Degree | $62,250 | $66,304 |
| Total | $47,668 | $43,661 |
Family Income in Fruitland
Family Income Brackets in Fruitland
According to the Fruitland family income data, there are 305 families falling into the $100,000 to $149,999 income range, which is the most common income bracket and makes up 25.7% of all families.
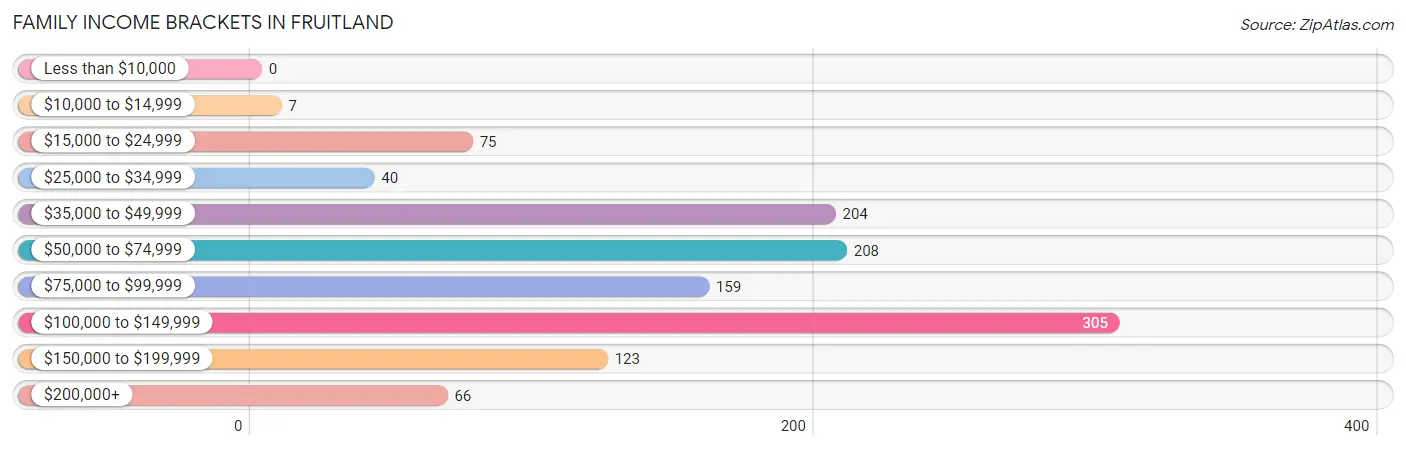
| Income Bracket | # Families | % Families |
| Less than $10,000 | 0 | 0.0% |
| $10,000 to $14,999 | 7 | 0.6% |
| $15,000 to $24,999 | 75 | 6.3% |
| $25,000 to $34,999 | 40 | 3.4% |
| $35,000 to $49,999 | 204 | 17.2% |
| $50,000 to $74,999 | 208 | 17.5% |
| $75,000 to $99,999 | 159 | 13.4% |
| $100,000 to $149,999 | 305 | 25.7% |
| $150,000 to $199,999 | 123 | 10.4% |
| $200,000+ | 66 | 5.6% |
Family Income by Famaliy Size in Fruitland
4-person families (165 | 13.9%) account for the highest median family income in Fruitland with $135,329 per family, while 4-person families (165 | 13.9%) have the highest median income of $33,832 per family member.
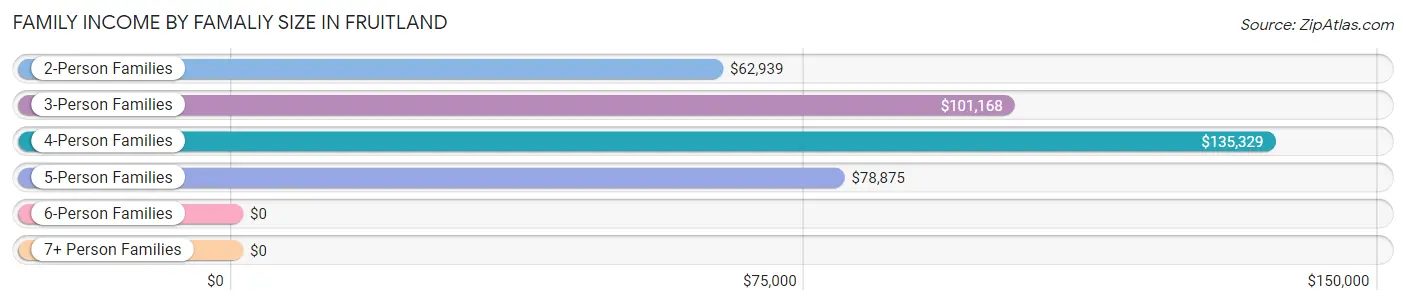
| Income Bracket | # Families | Median Income |
| 2-Person Families | 420 (35.4%) | $62,939 |
| 3-Person Families | 313 (26.4%) | $101,168 |
| 4-Person Families | 165 (13.9%) | $135,329 |
| 5-Person Families | 260 (21.9%) | $78,875 |
| 6-Person Families | 28 (2.4%) | $0 |
| 7+ Person Families | 0 (0.0%) | $0 |
| Total | 1,186 (100.0%) | $84,643 |
Family Income by Number of Earners in Fruitland
The median family income in Fruitland is $84,643, with families comprising 2 earners (376) having the highest median family income of $125,536, while families with no earners (254) have the lowest median family income of $49,205, accounting for 31.7% and 21.4% of families, respectively.
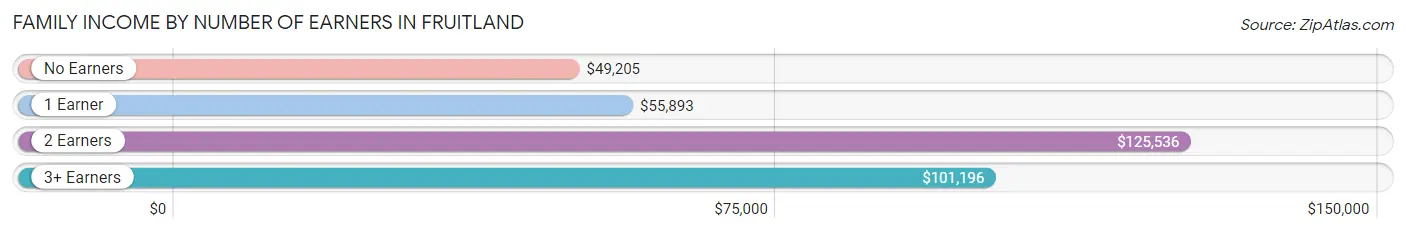
| Number of Earners | # Families | Median Income |
| No Earners | 254 (21.4%) | $49,205 |
| 1 Earner | 304 (25.6%) | $55,893 |
| 2 Earners | 376 (31.7%) | $125,536 |
| 3+ Earners | 252 (21.2%) | $101,196 |
| Total | 1,186 (100.0%) | $84,643 |
Household Income in Fruitland
Household Income Brackets in Fruitland
With 417 households falling in the category, the $50,000 to $74,999 income range is the most frequent in Fruitland, accounting for 20.7% of all households. In contrast, only 6 households (0.3%) fall into the $10,000 to $14,999 income bracket, making it the least populous group.
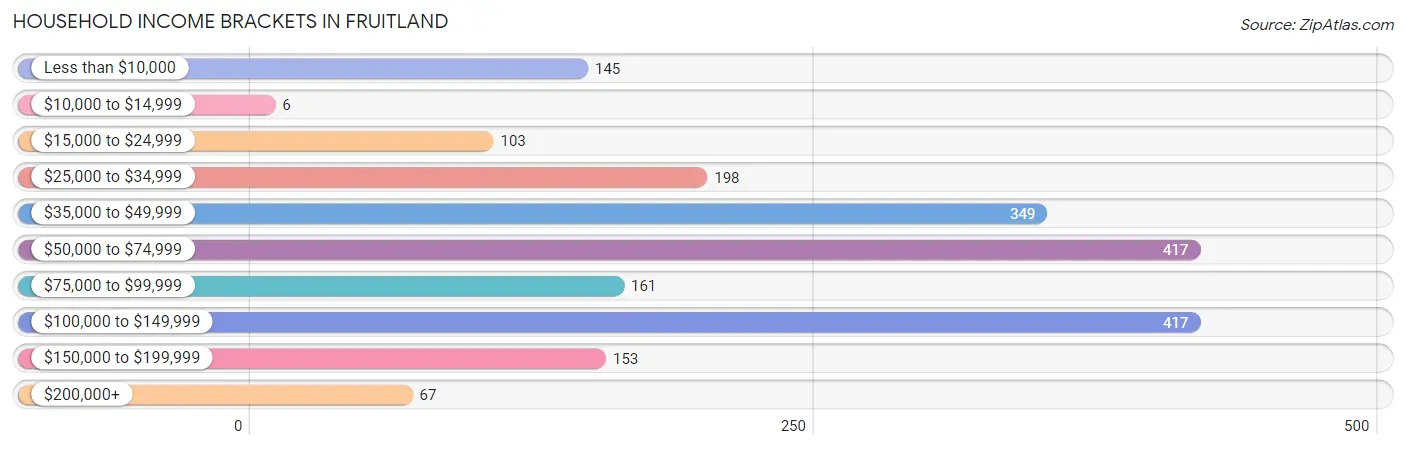
| Income Bracket | # Households | % Households |
| Less than $10,000 | 145 | 7.2% |
| $10,000 to $14,999 | 6 | 0.3% |
| $15,000 to $24,999 | 103 | 5.1% |
| $25,000 to $34,999 | 198 | 9.8% |
| $35,000 to $49,999 | 349 | 17.3% |
| $50,000 to $74,999 | 417 | 20.7% |
| $75,000 to $99,999 | 161 | 8.0% |
| $100,000 to $149,999 | 417 | 20.7% |
| $150,000 to $199,999 | 153 | 7.6% |
| $200,000+ | 67 | 3.3% |
Household Income by Householder Age in Fruitland
The median household income in Fruitland is $61,205, with the highest median household income of $89,375 found in the 25 to 44 years age bracket for the primary householder. A total of 769 households (38.1%) fall into this category. Meanwhile, the 15 to 24 years age bracket for the primary householder has the lowest median household income of $0, with 217 households (10.8%) in this group.
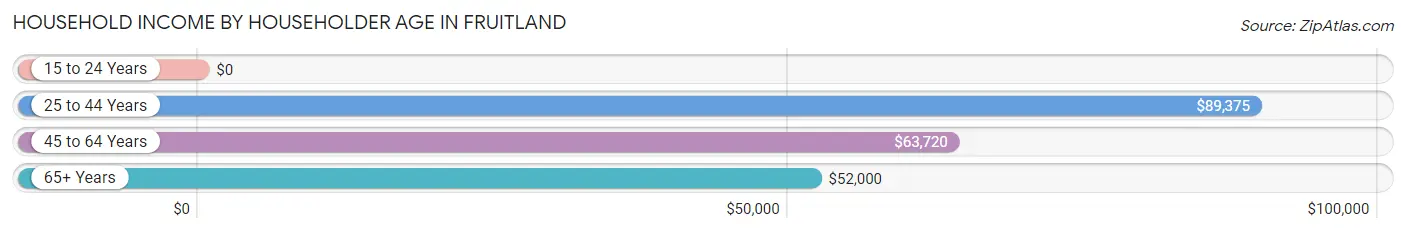
| Income Bracket | # Households | Median Income |
| 15 to 24 Years | 217 (10.8%) | $0 |
| 25 to 44 Years | 769 (38.1%) | $89,375 |
| 45 to 64 Years | 602 (29.9%) | $63,720 |
| 65+ Years | 428 (21.2%) | $52,000 |
| Total | 2,016 (100.0%) | $61,205 |
Poverty in Fruitland
Income Below Poverty by Sex and Age in Fruitland
With 9.1% poverty level for males and 18.2% for females among the residents of Fruitland, 75 year old and over males and 18 to 24 year old females are the most vulnerable to poverty, with 15 males (36.6%) and 413 females (66.6%) in their respective age groups living below the poverty level.
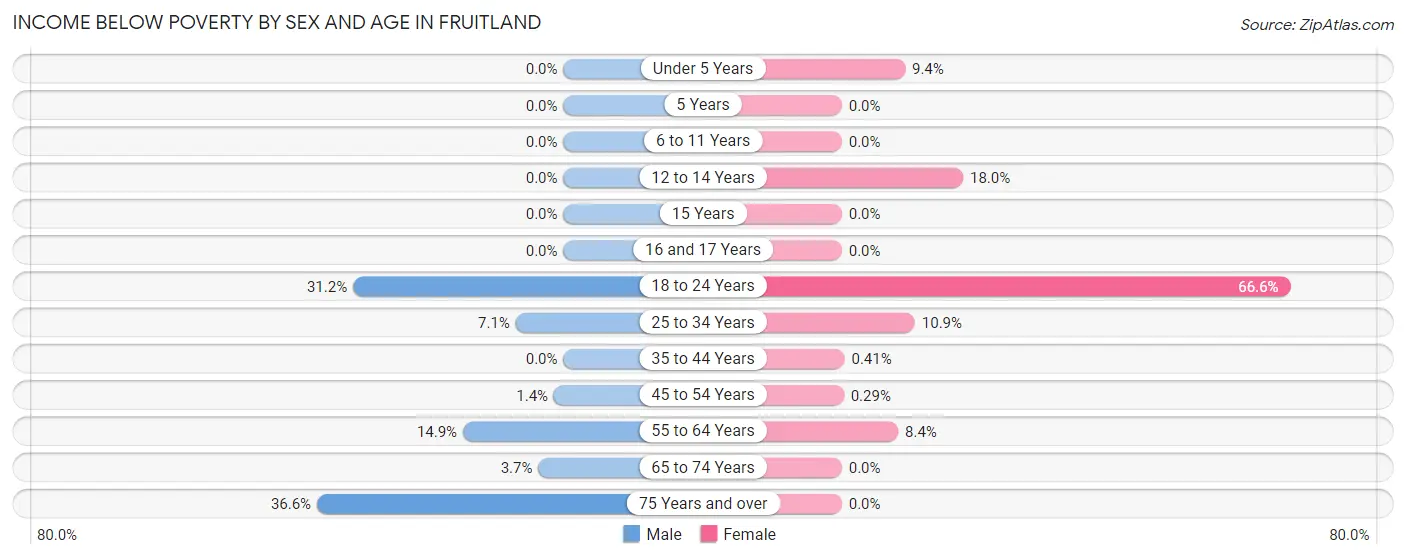
| Age Bracket | Male | Female |
| Under 5 Years | 0 (0.0%) | 23 (9.4%) |
| 5 Years | 0 (0.0%) | 0 (0.0%) |
| 6 to 11 Years | 0 (0.0%) | 0 (0.0%) |
| 12 to 14 Years | 0 (0.0%) | 27 (18.0%) |
| 15 Years | 0 (0.0%) | 0 (0.0%) |
| 16 and 17 Years | 0 (0.0%) | 0 (0.0%) |
| 18 to 24 Years | 164 (31.2%) | 413 (66.6%) |
| 25 to 34 Years | 23 (7.1%) | 61 (10.8%) |
| 35 to 44 Years | 0 (0.0%) | 1 (0.4%) |
| 45 to 54 Years | 6 (1.4%) | 1 (0.3%) |
| 55 to 64 Years | 17 (14.9%) | 24 (8.4%) |
| 65 to 74 Years | 9 (3.7%) | 0 (0.0%) |
| 75 Years and over | 15 (36.6%) | 0 (0.0%) |
| Total | 234 (9.1%) | 550 (18.2%) |
Income Above Poverty by Sex and Age in Fruitland
According to the poverty statistics in Fruitland, males aged under 5 years and females aged 6 to 11 years are the age groups that are most secure financially, with 100.0% of males and 100.0% of females in these age groups living above the poverty line.
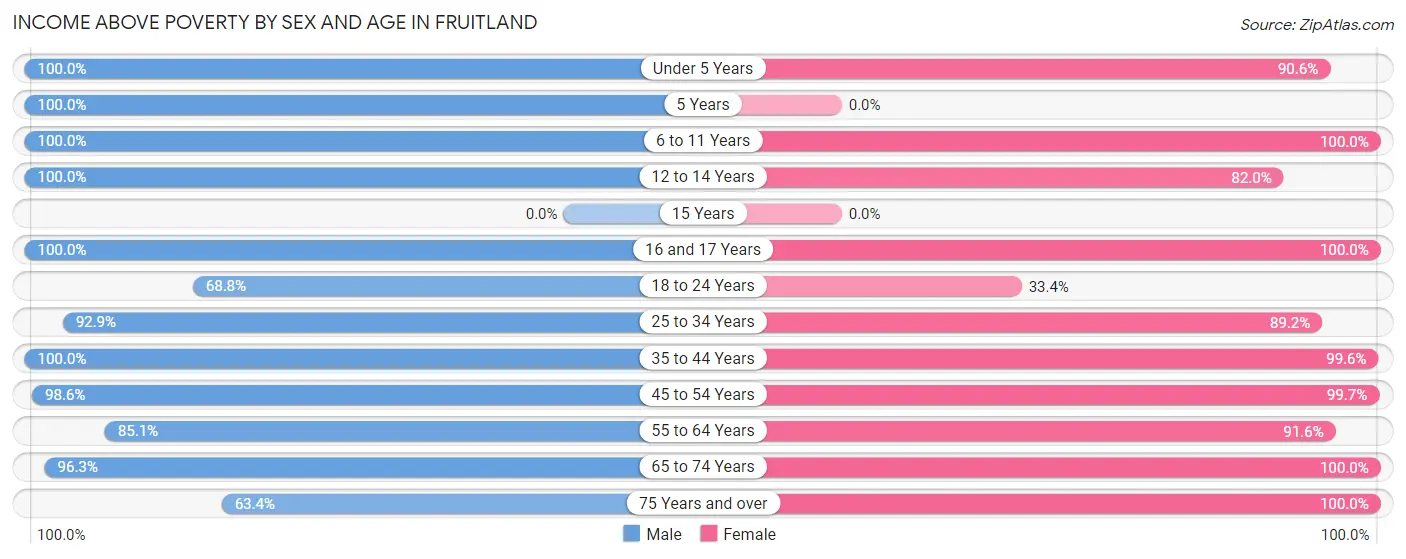
| Age Bracket | Male | Female |
| Under 5 Years | 304 (100.0%) | 222 (90.6%) |
| 5 Years | 57 (100.0%) | 0 (0.0%) |
| 6 to 11 Years | 123 (100.0%) | 203 (100.0%) |
| 12 to 14 Years | 76 (100.0%) | 123 (82.0%) |
| 15 Years | 0 (0.0%) | 0 (0.0%) |
| 16 and 17 Years | 87 (100.0%) | 13 (100.0%) |
| 18 to 24 Years | 361 (68.8%) | 207 (33.4%) |
| 25 to 34 Years | 302 (92.9%) | 501 (89.1%) |
| 35 to 44 Years | 252 (100.0%) | 240 (99.6%) |
| 45 to 54 Years | 423 (98.6%) | 338 (99.7%) |
| 55 to 64 Years | 97 (85.1%) | 263 (91.6%) |
| 65 to 74 Years | 233 (96.3%) | 281 (100.0%) |
| 75 Years and over | 26 (63.4%) | 84 (100.0%) |
| Total | 2,341 (90.9%) | 2,475 (81.8%) |
Income Below Poverty Among Married-Couple Families in Fruitland
The poverty statistics for married-couple families in Fruitland show that 1.9% or 18 of the total 923 families live below the poverty line. Families with 3 or 4 children have the highest poverty rate of 8.7%, comprising of 11 families. On the other hand, families with 1 or 2 children have the lowest poverty rate of 0.0%, which includes 0 families.
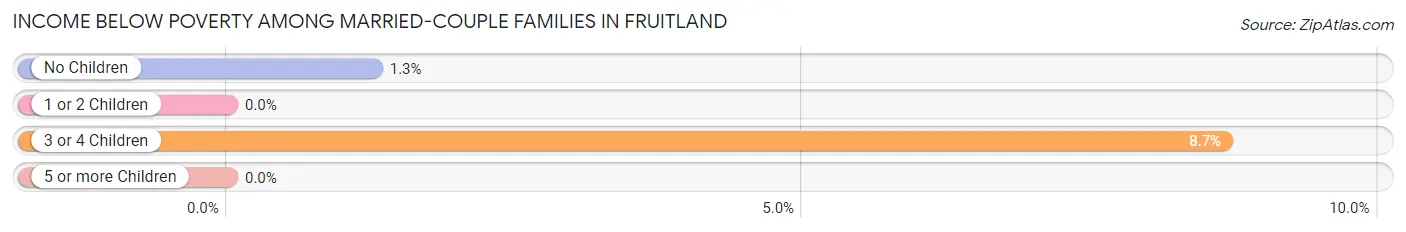
| Children | Above Poverty | Below Poverty |
| No Children | 547 (98.7%) | 7 (1.3%) |
| 1 or 2 Children | 242 (100.0%) | 0 (0.0%) |
| 3 or 4 Children | 116 (91.3%) | 11 (8.7%) |
| 5 or more Children | 0 (0.0%) | 0 (0.0%) |
| Total | 905 (98.1%) | 18 (1.9%) |
Income Below Poverty Among Single-Parent Households in Fruitland
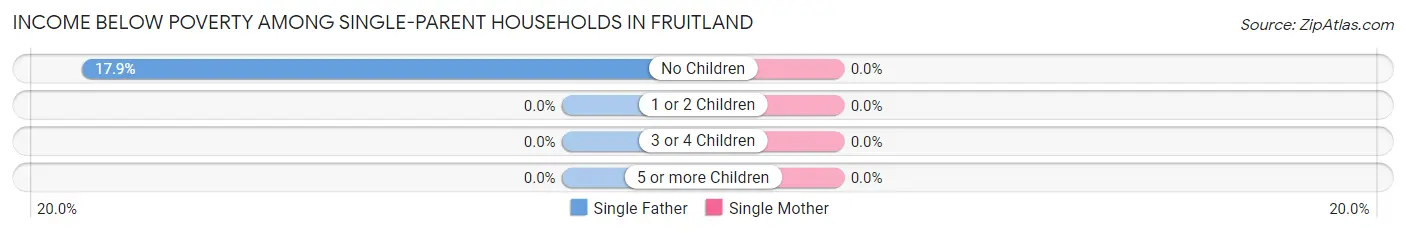
| Children | Single Father | Single Mother |
| No Children | 10 (17.9%) | 0 (0.0%) |
| 1 or 2 Children | 0 (0.0%) | 0 (0.0%) |
| 3 or 4 Children | 0 (0.0%) | 0 (0.0%) |
| 5 or more Children | 0 (0.0%) | 0 (0.0%) |
| Total | 10 (6.8%) | 0 (0.0%) |
Income Below Poverty Among Married-Couple vs Single-Parent Households in Fruitland
The poverty data for Fruitland shows that 18 of the married-couple family households (1.9%) and 10 of the single-parent households (3.8%) are living below the poverty level. Within the married-couple family households, those with 3 or 4 children have the highest poverty rate, with 11 households (8.7%) falling below the poverty line. Among the single-parent households, those with no children have the highest poverty rate, with 10 household (12.8%) living below poverty.
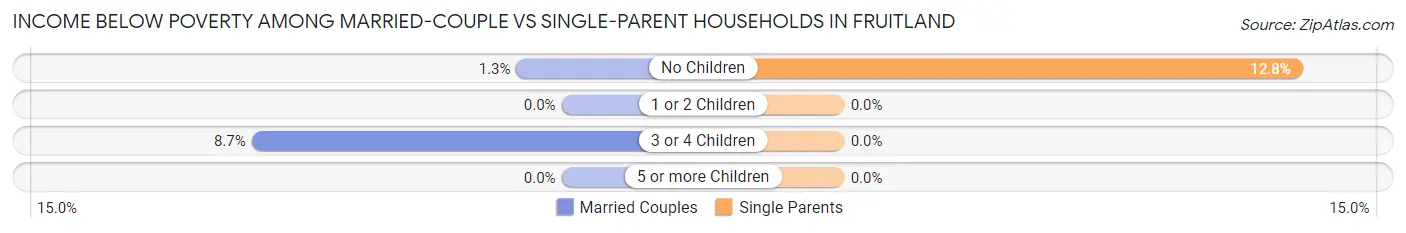
| Children | Married-Couple Families | Single-Parent Households |
| No Children | 7 (1.3%) | 10 (12.8%) |
| 1 or 2 Children | 0 (0.0%) | 0 (0.0%) |
| 3 or 4 Children | 11 (8.7%) | 0 (0.0%) |
| 5 or more Children | 0 (0.0%) | 0 (0.0%) |
| Total | 18 (1.9%) | 10 (3.8%) |
Race in Fruitland
The most populous races in Fruitland are White / Caucasian (3,656 | 65.2%), Black / African American (1,363 | 24.3%), and Hispanic or Latino (544 | 9.7%).
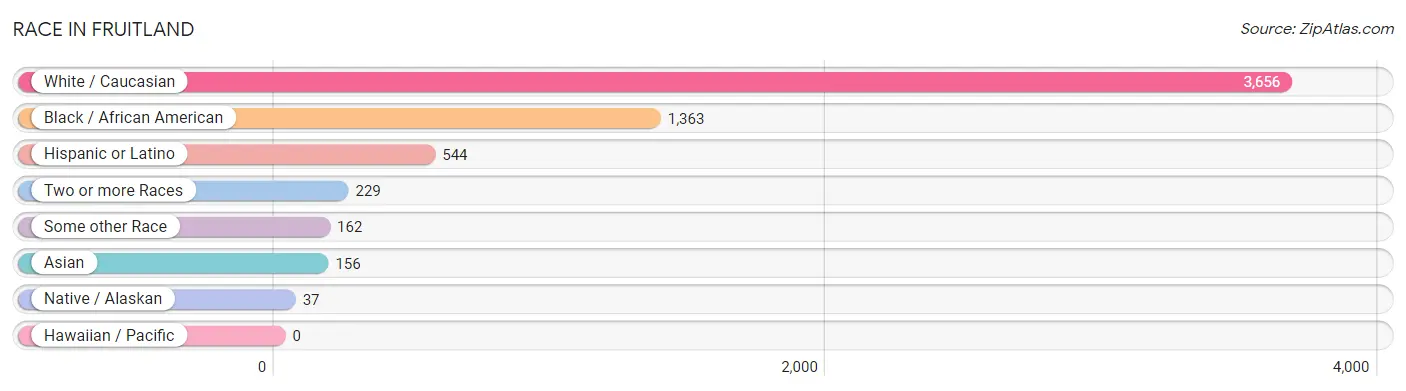
| Race | # Population | % Population |
| Asian | 156 | 2.8% |
| Black / African American | 1,363 | 24.3% |
| Hawaiian / Pacific | 0 | 0.0% |
| Hispanic or Latino | 544 | 9.7% |
| Native / Alaskan | 37 | 0.7% |
| White / Caucasian | 3,656 | 65.2% |
| Two or more Races | 229 | 4.1% |
| Some other Race | 162 | 2.9% |
| Total | 5,603 | 100.0% |
Ancestry in Fruitland
The most populous ancestries reported in Fruitland are German (676 | 12.1%), American (575 | 10.3%), Irish (532 | 9.5%), Italian (452 | 8.1%), and Turkish (229 | 4.1%), together accounting for 44.0% of all Fruitland residents.
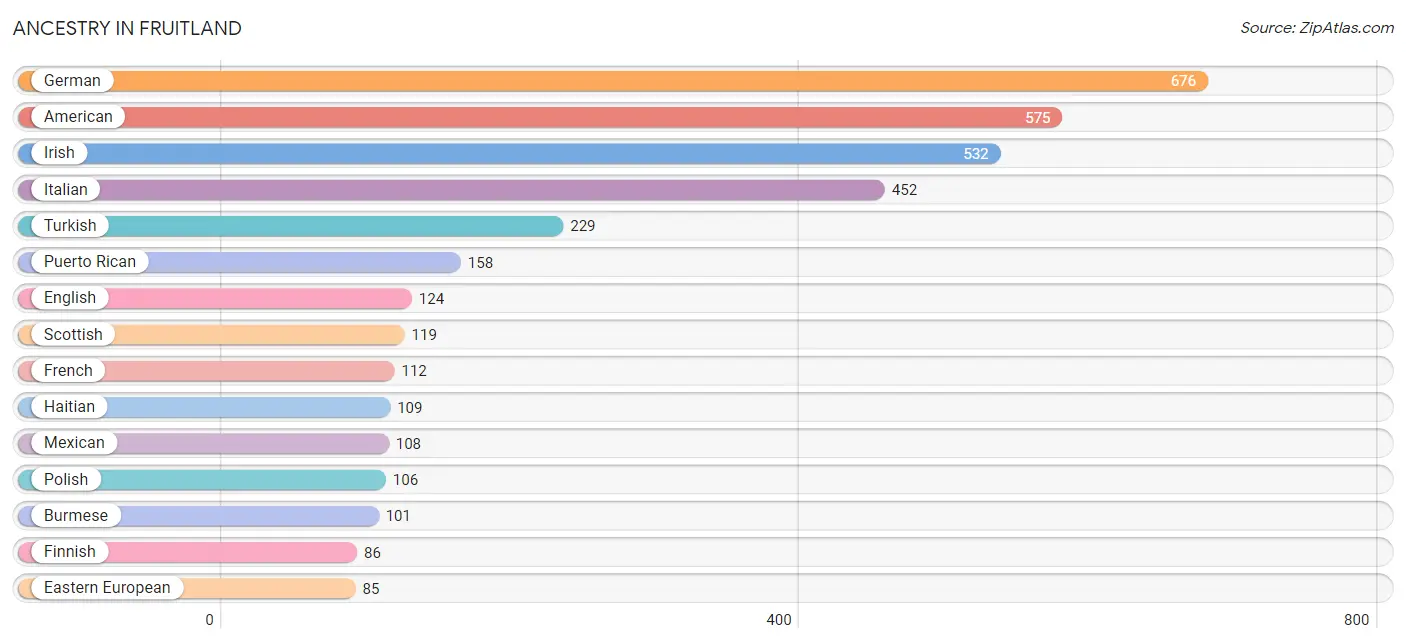
| Ancestry | # Population | % Population |
| American | 575 | 10.3% |
| Bhutanese | 64 | 1.1% |
| Burmese | 101 | 1.8% |
| Central American | 65 | 1.2% |
| Central American Indian | 62 | 1.1% |
| Cherokee | 3 | 0.1% |
| Colombian | 9 | 0.2% |
| Croatian | 16 | 0.3% |
| Cuban | 7 | 0.1% |
| Dutch | 32 | 0.6% |
| Eastern European | 85 | 1.5% |
| Ecuadorian | 12 | 0.2% |
| English | 124 | 2.2% |
| Ethiopian | 9 | 0.2% |
| European | 22 | 0.4% |
| Finnish | 86 | 1.5% |
| French | 112 | 2.0% |
| French Canadian | 11 | 0.2% |
| German | 676 | 12.1% |
| Greek | 11 | 0.2% |
| Haitian | 109 | 1.9% |
| Honduran | 29 | 0.5% |
| Indian (Asian) | 41 | 0.7% |
| Irish | 532 | 9.5% |
| Italian | 452 | 8.1% |
| Korean | 9 | 0.2% |
| Mexican | 108 | 1.9% |
| Norwegian | 12 | 0.2% |
| Polish | 106 | 1.9% |
| Puerto Rican | 158 | 2.8% |
| Salvadoran | 36 | 0.6% |
| Scotch-Irish | 25 | 0.4% |
| Scottish | 119 | 2.1% |
| Serbian | 16 | 0.3% |
| South American | 21 | 0.4% |
| Subsaharan African | 9 | 0.2% |
| Swedish | 20 | 0.4% |
| Swiss | 2 | 0.0% |
| Thai | 12 | 0.2% |
| Turkish | 229 | 4.1% |
| Welsh | 57 | 1.0% |
| West Indian | 37 | 0.7% |
| Yugoslavian | 16 | 0.3% | View All 43 Rows |
Immigrants in Fruitland
The most numerous immigrant groups reported in Fruitland came from Asia (189 | 3.4%), Latin America (178 | 3.2%), Turkey (118 | 2.1%), Western Asia (118 | 2.1%), and Caribbean (91 | 1.6%), together accounting for 12.4% of all Fruitland residents.
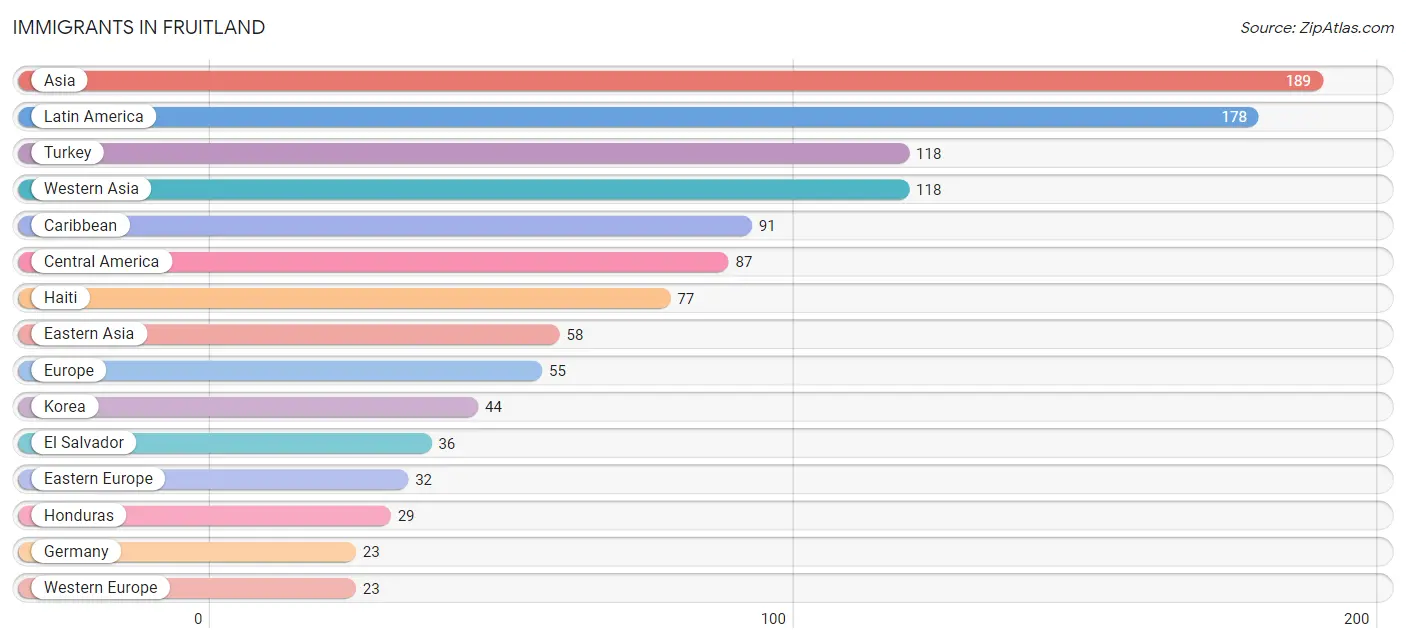
| Immigration Origin | # Population | % Population |
| Africa | 14 | 0.3% |
| Asia | 189 | 3.4% |
| Bahamas | 14 | 0.3% |
| Bosnia and Herzegovina | 16 | 0.3% |
| Caribbean | 91 | 1.6% |
| Central America | 87 | 1.5% |
| China | 14 | 0.3% |
| Eastern Asia | 58 | 1.0% |
| Eastern Europe | 32 | 0.6% |
| El Salvador | 36 | 0.6% |
| Europe | 55 | 1.0% |
| Germany | 23 | 0.4% |
| Guatemala | 22 | 0.4% |
| Haiti | 77 | 1.4% |
| Honduras | 29 | 0.5% |
| India | 4 | 0.1% |
| Korea | 44 | 0.8% |
| Latin America | 178 | 3.2% |
| Philippines | 9 | 0.2% |
| South Africa | 14 | 0.3% |
| South Central Asia | 4 | 0.1% |
| South Eastern Asia | 9 | 0.2% |
| Turkey | 118 | 2.1% |
| Western Asia | 118 | 2.1% |
| Western Europe | 23 | 0.4% | View All 25 Rows |
Sex and Age in Fruitland
Sex and Age in Fruitland
The most populous age groups in Fruitland are 20 to 24 Years (456 | 17.7%) for men and 20 to 24 Years (601 | 19.9%) for women.
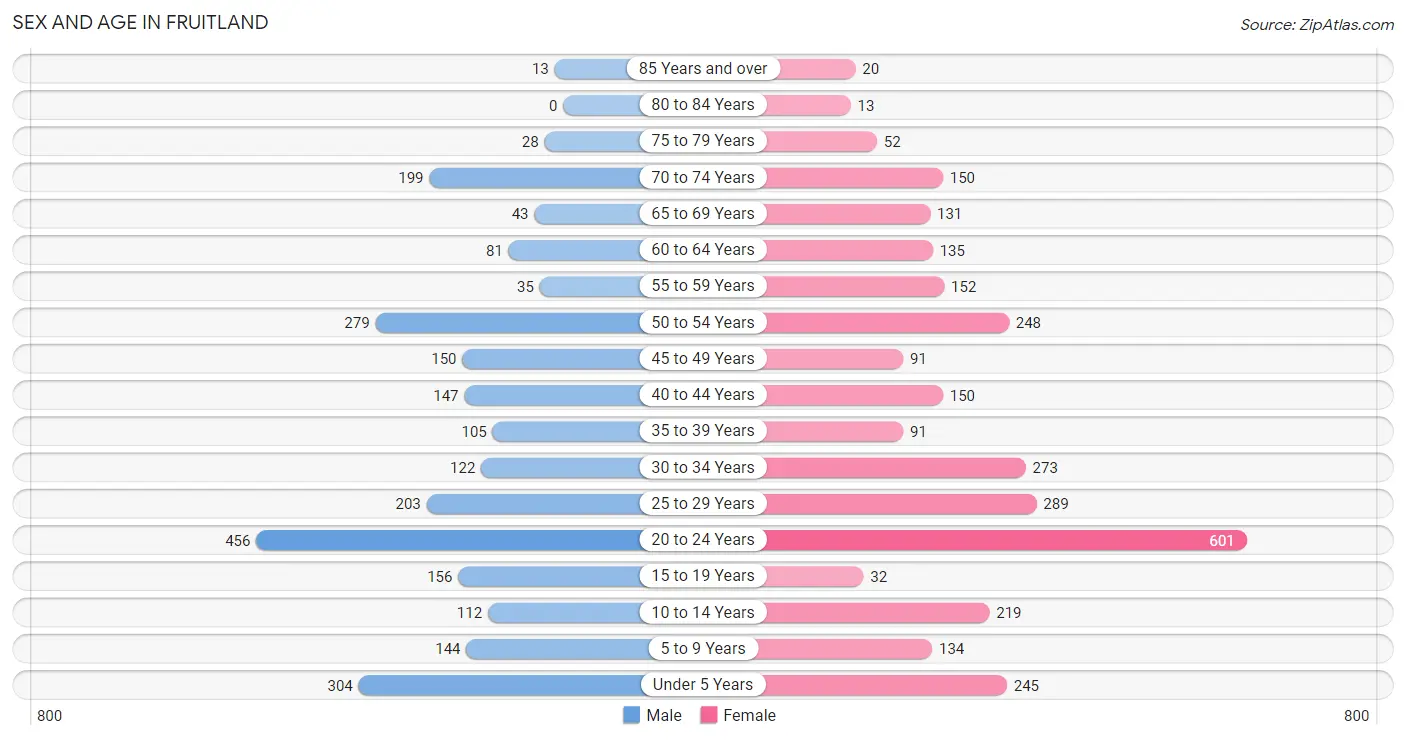
| Age Bracket | Male | Female |
| Under 5 Years | 304 (11.8%) | 245 (8.1%) |
| 5 to 9 Years | 144 (5.6%) | 134 (4.4%) |
| 10 to 14 Years | 112 (4.3%) | 219 (7.2%) |
| 15 to 19 Years | 156 (6.0%) | 32 (1.1%) |
| 20 to 24 Years | 456 (17.7%) | 601 (19.9%) |
| 25 to 29 Years | 203 (7.9%) | 289 (9.6%) |
| 30 to 34 Years | 122 (4.7%) | 273 (9.0%) |
| 35 to 39 Years | 105 (4.1%) | 91 (3.0%) |
| 40 to 44 Years | 147 (5.7%) | 150 (5.0%) |
| 45 to 49 Years | 150 (5.8%) | 91 (3.0%) |
| 50 to 54 Years | 279 (10.8%) | 248 (8.2%) |
| 55 to 59 Years | 35 (1.4%) | 152 (5.0%) |
| 60 to 64 Years | 81 (3.1%) | 135 (4.5%) |
| 65 to 69 Years | 43 (1.7%) | 131 (4.3%) |
| 70 to 74 Years | 199 (7.7%) | 150 (5.0%) |
| 75 to 79 Years | 28 (1.1%) | 52 (1.7%) |
| 80 to 84 Years | 0 (0.0%) | 13 (0.4%) |
| 85 Years and over | 13 (0.5%) | 20 (0.7%) |
| Total | 2,577 (100.0%) | 3,026 (100.0%) |
Families and Households in Fruitland
Median Family Size in Fruitland
The median family size in Fruitland is 3.44 persons per family, with single female/mother families (116 | 9.8%) accounting for the largest median family size of 4.3 persons per family. On the other hand, single male/father families (147 | 12.4%) represent the smallest median family size with 2.54 persons per family.
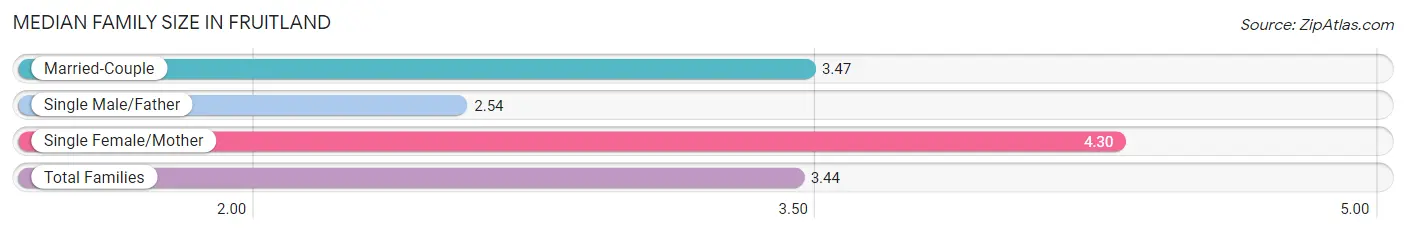
| Family Type | # Families | Family Size |
| Married-Couple | 923 (77.8%) | 3.47 |
| Single Male/Father | 147 (12.4%) | 2.54 |
| Single Female/Mother | 116 (9.8%) | 4.30 |
| Total Families | 1,186 (100.0%) | 3.44 |
Median Household Size in Fruitland
The median household size in Fruitland is 2.77 persons per household, with single female/mother households (116 | 5.8%) accounting for the largest median household size of 4.7 persons per household. non-family households (830 | 41.2%) represent the smallest median household size with 1.64 persons per household.
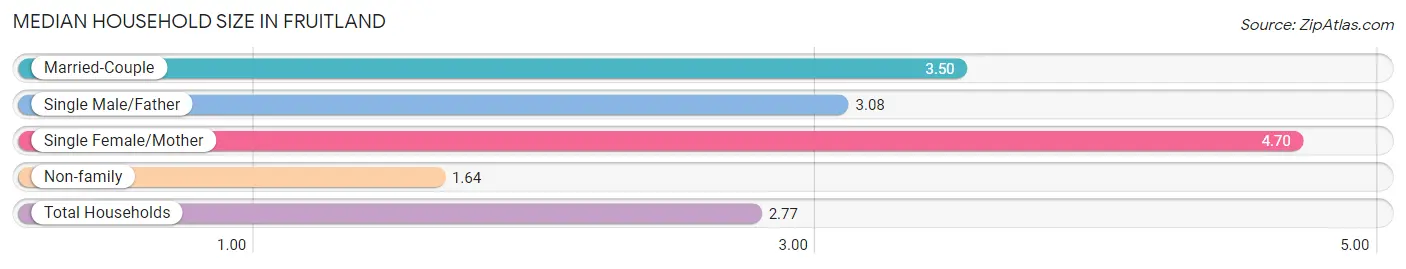
| Household Type | # Households | Household Size |
| Married-Couple | 923 (45.8%) | 3.50 |
| Single Male/Father | 147 (7.3%) | 3.08 |
| Single Female/Mother | 116 (5.8%) | 4.70 |
| Non-family | 830 (41.2%) | 1.64 |
| Total Households | 2,016 (100.0%) | 2.77 |
Household Size by Marriage Status in Fruitland
Out of a total of 2,016 households in Fruitland, 1,186 (58.8%) are family households, while 830 (41.2%) are nonfamily households. The most numerous type of family households are 3-person households, comprising 378, and the most common type of nonfamily households are 1-person households, comprising 469.
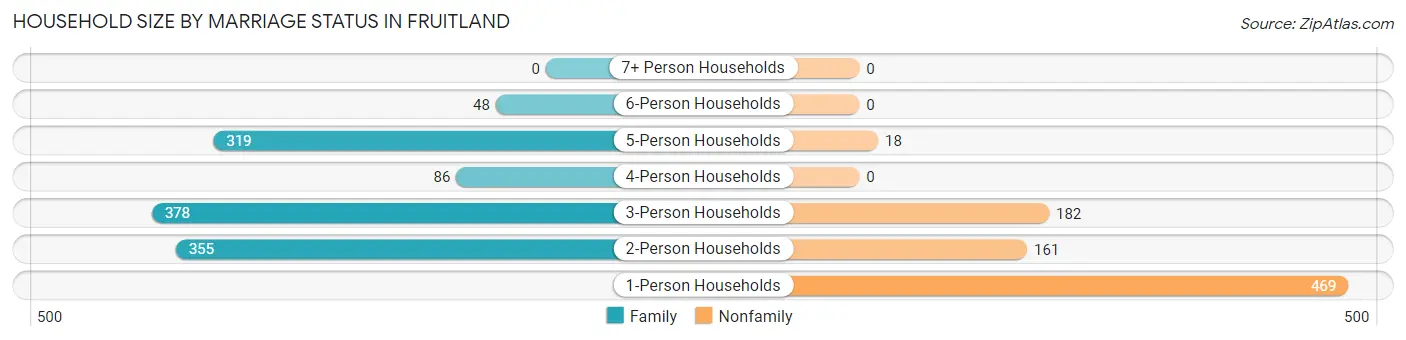
| Household Size | Family Households | Nonfamily Households |
| 1-Person Households | - | 469 (23.3%) |
| 2-Person Households | 355 (17.6%) | 161 (8.0%) |
| 3-Person Households | 378 (18.8%) | 182 (9.0%) |
| 4-Person Households | 86 (4.3%) | 0 (0.0%) |
| 5-Person Households | 319 (15.8%) | 18 (0.9%) |
| 6-Person Households | 48 (2.4%) | 0 (0.0%) |
| 7+ Person Households | 0 (0.0%) | 0 (0.0%) |
| Total | 1,186 (58.8%) | 830 (41.2%) |
Female Fertility in Fruitland
Fertility by Age in Fruitland
Average fertility rate in Fruitland is 78.0 births per 1,000 women. Women in the age bracket of 20 to 34 years have the highest fertility rate with 106.0 births per 1,000 women. Women in the age bracket of 20 to 34 years acount for 100.0% of all women with births.
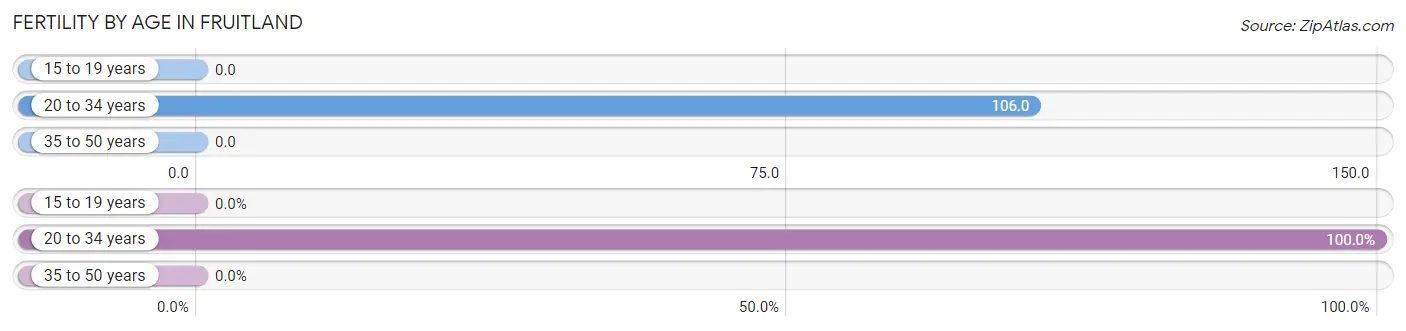
| Age Bracket | Women with Births | Births / 1,000 Women |
| 15 to 19 years | 0 (0.0%) | 0.0 |
| 20 to 34 years | 123 (100.0%) | 106.0 |
| 35 to 50 years | 0 (0.0%) | 0.0 |
| Total | 123 (100.0%) | 78.0 |
Fertility by Age by Marriage Status in Fruitland
90.2% of women with births (123) in Fruitland are married. The highest percentage of unmarried women with births falls into 20 to 34 years age bracket with 9.8% of them unmarried at the time of birth, while the lowest percentage of unmarried women with births belong to 20 to 34 years age bracket with 9.8% of them unmarried.
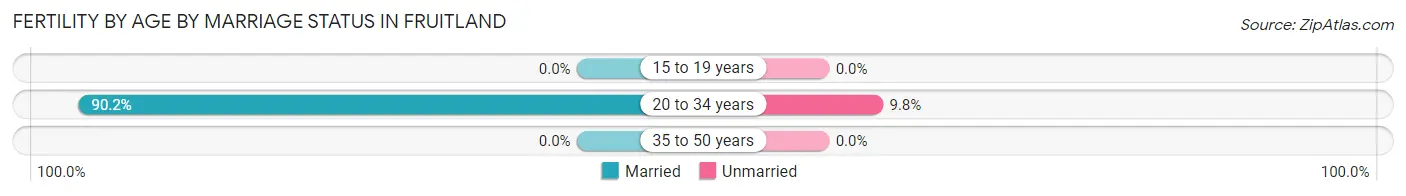
| Age Bracket | Married | Unmarried |
| 15 to 19 years | 0 (0.0%) | 0 (0.0%) |
| 20 to 34 years | 111 (90.2%) | 12 (9.8%) |
| 35 to 50 years | 0 (0.0%) | 0 (0.0%) |
| Total | 111 (90.2%) | 12 (9.8%) |
Fertility by Education in Fruitland
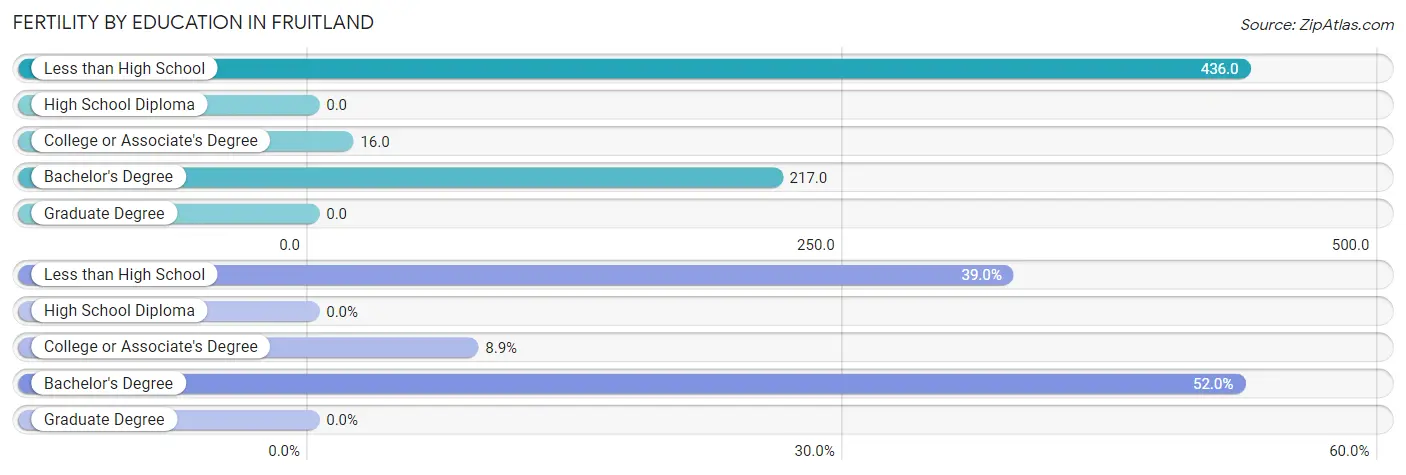
| Educational Attainment | Women with Births | Births / 1,000 Women |
| Less than High School | 48 (39.0%) | 436.0 |
| High School Diploma | 0 (0.0%) | 0.0 |
| College or Associate's Degree | 11 (8.9%) | 16.0 |
| Bachelor's Degree | 64 (52.0%) | 217.0 |
| Graduate Degree | 0 (0.0%) | 0.0 |
| Total | 123 (100.0%) | 78.0 |
Fertility by Education by Marriage Status in Fruitland
9.8% of women with births in Fruitland are unmarried. Women with the educational attainment of college or associate's degree are most likely to be married with 100.0% of them married at childbirth, while women with the educational attainment of less than high school are least likely to be married with 25.0% of them unmarried at childbirth.
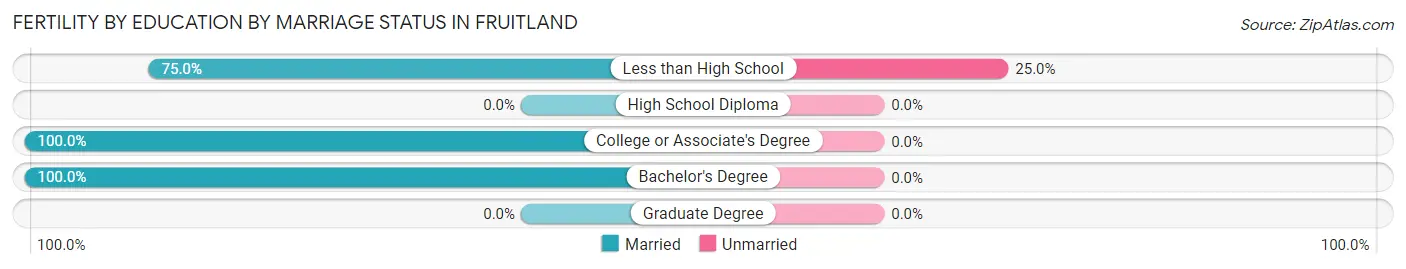
| Educational Attainment | Married | Unmarried |
| Less than High School | 36 (75.0%) | 12 (25.0%) |
| High School Diploma | 0 (0.0%) | 0 (0.0%) |
| College or Associate's Degree | 11 (100.0%) | 0 (0.0%) |
| Bachelor's Degree | 64 (100.0%) | 0 (0.0%) |
| Graduate Degree | 0 (0.0%) | 0 (0.0%) |
| Total | 111 (90.2%) | 12 (9.8%) |
Employment Characteristics in Fruitland
Employment by Class of Employer in Fruitland
Among the 2,430 employed individuals in Fruitland, private company employees (1,479 | 60.9%), not-for-profit organizations (393 | 16.2%), and local government employees (175 | 7.2%) make up the most common classes of employment.
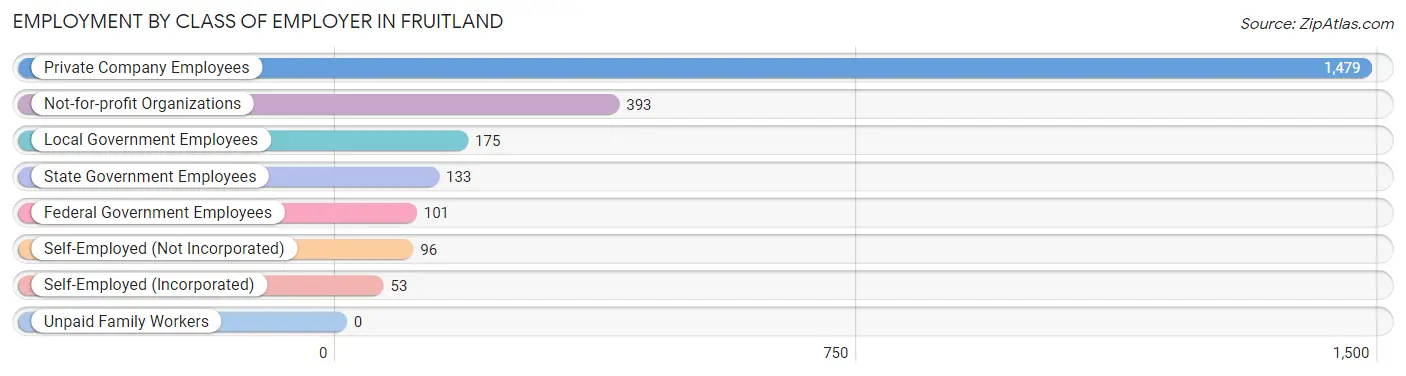
| Employer Class | # Employees | % Employees |
| Private Company Employees | 1,479 | 60.9% |
| Self-Employed (Incorporated) | 53 | 2.2% |
| Self-Employed (Not Incorporated) | 96 | 4.0% |
| Not-for-profit Organizations | 393 | 16.2% |
| Local Government Employees | 175 | 7.2% |
| State Government Employees | 133 | 5.5% |
| Federal Government Employees | 101 | 4.2% |
| Unpaid Family Workers | 0 | 0.0% |
| Total | 2,430 | 100.0% |
Employment Status by Age in Fruitland
According to the labor force statistics for Fruitland, out of the total population over 16 years of age (4,445), 62.2% or 2,765 individuals are in the labor force, with 11.1% or 307 of them unemployed. The age group with the highest labor force participation rate is 25 to 29 years, with 92.7% or 456 individuals in the labor force. Within the labor force, the 16 to 19 years age range has the highest percentage of unemployed individuals, with 60.4% or 61 of them being unemployed.
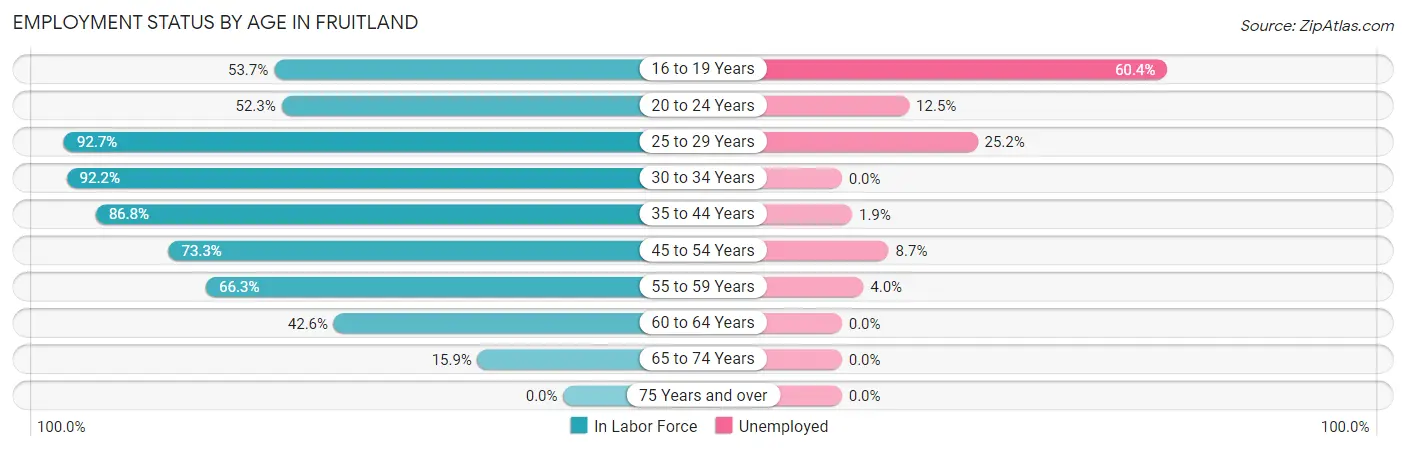
| Age Bracket | In Labor Force | Unemployed |
| 16 to 19 Years | 101 (53.7%) | 61 (60.4%) |
| 20 to 24 Years | 553 (52.3%) | 69 (12.5%) |
| 25 to 29 Years | 456 (92.7%) | 115 (25.2%) |
| 30 to 34 Years | 364 (92.2%) | 0 (0.0%) |
| 35 to 44 Years | 428 (86.8%) | 8 (1.9%) |
| 45 to 54 Years | 563 (73.3%) | 49 (8.7%) |
| 55 to 59 Years | 124 (66.3%) | 5 (4.0%) |
| 60 to 64 Years | 92 (42.6%) | 0 (0.0%) |
| 65 to 74 Years | 83 (15.9%) | 0 (0.0%) |
| 75 Years and over | 0 (0.0%) | 0 (0.0%) |
| Total | 2,765 (62.2%) | 307 (11.1%) |
Employment Status by Educational Attainment in Fruitland
According to labor force statistics for Fruitland, 79.5% of individuals (2,028) out of the total population between 25 and 64 years of age (2,551) are in the labor force, with 8.7% or 176 of them being unemployed. The group with the highest labor force participation rate are those with the educational attainment of college / associate degree, with 93.3% or 401 individuals in the labor force. Within the labor force, individuals with college / associate degree education have the highest percentage of unemployment, with 18.2% or 73 of them being unemployed.
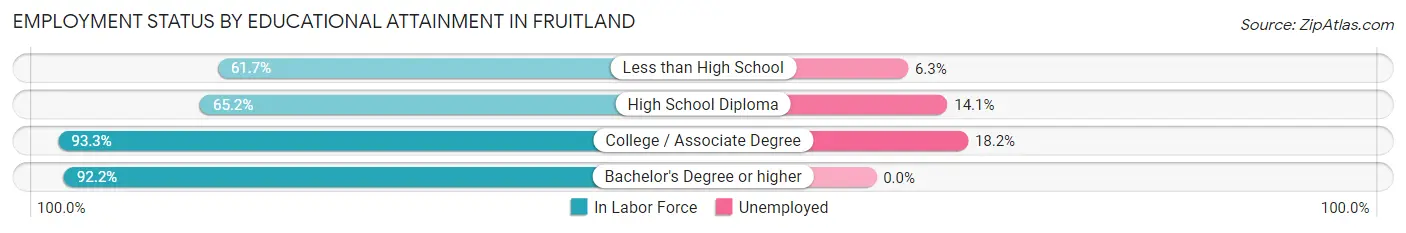
| Educational Attainment | In Labor Force | Unemployed |
| Less than High School | 79 (61.7%) | 8 (6.3%) |
| High School Diploma | 703 (65.2%) | 152 (14.1%) |
| College / Associate Degree | 401 (93.3%) | 78 (18.2%) |
| Bachelor's Degree or higher | 844 (92.2%) | 0 (0.0%) |
| Total | 2,028 (79.5%) | 222 (8.7%) |
Employment Occupations by Sex in Fruitland
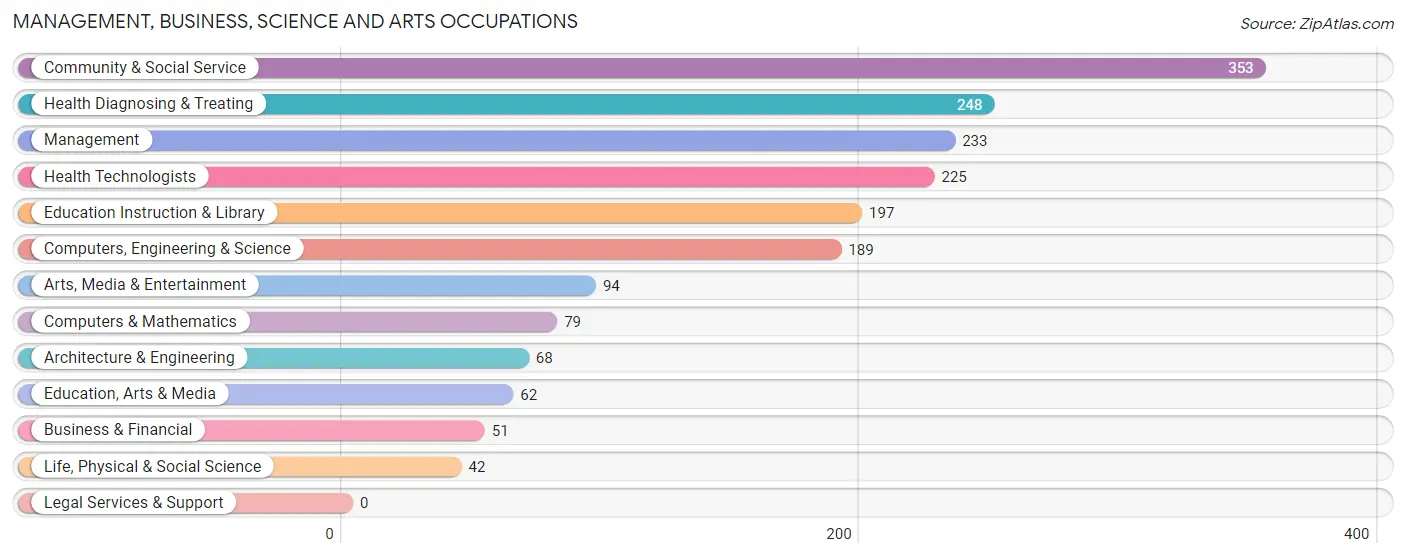
Management, Business, Science and Arts Occupations
The most common Management, Business, Science and Arts occupations in Fruitland are Community & Social Service (353 | 14.4%), Health Diagnosing & Treating (248 | 10.1%), Management (233 | 9.5%), Health Technologists (225 | 9.2%), and Education Instruction & Library (197 | 8.0%).
Management, Business, Science and Arts Occupations by Sex
Within the Management, Business, Science and Arts occupations in Fruitland, the most male-oriented occupations are Architecture & Engineering (100.0%), Computers, Engineering & Science (66.1%), and Management (62.2%), while the most female-oriented occupations are Health Technologists (89.3%), Health Diagnosing & Treating (81.0%), and Education Instruction & Library (80.7%).
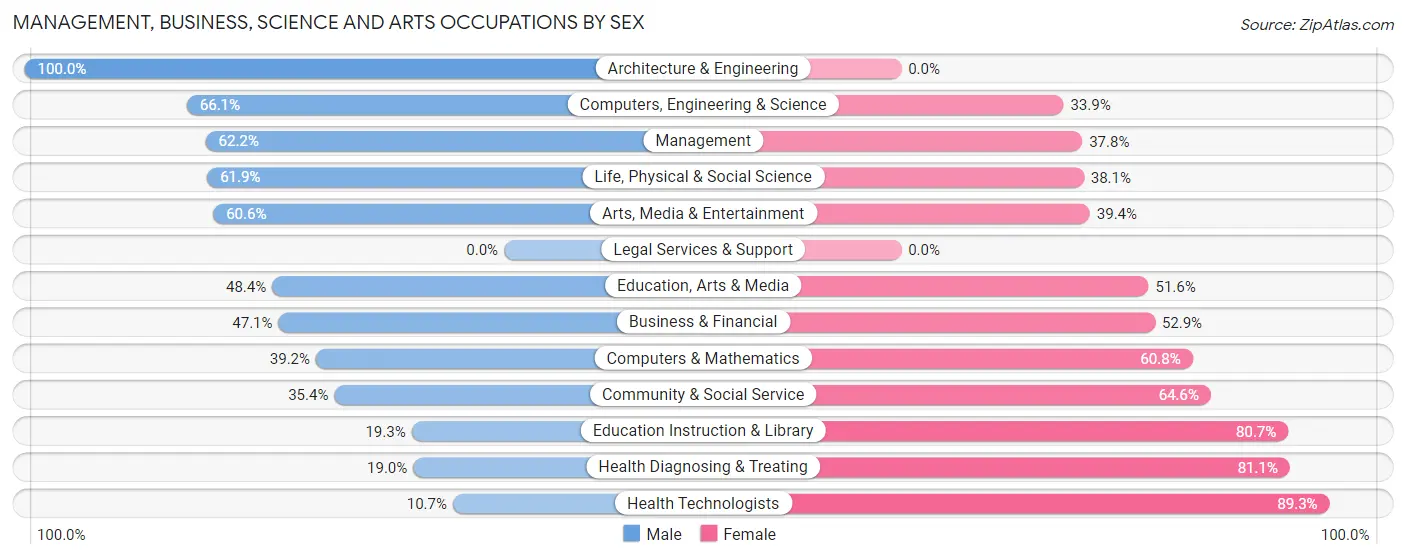
| Occupation | Male | Female |
| Management | 145 (62.2%) | 88 (37.8%) |
| Business & Financial | 24 (47.1%) | 27 (52.9%) |
| Computers, Engineering & Science | 125 (66.1%) | 64 (33.9%) |
| Computers & Mathematics | 31 (39.2%) | 48 (60.8%) |
| Architecture & Engineering | 68 (100.0%) | 0 (0.0%) |
| Life, Physical & Social Science | 26 (61.9%) | 16 (38.1%) |
| Community & Social Service | 125 (35.4%) | 228 (64.6%) |
| Education, Arts & Media | 30 (48.4%) | 32 (51.6%) |
| Legal Services & Support | 0 (0.0%) | 0 (0.0%) |
| Education Instruction & Library | 38 (19.3%) | 159 (80.7%) |
| Arts, Media & Entertainment | 57 (60.6%) | 37 (39.4%) |
| Health Diagnosing & Treating | 47 (19.0%) | 201 (81.0%) |
| Health Technologists | 24 (10.7%) | 201 (89.3%) |
| Total (Category) | 466 (43.4%) | 608 (56.6%) |
| Total (Overall) | 1,149 (46.8%) | 1,308 (53.2%) |
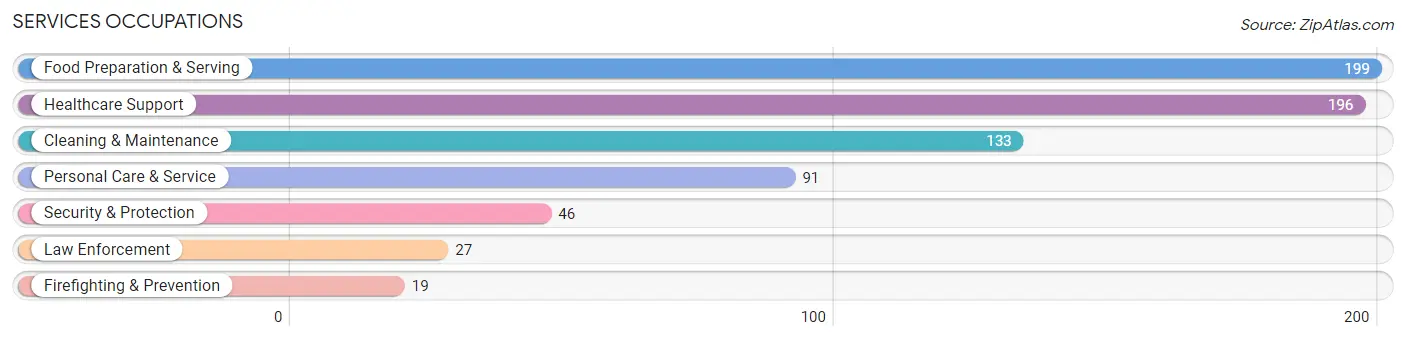
Services Occupations
The most common Services occupations in Fruitland are Food Preparation & Serving (199 | 8.1%), Healthcare Support (196 | 8.0%), Cleaning & Maintenance (133 | 5.4%), Personal Care & Service (91 | 3.7%), and Security & Protection (46 | 1.9%).
Services Occupations by Sex
Within the Services occupations in Fruitland, the most male-oriented occupations are Security & Protection (100.0%), Firefighting & Prevention (100.0%), and Law Enforcement (100.0%), while the most female-oriented occupations are Personal Care & Service (100.0%), Healthcare Support (88.8%), and Food Preparation & Serving (25.6%).
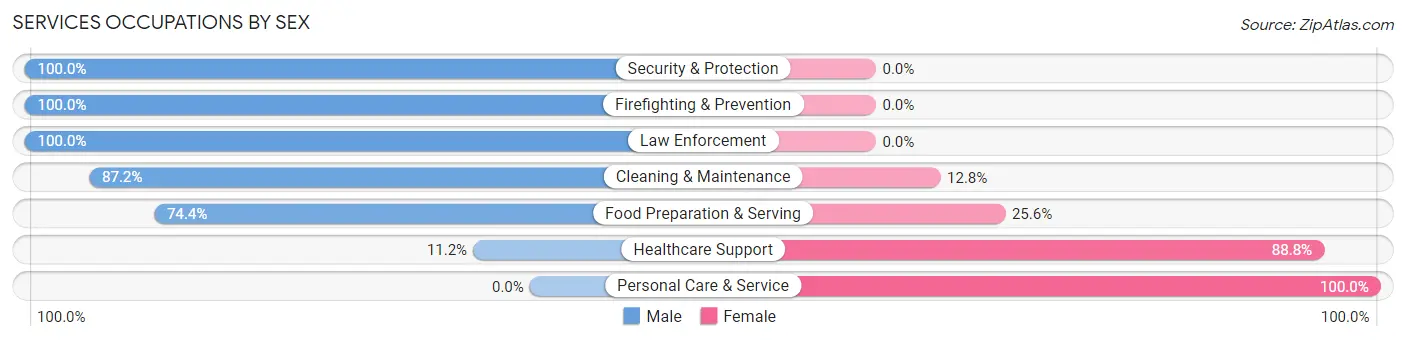
| Occupation | Male | Female |
| Healthcare Support | 22 (11.2%) | 174 (88.8%) |
| Security & Protection | 46 (100.0%) | 0 (0.0%) |
| Firefighting & Prevention | 19 (100.0%) | 0 (0.0%) |
| Law Enforcement | 27 (100.0%) | 0 (0.0%) |
| Food Preparation & Serving | 148 (74.4%) | 51 (25.6%) |
| Cleaning & Maintenance | 116 (87.2%) | 17 (12.8%) |
| Personal Care & Service | 0 (0.0%) | 91 (100.0%) |
| Total (Category) | 332 (49.9%) | 333 (50.1%) |
| Total (Overall) | 1,149 (46.8%) | 1,308 (53.2%) |
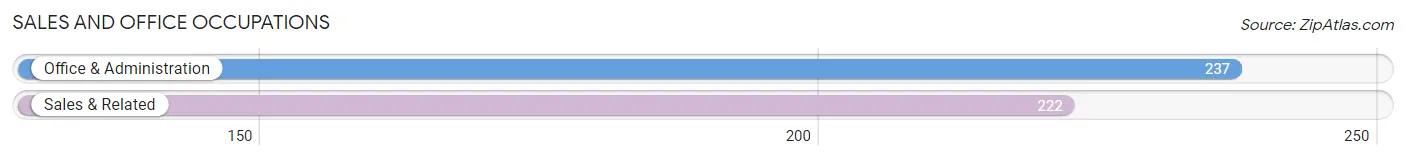
Sales and Office Occupations
The most common Sales and Office occupations in Fruitland are Office & Administration (237 | 9.7%), and Sales & Related (222 | 9.0%).
Sales and Office Occupations by Sex
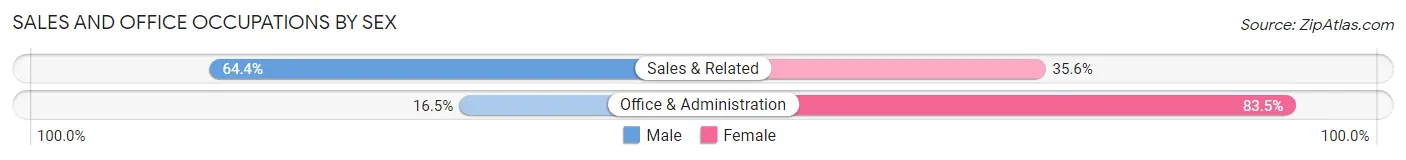
| Occupation | Male | Female |
| Sales & Related | 143 (64.4%) | 79 (35.6%) |
| Office & Administration | 39 (16.5%) | 198 (83.5%) |
| Total (Category) | 182 (39.7%) | 277 (60.4%) |
| Total (Overall) | 1,149 (46.8%) | 1,308 (53.2%) |
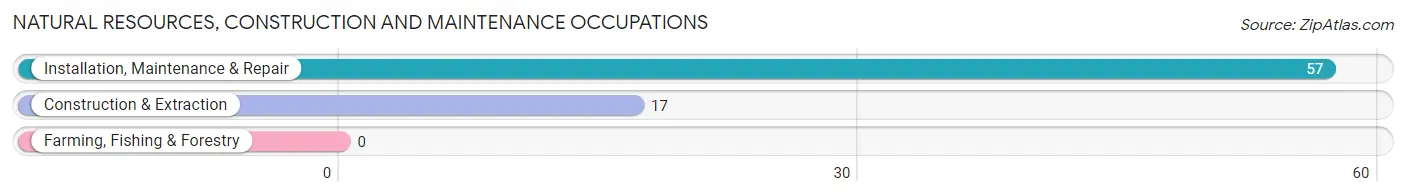
Natural Resources, Construction and Maintenance Occupations
The most common Natural Resources, Construction and Maintenance occupations in Fruitland are Installation, Maintenance & Repair (57 | 2.3%), and Construction & Extraction (17 | 0.7%).
Natural Resources, Construction and Maintenance Occupations by Sex
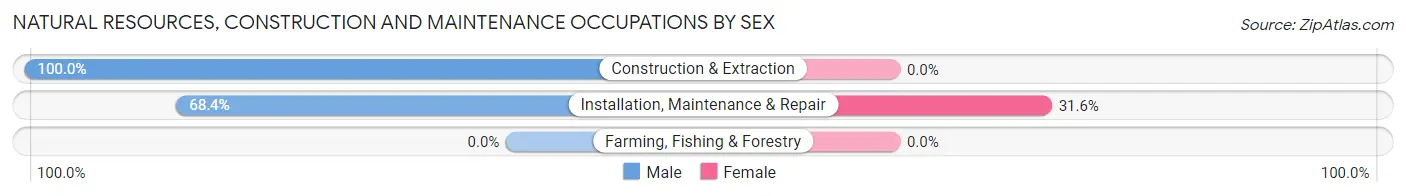
| Occupation | Male | Female |
| Farming, Fishing & Forestry | 0 (0.0%) | 0 (0.0%) |
| Construction & Extraction | 17 (100.0%) | 0 (0.0%) |
| Installation, Maintenance & Repair | 39 (68.4%) | 18 (31.6%) |
| Total (Category) | 56 (75.7%) | 18 (24.3%) |
| Total (Overall) | 1,149 (46.8%) | 1,308 (53.2%) |
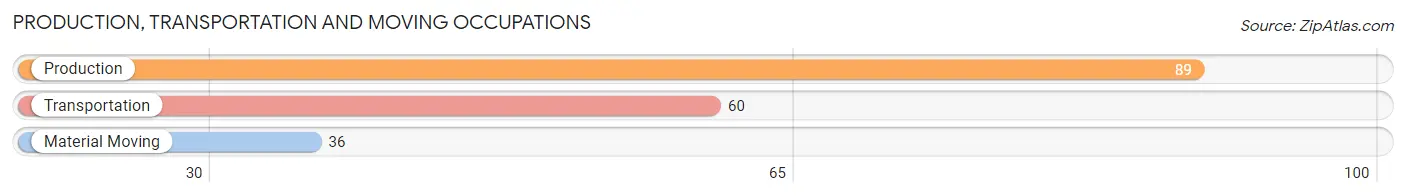
Production, Transportation and Moving Occupations
The most common Production, Transportation and Moving occupations in Fruitland are Production (89 | 3.6%), Transportation (60 | 2.4%), and Material Moving (36 | 1.5%).
Production, Transportation and Moving Occupations by Sex
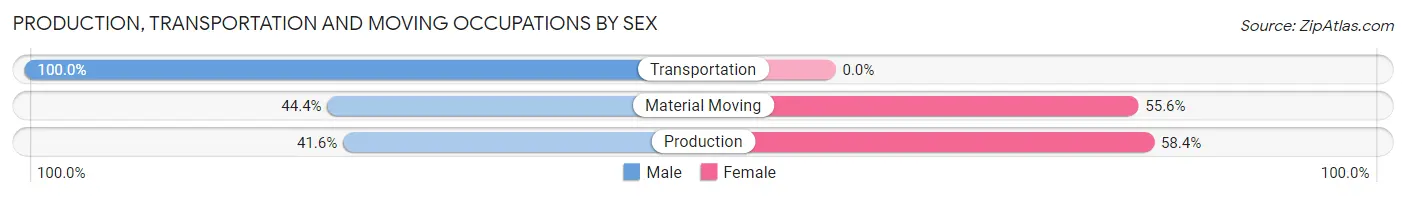
| Occupation | Male | Female |
| Production | 37 (41.6%) | 52 (58.4%) |
| Transportation | 60 (100.0%) | 0 (0.0%) |
| Material Moving | 16 (44.4%) | 20 (55.6%) |
| Total (Category) | 113 (61.1%) | 72 (38.9%) |
| Total (Overall) | 1,149 (46.8%) | 1,308 (53.2%) |
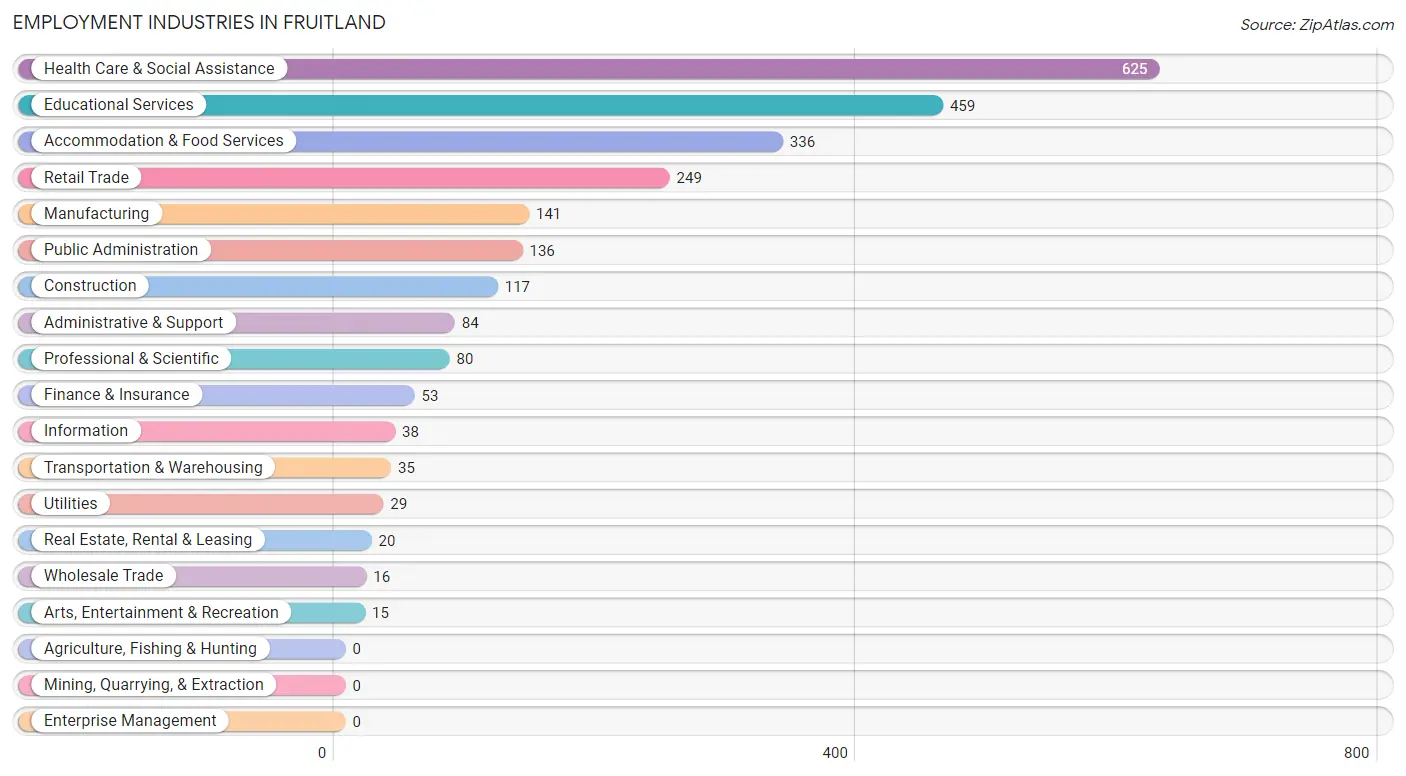
Employment Industries by Sex in Fruitland
Employment Industries in Fruitland
The major employment industries in Fruitland include Health Care & Social Assistance (625 | 25.4%), Educational Services (459 | 18.7%), Accommodation & Food Services (336 | 13.7%), Retail Trade (249 | 10.1%), and Manufacturing (141 | 5.7%).
Employment Industries by Sex in Fruitland
The Fruitland industries that see more men than women are Wholesale Trade (100.0%), Transportation & Warehousing (100.0%), and Utilities (100.0%), whereas the industries that tend to have a higher number of women are Real Estate, Rental & Leasing (100.0%), Arts, Entertainment & Recreation (100.0%), and Health Care & Social Assistance (81.4%).
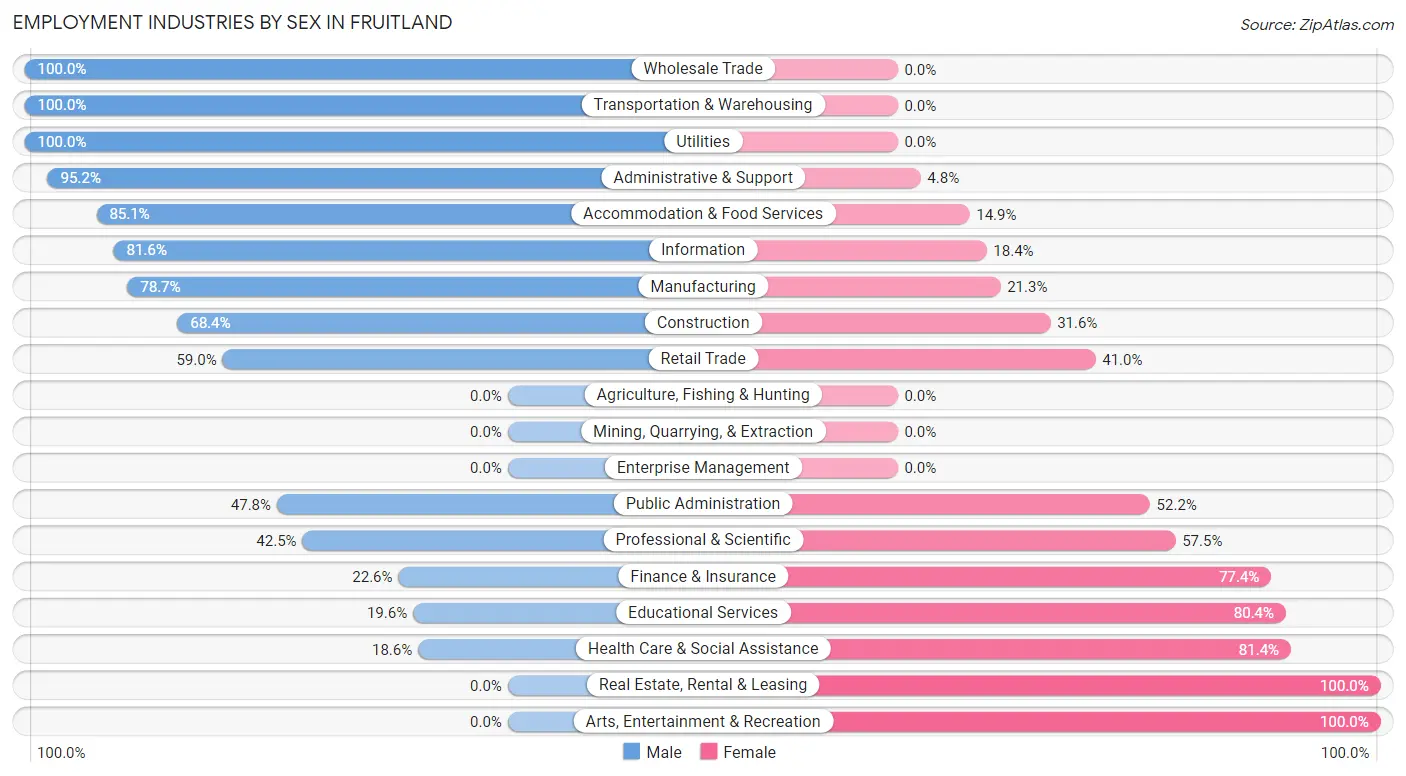
| Industry | Male | Female |
| Agriculture, Fishing & Hunting | 0 (0.0%) | 0 (0.0%) |
| Mining, Quarrying, & Extraction | 0 (0.0%) | 0 (0.0%) |
| Construction | 80 (68.4%) | 37 (31.6%) |
| Manufacturing | 111 (78.7%) | 30 (21.3%) |
| Wholesale Trade | 16 (100.0%) | 0 (0.0%) |
| Retail Trade | 147 (59.0%) | 102 (41.0%) |
| Transportation & Warehousing | 35 (100.0%) | 0 (0.0%) |
| Utilities | 29 (100.0%) | 0 (0.0%) |
| Information | 31 (81.6%) | 7 (18.4%) |
| Finance & Insurance | 12 (22.6%) | 41 (77.4%) |
| Real Estate, Rental & Leasing | 0 (0.0%) | 20 (100.0%) |
| Professional & Scientific | 34 (42.5%) | 46 (57.5%) |
| Enterprise Management | 0 (0.0%) | 0 (0.0%) |
| Administrative & Support | 80 (95.2%) | 4 (4.8%) |
| Educational Services | 90 (19.6%) | 369 (80.4%) |
| Health Care & Social Assistance | 116 (18.6%) | 509 (81.4%) |
| Arts, Entertainment & Recreation | 0 (0.0%) | 15 (100.0%) |
| Accommodation & Food Services | 286 (85.1%) | 50 (14.9%) |
| Public Administration | 65 (47.8%) | 71 (52.2%) |
| Total | 1,149 (46.8%) | 1,308 (53.2%) |
Education in Fruitland
School Enrollment in Fruitland
The most common levels of schooling among the 1,581 students in Fruitland are college / undergraduate (723 | 45.7%), middle school (287 | 18.1%), and elementary school (215 | 13.6%).
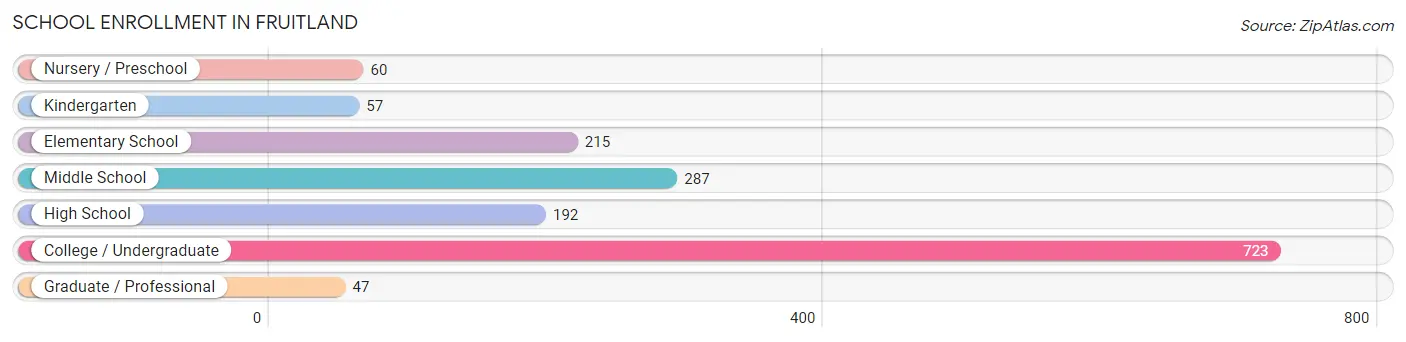
| School Level | # Students | % Students |
| Nursery / Preschool | 60 | 3.8% |
| Kindergarten | 57 | 3.6% |
| Elementary School | 215 | 13.6% |
| Middle School | 287 | 18.1% |
| High School | 192 | 12.1% |
| College / Undergraduate | 723 | 45.7% |
| Graduate / Professional | 47 | 3.0% |
| Total | 1,581 | 100.0% |
School Enrollment by Age by Funding Source in Fruitland
Out of a total of 1,581 students who are enrolled in schools in Fruitland, 51 (3.2%) attend a private institution, while the remaining 1,530 (96.8%) are enrolled in public schools. The age group of 5 to 9 year old has the highest likelihood of being enrolled in private schools, with 51 (18.8% in the age bracket) enrolled. Conversely, the age group of 3 to 4 year olds has the lowest likelihood of being enrolled in a private school, with 60 (100.0% in the age bracket) attending a public institution.
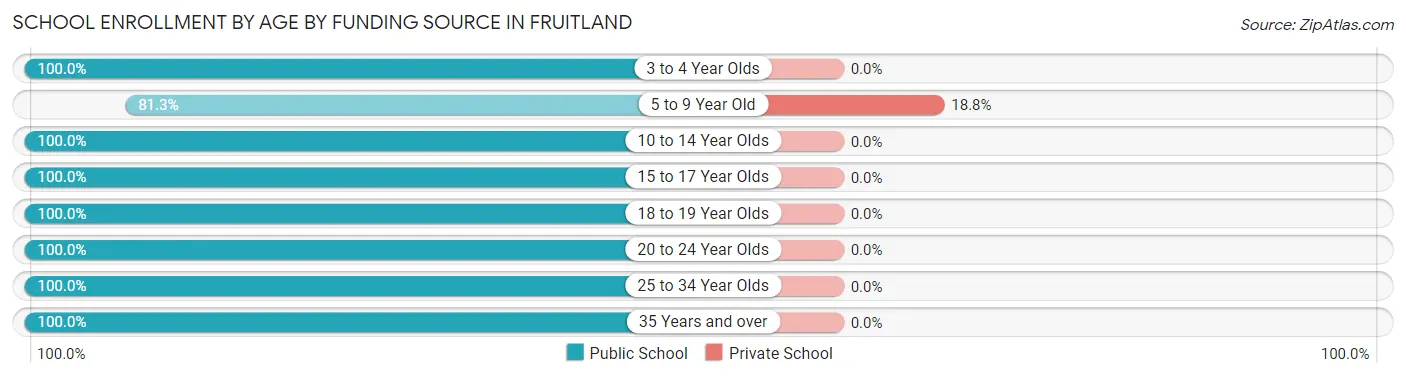
| Age Bracket | Public School | Private School |
| 3 to 4 Year Olds | 60 (100.0%) | 0 (0.0%) |
| 5 to 9 Year Old | 221 (81.2%) | 51 (18.8%) |
| 10 to 14 Year Olds | 331 (100.0%) | 0 (0.0%) |
| 15 to 17 Year Olds | 100 (100.0%) | 0 (0.0%) |
| 18 to 19 Year Olds | 67 (100.0%) | 0 (0.0%) |
| 20 to 24 Year Olds | 655 (100.0%) | 0 (0.0%) |
| 25 to 34 Year Olds | 56 (100.0%) | 0 (0.0%) |
| 35 Years and over | 40 (100.0%) | 0 (0.0%) |
| Total | 1,530 (96.8%) | 51 (3.2%) |
Educational Attainment by Field of Study in Fruitland
Education (259 | 20.1%), science & technology (223 | 17.3%), business (135 | 10.5%), bio, nature & agricultural (123 | 9.6%), and social sciences (105 | 8.2%) are the most common fields of study among 1,286 individuals in Fruitland who have obtained a bachelor's degree or higher.
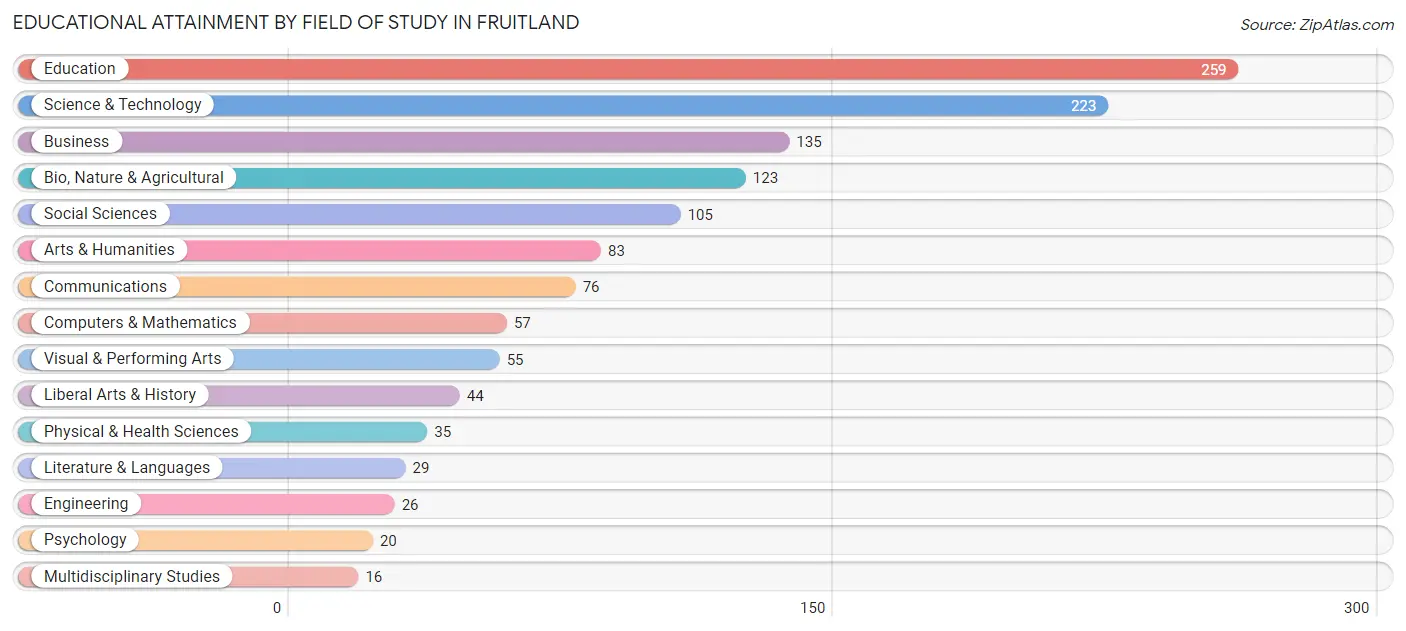
| Field of Study | # Graduates | % Graduates |
| Computers & Mathematics | 57 | 4.4% |
| Bio, Nature & Agricultural | 123 | 9.6% |
| Physical & Health Sciences | 35 | 2.7% |
| Psychology | 20 | 1.6% |
| Social Sciences | 105 | 8.2% |
| Engineering | 26 | 2.0% |
| Multidisciplinary Studies | 16 | 1.2% |
| Science & Technology | 223 | 17.3% |
| Business | 135 | 10.5% |
| Education | 259 | 20.1% |
| Literature & Languages | 29 | 2.3% |
| Liberal Arts & History | 44 | 3.4% |
| Visual & Performing Arts | 55 | 4.3% |
| Communications | 76 | 5.9% |
| Arts & Humanities | 83 | 6.5% |
| Total | 1,286 | 100.0% |
Transportation & Commute in Fruitland
Vehicle Availability by Sex in Fruitland
The most prevalent vehicle ownership categories in Fruitland are males with 2 vehicles (388, accounting for 34.6%) and females with 2 vehicles (363, making up 29.7%).
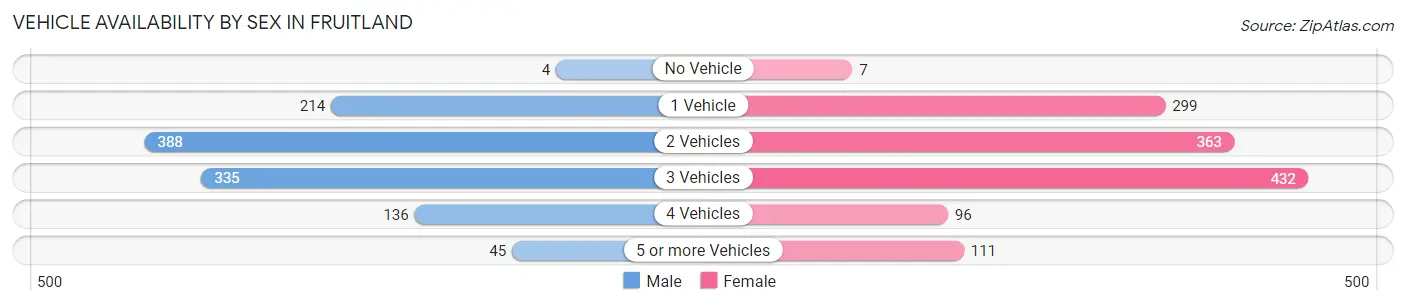
| Vehicles Available | Male | Female |
| No Vehicle | 4 (0.4%) | 7 (0.5%) |
| 1 Vehicle | 214 (19.1%) | 299 (22.9%) |
| 2 Vehicles | 388 (34.6%) | 363 (27.8%) |
| 3 Vehicles | 335 (29.9%) | 432 (33.0%) |
| 4 Vehicles | 136 (12.1%) | 96 (7.3%) |
| 5 or more Vehicles | 45 (4.0%) | 111 (8.5%) |
| Total | 1,122 (100.0%) | 1,308 (100.0%) |
Commute Time in Fruitland
The most frequently occuring commute durations in Fruitland are 15 to 19 minutes (686 commuters, 29.6%), 10 to 14 minutes (577 commuters, 24.9%), and 5 to 9 minutes (473 commuters, 20.4%).
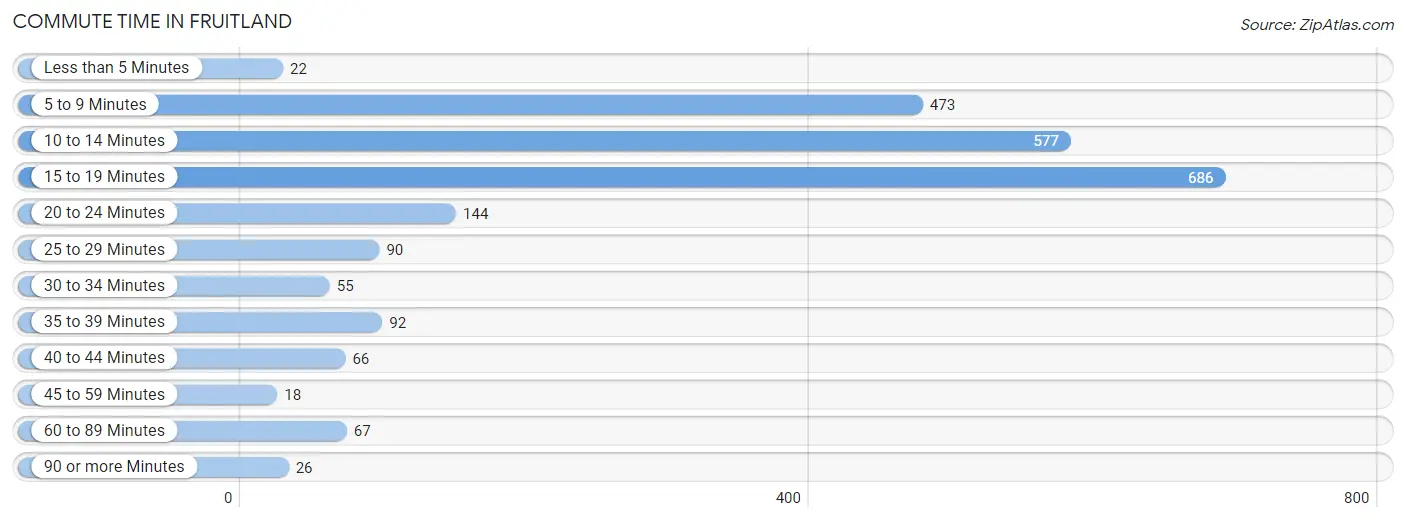
| Commute Time | # Commuters | % Commuters |
| Less than 5 Minutes | 22 | 0.9% |
| 5 to 9 Minutes | 473 | 20.4% |
| 10 to 14 Minutes | 577 | 24.9% |
| 15 to 19 Minutes | 686 | 29.6% |
| 20 to 24 Minutes | 144 | 6.2% |
| 25 to 29 Minutes | 90 | 3.9% |
| 30 to 34 Minutes | 55 | 2.4% |
| 35 to 39 Minutes | 92 | 4.0% |
| 40 to 44 Minutes | 66 | 2.9% |
| 45 to 59 Minutes | 18 | 0.8% |
| 60 to 89 Minutes | 67 | 2.9% |
| 90 or more Minutes | 26 | 1.1% |
Commute Time by Sex in Fruitland
The most common commute times in Fruitland are 15 to 19 minutes (410 commuters, 37.4%) for males and 10 to 14 minutes (331 commuters, 27.1%) for females.
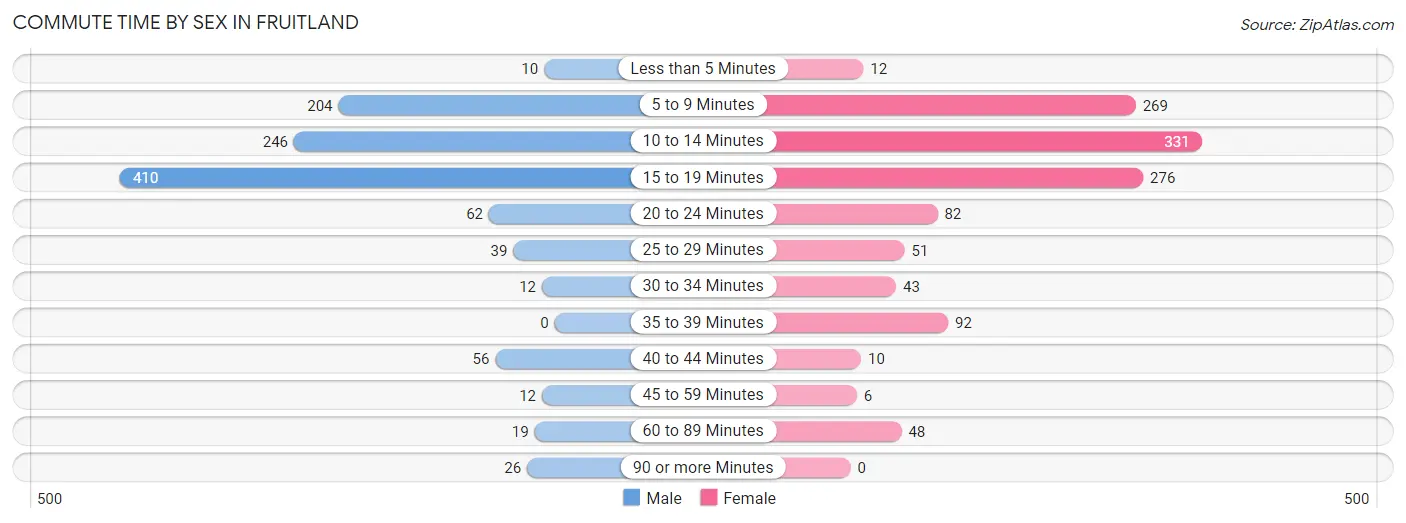
| Commute Time | Male | Female |
| Less than 5 Minutes | 10 (0.9%) | 12 (1.0%) |
| 5 to 9 Minutes | 204 (18.6%) | 269 (22.1%) |
| 10 to 14 Minutes | 246 (22.5%) | 331 (27.1%) |
| 15 to 19 Minutes | 410 (37.4%) | 276 (22.6%) |
| 20 to 24 Minutes | 62 (5.7%) | 82 (6.7%) |
| 25 to 29 Minutes | 39 (3.6%) | 51 (4.2%) |
| 30 to 34 Minutes | 12 (1.1%) | 43 (3.5%) |
| 35 to 39 Minutes | 0 (0.0%) | 92 (7.5%) |
| 40 to 44 Minutes | 56 (5.1%) | 10 (0.8%) |
| 45 to 59 Minutes | 12 (1.1%) | 6 (0.5%) |
| 60 to 89 Minutes | 19 (1.7%) | 48 (3.9%) |
| 90 or more Minutes | 26 (2.4%) | 0 (0.0%) |
Time of Departure to Work by Sex in Fruitland
The most frequent times of departure to work in Fruitland are 12:00 PM to 3:59 PM (201, 18.3%) for males and 7:00 AM to 7:29 AM (299, 24.5%) for females.
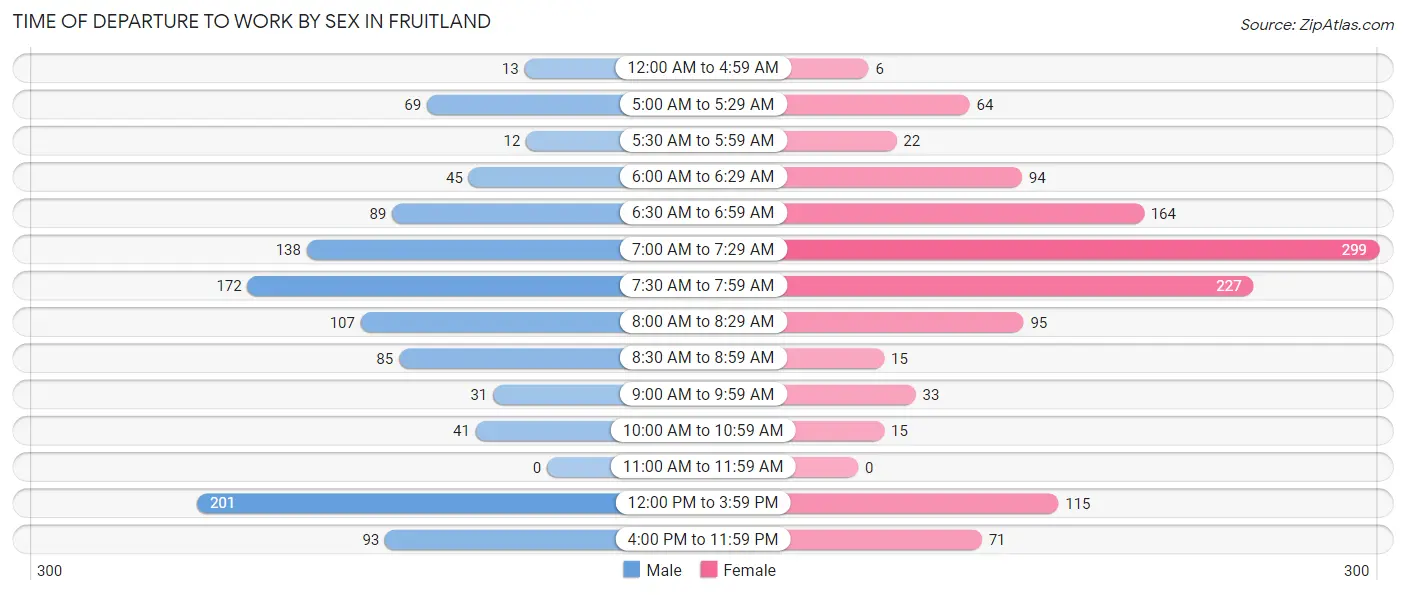
| Time of Departure | Male | Female |
| 12:00 AM to 4:59 AM | 13 (1.2%) | 6 (0.5%) |
| 5:00 AM to 5:29 AM | 69 (6.3%) | 64 (5.2%) |
| 5:30 AM to 5:59 AM | 12 (1.1%) | 22 (1.8%) |
| 6:00 AM to 6:29 AM | 45 (4.1%) | 94 (7.7%) |
| 6:30 AM to 6:59 AM | 89 (8.1%) | 164 (13.4%) |
| 7:00 AM to 7:29 AM | 138 (12.6%) | 299 (24.5%) |
| 7:30 AM to 7:59 AM | 172 (15.7%) | 227 (18.6%) |
| 8:00 AM to 8:29 AM | 107 (9.8%) | 95 (7.8%) |
| 8:30 AM to 8:59 AM | 85 (7.8%) | 15 (1.2%) |
| 9:00 AM to 9:59 AM | 31 (2.8%) | 33 (2.7%) |
| 10:00 AM to 10:59 AM | 41 (3.7%) | 15 (1.2%) |
| 11:00 AM to 11:59 AM | 0 (0.0%) | 0 (0.0%) |
| 12:00 PM to 3:59 PM | 201 (18.3%) | 115 (9.4%) |
| 4:00 PM to 11:59 PM | 93 (8.5%) | 71 (5.8%) |
| Total | 1,096 (100.0%) | 1,220 (100.0%) |
Housing Occupancy in Fruitland
Occupancy by Ownership in Fruitland
Of the total 2,016 dwellings in Fruitland, owner-occupied units account for 1,214 (60.2%), while renter-occupied units make up 802 (39.8%).
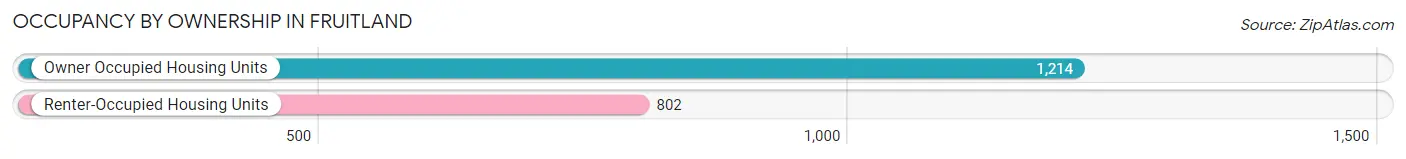
| Occupancy | # Housing Units | % Housing Units |
| Owner Occupied Housing Units | 1,214 | 60.2% |
| Renter-Occupied Housing Units | 802 | 39.8% |
| Total Occupied Housing Units | 2,016 | 100.0% |
Occupancy by Household Size in Fruitland
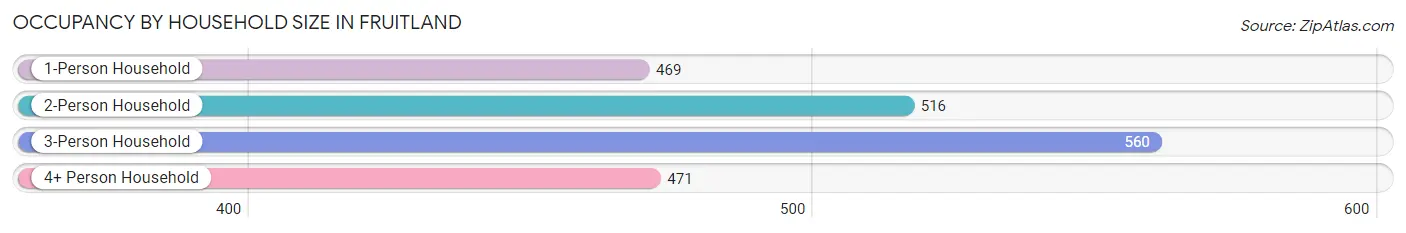
| Household Size | # Housing Units | % Housing Units |
| 1-Person Household | 469 | 23.3% |
| 2-Person Household | 516 | 25.6% |
| 3-Person Household | 560 | 27.8% |
| 4+ Person Household | 471 | 23.4% |
| Total Housing Units | 2,016 | 100.0% |
Occupancy by Ownership by Household Size in Fruitland
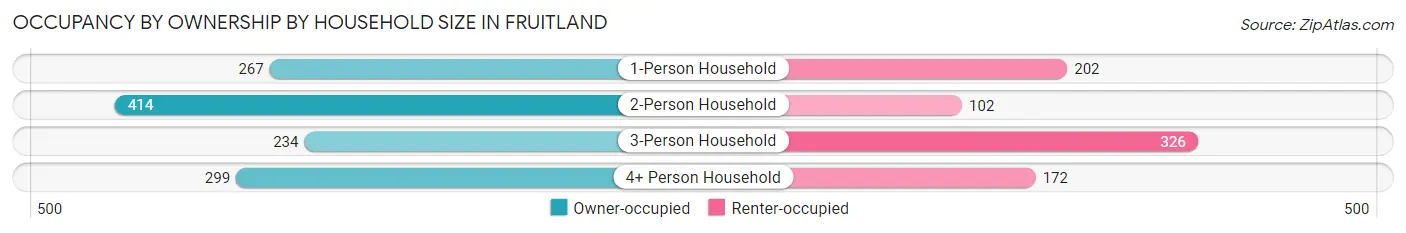
| Household Size | Owner-occupied | Renter-occupied |
| 1-Person Household | 267 (56.9%) | 202 (43.1%) |
| 2-Person Household | 414 (80.2%) | 102 (19.8%) |
| 3-Person Household | 234 (41.8%) | 326 (58.2%) |
| 4+ Person Household | 299 (63.5%) | 172 (36.5%) |
| Total Housing Units | 1,214 (60.2%) | 802 (39.8%) |
Occupancy by Educational Attainment in Fruitland
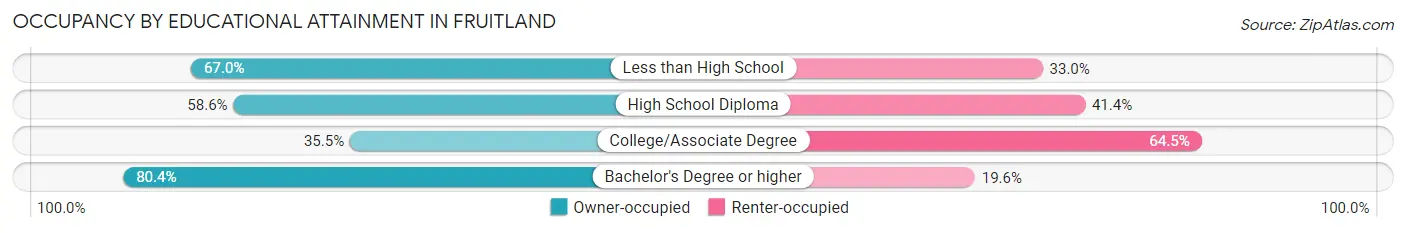
| Household Size | Owner-occupied | Renter-occupied |
| Less than High School | 67 (67.0%) | 33 (33.0%) |
| High School Diploma | 351 (58.6%) | 248 (41.4%) |
| College/Associate Degree | 208 (35.5%) | 378 (64.5%) |
| Bachelor's Degree or higher | 588 (80.4%) | 143 (19.6%) |
Occupancy by Age of Householder in Fruitland
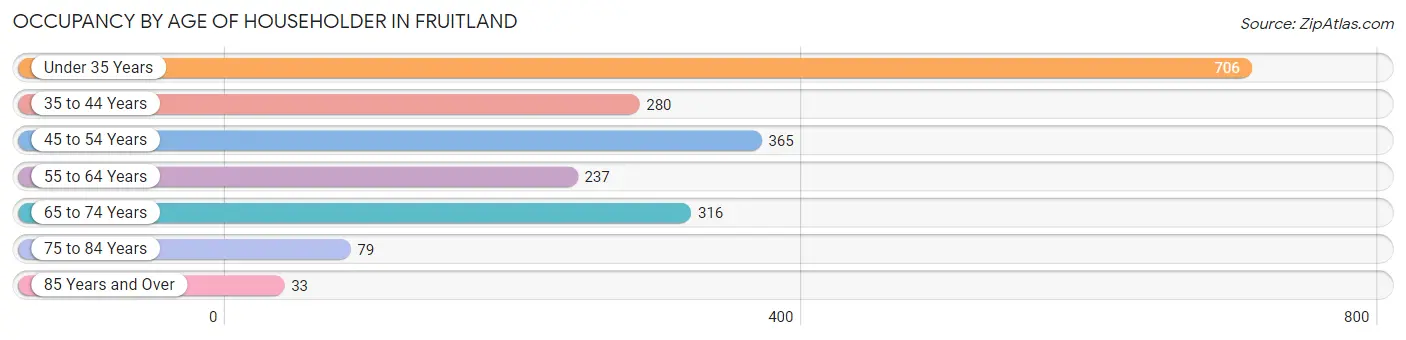
| Age Bracket | # Households | % Households |
| Under 35 Years | 706 | 35.0% |
| 35 to 44 Years | 280 | 13.9% |
| 45 to 54 Years | 365 | 18.1% |
| 55 to 64 Years | 237 | 11.8% |
| 65 to 74 Years | 316 | 15.7% |
| 75 to 84 Years | 79 | 3.9% |
| 85 Years and Over | 33 | 1.6% |
| Total | 2,016 | 100.0% |
Housing Finances in Fruitland
Median Income by Occupancy in Fruitland
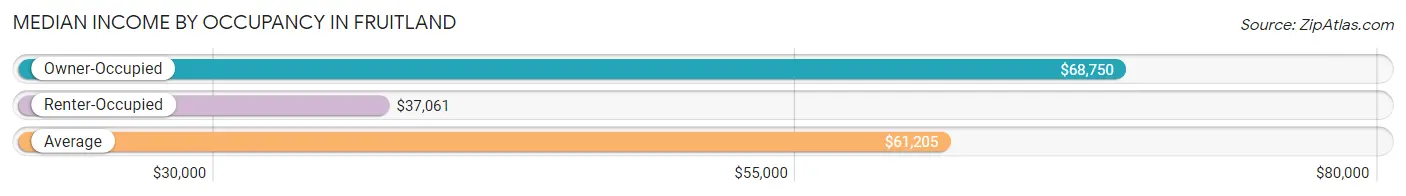
| Occupancy Type | # Households | Median Income |
| Owner-Occupied | 1,214 (60.2%) | $68,750 |
| Renter-Occupied | 802 (39.8%) | $37,061 |
| Average | 2,016 (100.0%) | $61,205 |
Occupancy by Householder Income Bracket in Fruitland
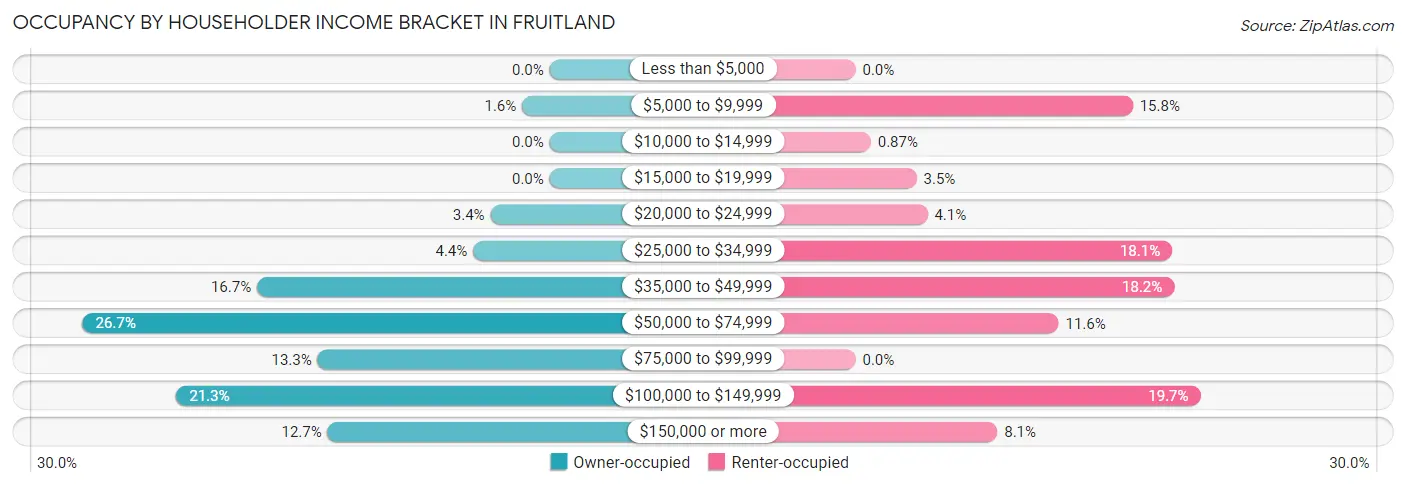
| Income Bracket | Owner-occupied | Renter-occupied |
| Less than $5,000 | 0 (0.0%) | 0 (0.0%) |
| $5,000 to $9,999 | 19 (1.6%) | 127 (15.8%) |
| $10,000 to $14,999 | 0 (0.0%) | 7 (0.9%) |
| $15,000 to $19,999 | 0 (0.0%) | 28 (3.5%) |
| $20,000 to $24,999 | 41 (3.4%) | 33 (4.1%) |
| $25,000 to $34,999 | 53 (4.4%) | 145 (18.1%) |
| $35,000 to $49,999 | 203 (16.7%) | 146 (18.2%) |
| $50,000 to $74,999 | 324 (26.7%) | 93 (11.6%) |
| $75,000 to $99,999 | 161 (13.3%) | 0 (0.0%) |
| $100,000 to $149,999 | 259 (21.3%) | 158 (19.7%) |
| $150,000 or more | 154 (12.7%) | 65 (8.1%) |
| Total | 1,214 (100.0%) | 802 (100.0%) |
Monthly Housing Cost Tiers in Fruitland
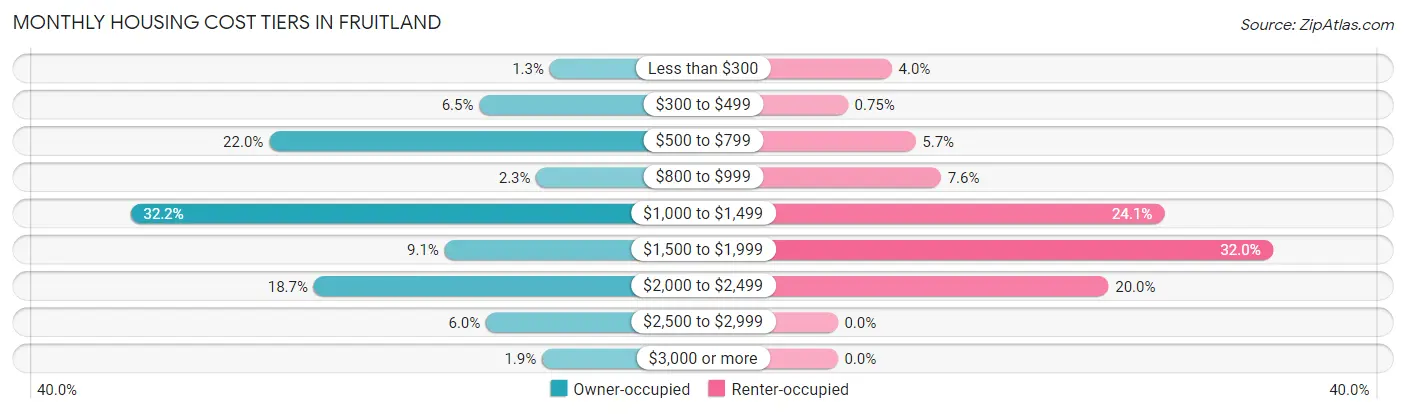
| Monthly Cost | Owner-occupied | Renter-occupied |
| Less than $300 | 16 (1.3%) | 32 (4.0%) |
| $300 to $499 | 79 (6.5%) | 6 (0.7%) |
| $500 to $799 | 267 (22.0%) | 46 (5.7%) |
| $800 to $999 | 28 (2.3%) | 61 (7.6%) |
| $1,000 to $1,499 | 391 (32.2%) | 193 (24.1%) |
| $1,500 to $1,999 | 110 (9.1%) | 257 (32.0%) |
| $2,000 to $2,499 | 227 (18.7%) | 160 (20.0%) |
| $2,500 to $2,999 | 73 (6.0%) | 0 (0.0%) |
| $3,000 or more | 23 (1.9%) | 0 (0.0%) |
| Total | 1,214 (100.0%) | 802 (100.0%) |
Physical Housing Characteristics in Fruitland
Housing Structures in Fruitland
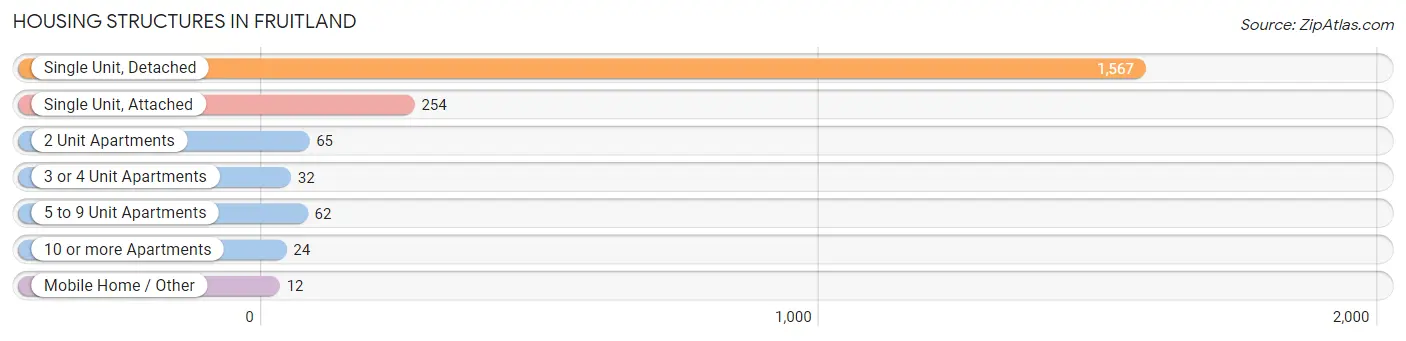
| Structure Type | # Housing Units | % Housing Units |
| Single Unit, Detached | 1,567 | 77.7% |
| Single Unit, Attached | 254 | 12.6% |
| 2 Unit Apartments | 65 | 3.2% |
| 3 or 4 Unit Apartments | 32 | 1.6% |
| 5 to 9 Unit Apartments | 62 | 3.1% |
| 10 or more Apartments | 24 | 1.2% |
| Mobile Home / Other | 12 | 0.6% |
| Total | 2,016 | 100.0% |
Housing Structures by Occupancy in Fruitland
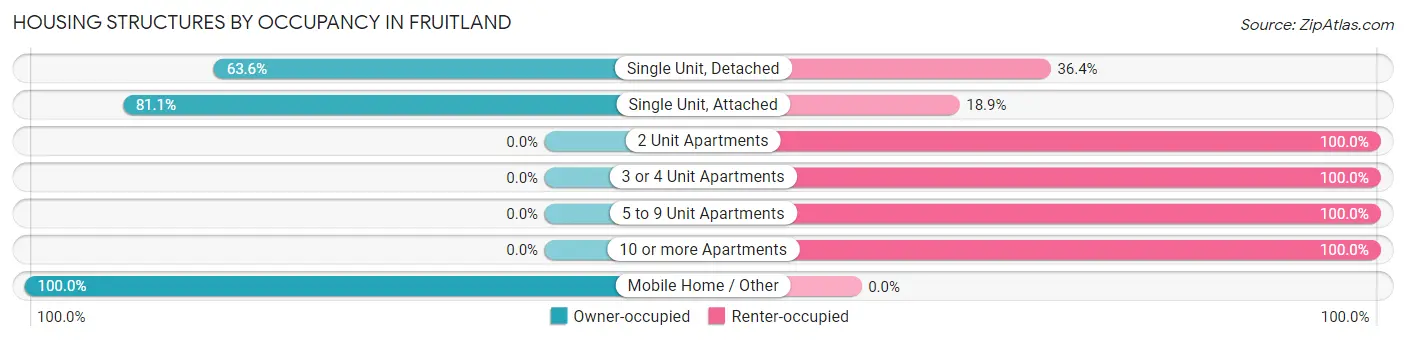
| Structure Type | Owner-occupied | Renter-occupied |
| Single Unit, Detached | 996 (63.6%) | 571 (36.4%) |
| Single Unit, Attached | 206 (81.1%) | 48 (18.9%) |
| 2 Unit Apartments | 0 (0.0%) | 65 (100.0%) |
| 3 or 4 Unit Apartments | 0 (0.0%) | 32 (100.0%) |
| 5 to 9 Unit Apartments | 0 (0.0%) | 62 (100.0%) |
| 10 or more Apartments | 0 (0.0%) | 24 (100.0%) |
| Mobile Home / Other | 12 (100.0%) | 0 (0.0%) |
| Total | 1,214 (60.2%) | 802 (39.8%) |
Housing Structures by Number of Rooms in Fruitland
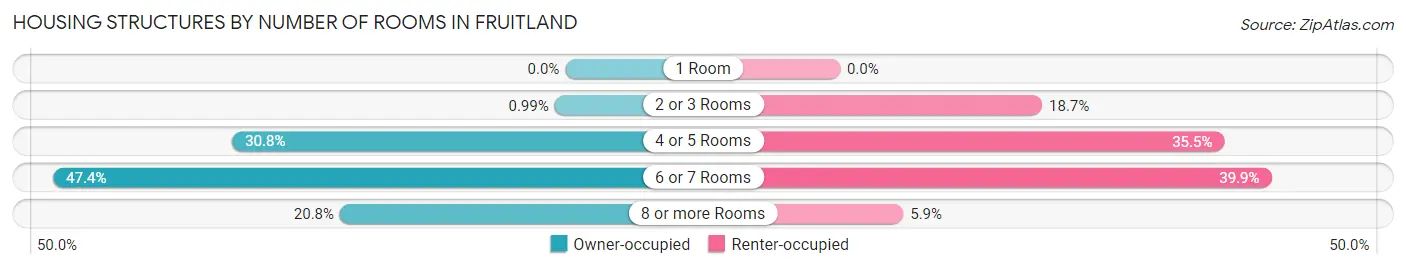
| Number of Rooms | Owner-occupied | Renter-occupied |
| 1 Room | 0 (0.0%) | 0 (0.0%) |
| 2 or 3 Rooms | 12 (1.0%) | 150 (18.7%) |
| 4 or 5 Rooms | 374 (30.8%) | 285 (35.5%) |
| 6 or 7 Rooms | 575 (47.4%) | 320 (39.9%) |
| 8 or more Rooms | 253 (20.8%) | 47 (5.9%) |
| Total | 1,214 (100.0%) | 802 (100.0%) |
Housing Structure by Heating Type in Fruitland
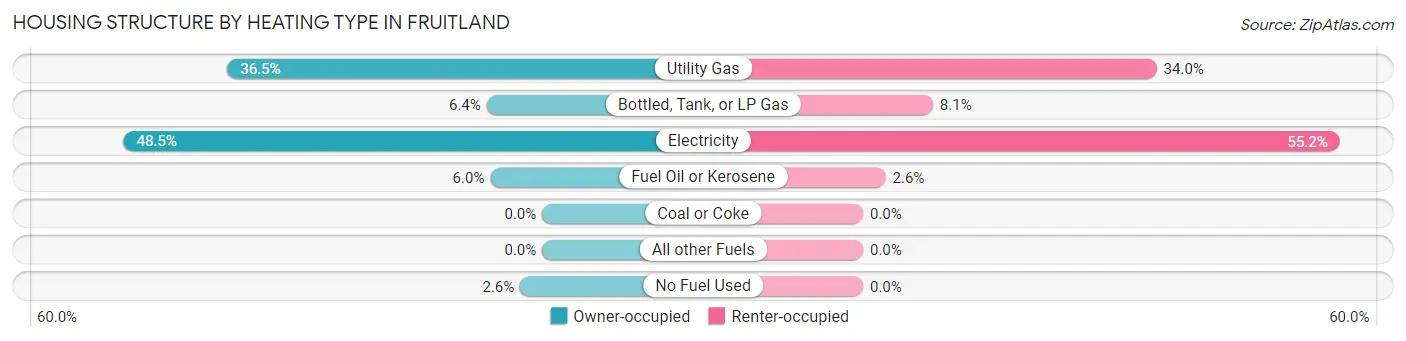
| Heating Type | Owner-occupied | Renter-occupied |
| Utility Gas | 443 (36.5%) | 273 (34.0%) |
| Bottled, Tank, or LP Gas | 78 (6.4%) | 65 (8.1%) |
| Electricity | 589 (48.5%) | 443 (55.2%) |
| Fuel Oil or Kerosene | 73 (6.0%) | 21 (2.6%) |
| Coal or Coke | 0 (0.0%) | 0 (0.0%) |
| All other Fuels | 0 (0.0%) | 0 (0.0%) |
| No Fuel Used | 31 (2.5%) | 0 (0.0%) |
| Total | 1,214 (100.0%) | 802 (100.0%) |
Household Vehicle Usage in Fruitland
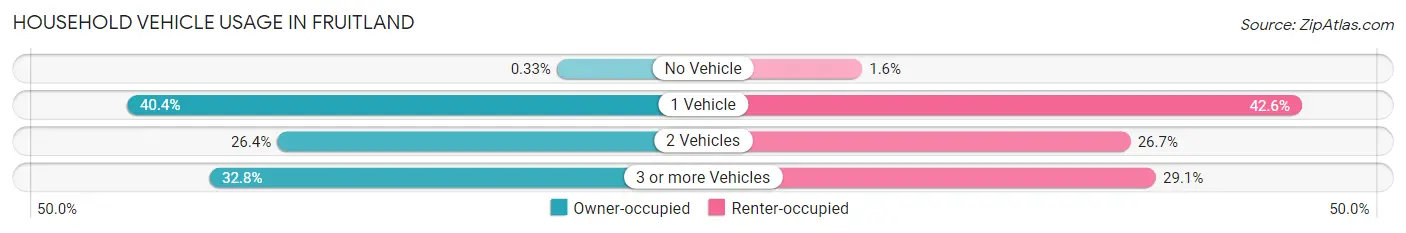
| Vehicles per Household | Owner-occupied | Renter-occupied |
| No Vehicle | 4 (0.3%) | 13 (1.6%) |
| 1 Vehicle | 491 (40.4%) | 342 (42.6%) |
| 2 Vehicles | 321 (26.4%) | 214 (26.7%) |
| 3 or more Vehicles | 398 (32.8%) | 233 (29.0%) |
| Total | 1,214 (100.0%) | 802 (100.0%) |
Real Estate & Mortgages in Fruitland
Real Estate and Mortgage Overview in Fruitland
| Characteristic | Without Mortgage | With Mortgage |
| Housing Units | 356 | 858 |
| Median Property Value | $123,600 | $221,100 |
| Median Household Income | $49,564 | $154 |
| Monthly Housing Costs | $560 | $23 |
| Real Estate Taxes | - | - |
Property Value by Mortgage Status in Fruitland
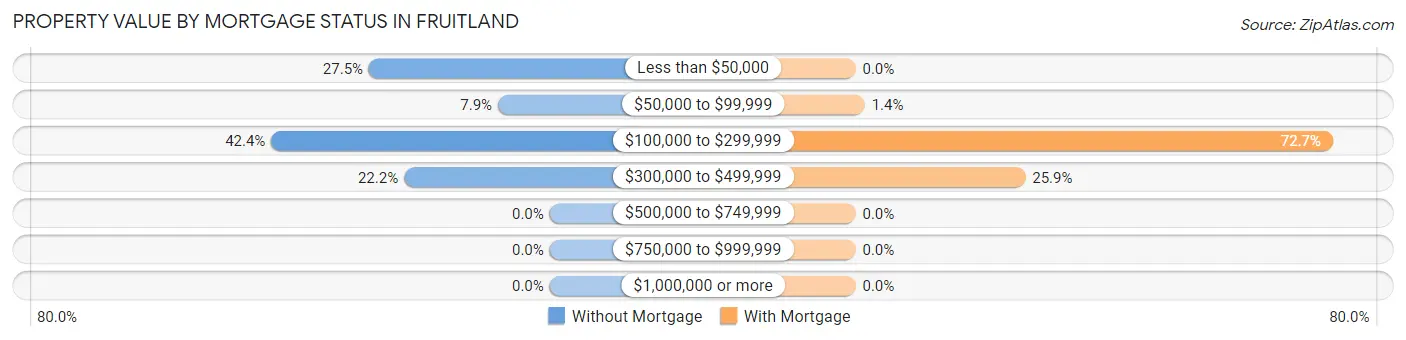
| Property Value | Without Mortgage | With Mortgage |
| Less than $50,000 | 98 (27.5%) | 0 (0.0%) |
| $50,000 to $99,999 | 28 (7.9%) | 12 (1.4%) |
| $100,000 to $299,999 | 151 (42.4%) | 624 (72.7%) |
| $300,000 to $499,999 | 79 (22.2%) | 222 (25.9%) |
| $500,000 to $749,999 | 0 (0.0%) | 0 (0.0%) |
| $750,000 to $999,999 | 0 (0.0%) | 0 (0.0%) |
| $1,000,000 or more | 0 (0.0%) | 0 (0.0%) |
| Total | 356 (100.0%) | 858 (100.0%) |
Household Income by Mortgage Status in Fruitland
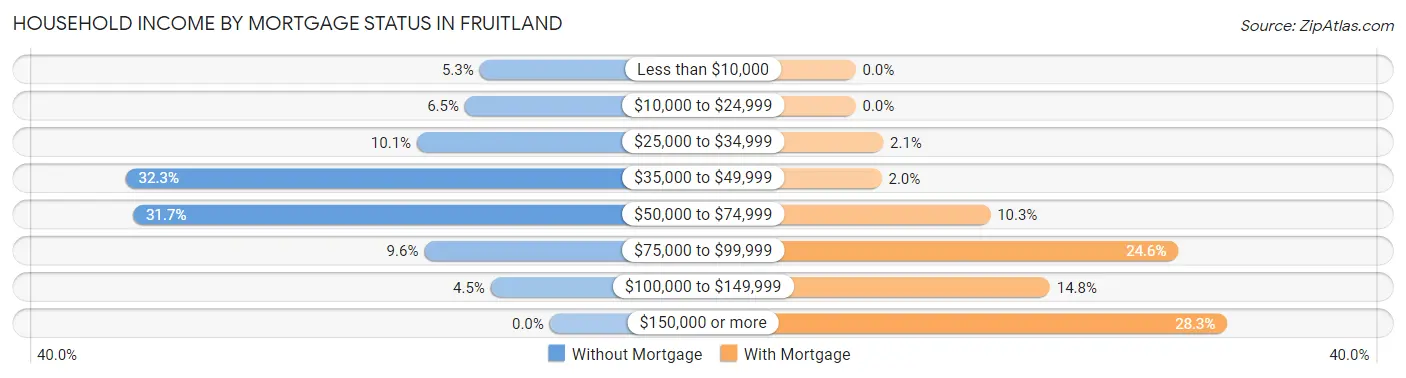
| Household Income | Without Mortgage | With Mortgage |
| Less than $10,000 | 19 (5.3%) | 0 (0.0%) |
| $10,000 to $24,999 | 23 (6.5%) | 0 (0.0%) |
| $25,000 to $34,999 | 36 (10.1%) | 18 (2.1%) |
| $35,000 to $49,999 | 115 (32.3%) | 17 (2.0%) |
| $50,000 to $74,999 | 113 (31.7%) | 88 (10.3%) |
| $75,000 to $99,999 | 34 (9.6%) | 211 (24.6%) |
| $100,000 to $149,999 | 16 (4.5%) | 127 (14.8%) |
| $150,000 or more | 0 (0.0%) | 243 (28.3%) |
| Total | 356 (100.0%) | 858 (100.0%) |
Property Value to Household Income Ratio in Fruitland
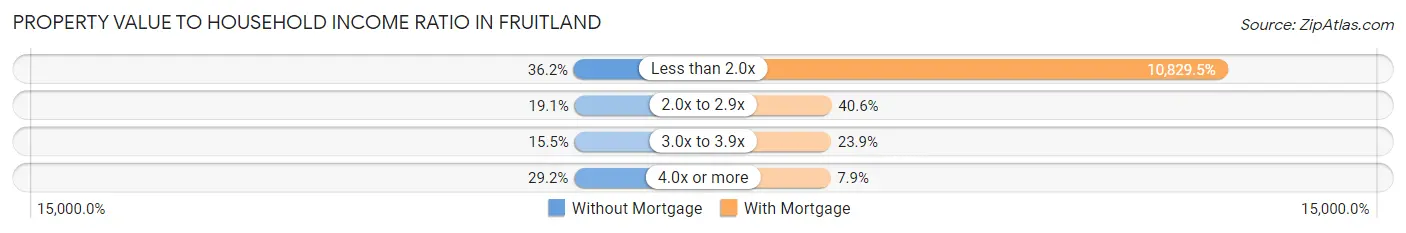
| Value-to-Income Ratio | Without Mortgage | With Mortgage |
| Less than 2.0x | 129 (36.2%) | 92,917 (10,829.5%) |
| 2.0x to 2.9x | 68 (19.1%) | 348 (40.6%) |
| 3.0x to 3.9x | 55 (15.4%) | 205 (23.9%) |
| 4.0x or more | 104 (29.2%) | 68 (7.9%) |
| Total | 356 (100.0%) | 858 (100.0%) |
Real Estate Taxes by Mortgage Status in Fruitland
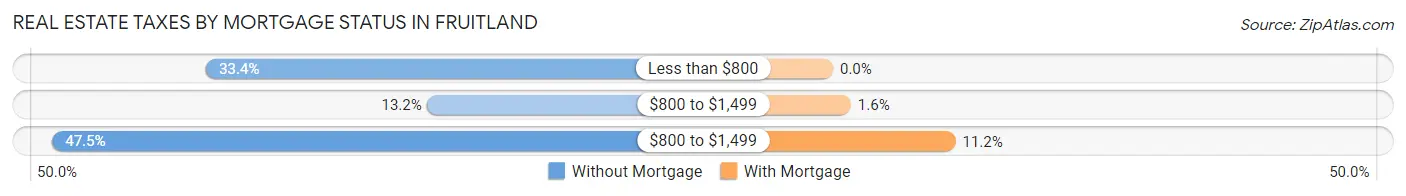
| Property Taxes | Without Mortgage | With Mortgage |
| Less than $800 | 119 (33.4%) | 0 (0.0%) |
| $800 to $1,499 | 47 (13.2%) | 14 (1.6%) |
| $800 to $1,499 | 169 (47.5%) | 96 (11.2%) |
| Total | 356 (100.0%) | 858 (100.0%) |
Health & Disability in Fruitland
Health Insurance Coverage by Age in Fruitland
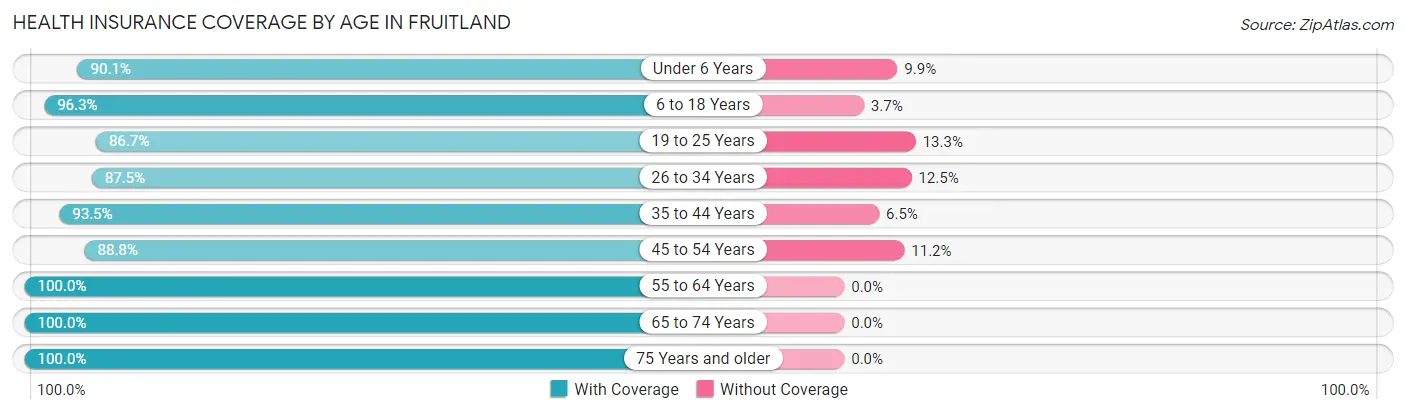
| Age Bracket | With Coverage | Without Coverage |
| Under 6 Years | 546 (90.1%) | 60 (9.9%) |
| 6 to 18 Years | 684 (96.3%) | 26 (3.7%) |
| 19 to 25 Years | 1,054 (86.7%) | 162 (13.3%) |
| 26 to 34 Years | 663 (87.5%) | 95 (12.5%) |
| 35 to 44 Years | 461 (93.5%) | 32 (6.5%) |
| 45 to 54 Years | 682 (88.8%) | 86 (11.2%) |
| 55 to 64 Years | 401 (100.0%) | 0 (0.0%) |
| 65 to 74 Years | 523 (100.0%) | 0 (0.0%) |
| 75 Years and older | 125 (100.0%) | 0 (0.0%) |
| Total | 5,139 (91.8%) | 461 (8.2%) |
Health Insurance Coverage by Citizenship Status in Fruitland
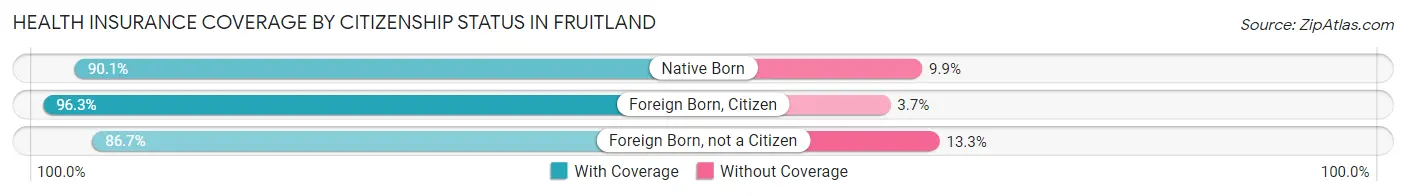
| Citizenship Status | With Coverage | Without Coverage |
| Native Born | 546 (90.1%) | 60 (9.9%) |
| Foreign Born, Citizen | 684 (96.3%) | 26 (3.7%) |
| Foreign Born, not a Citizen | 1,054 (86.7%) | 162 (13.3%) |
Health Insurance Coverage by Household Income in Fruitland
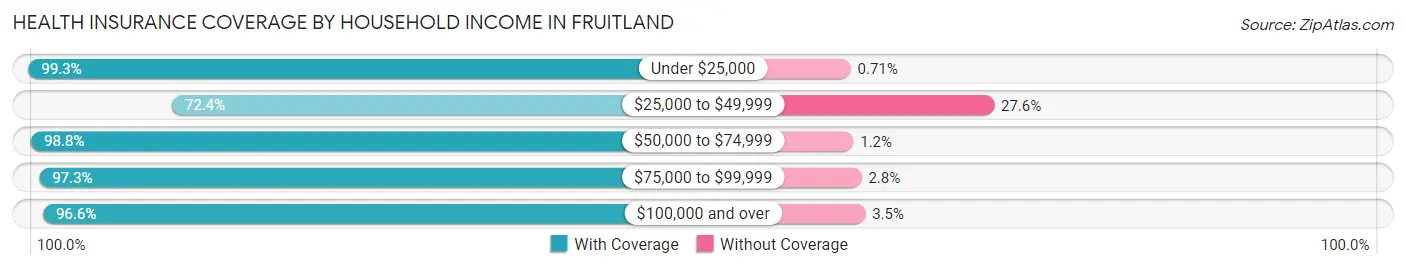
| Household Income | With Coverage | Without Coverage |
| Under $25,000 | 563 (99.3%) | 4 (0.7%) |
| $25,000 to $49,999 | 918 (72.4%) | 350 (27.6%) |
| $50,000 to $74,999 | 813 (98.8%) | 10 (1.2%) |
| $75,000 to $99,999 | 566 (97.3%) | 16 (2.8%) |
| $100,000 and over | 2,267 (96.6%) | 81 (3.5%) |
Public vs Private Health Insurance Coverage by Age in Fruitland
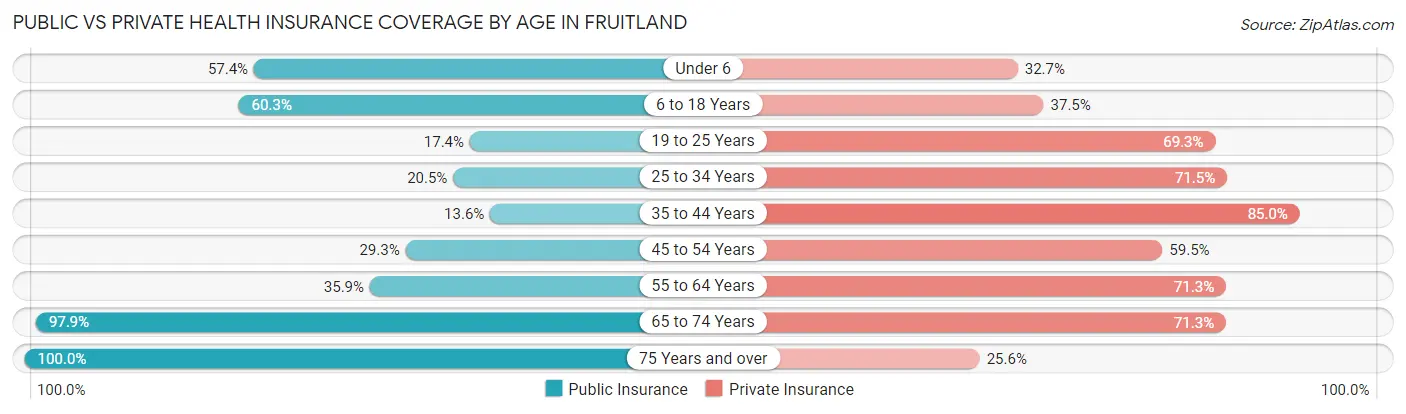
| Age Bracket | Public Insurance | Private Insurance |
| Under 6 | 348 (57.4%) | 198 (32.7%) |
| 6 to 18 Years | 428 (60.3%) | 266 (37.5%) |
| 19 to 25 Years | 211 (17.3%) | 843 (69.3%) |
| 25 to 34 Years | 155 (20.4%) | 542 (71.5%) |
| 35 to 44 Years | 67 (13.6%) | 419 (85.0%) |
| 45 to 54 Years | 225 (29.3%) | 457 (59.5%) |
| 55 to 64 Years | 144 (35.9%) | 286 (71.3%) |
| 65 to 74 Years | 512 (97.9%) | 373 (71.3%) |
| 75 Years and over | 125 (100.0%) | 32 (25.6%) |
| Total | 2,215 (39.6%) | 3,416 (61.0%) |
Disability Status by Sex by Age in Fruitland
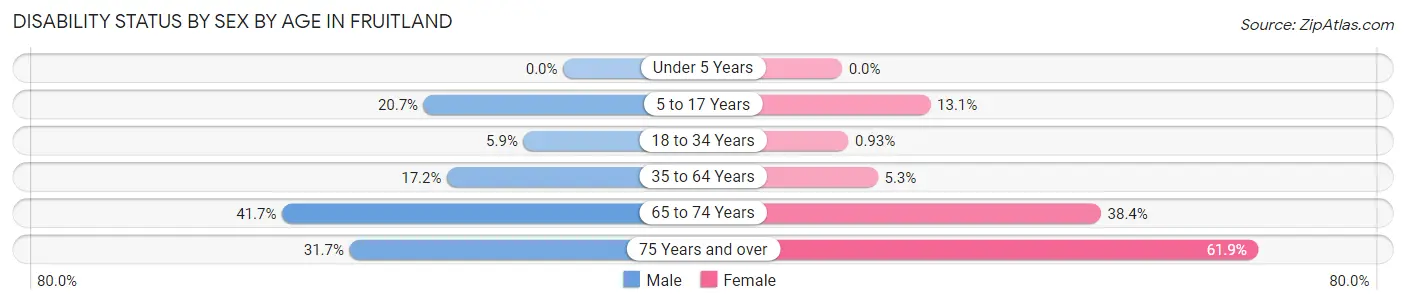
| Age Bracket | Male | Female |
| Under 5 Years | 0 (0.0%) | 0 (0.0%) |
| 5 to 17 Years | 71 (20.7%) | 48 (13.1%) |
| 18 to 34 Years | 50 (5.9%) | 11 (0.9%) |
| 35 to 64 Years | 137 (17.2%) | 46 (5.3%) |
| 65 to 74 Years | 101 (41.7%) | 108 (38.4%) |
| 75 Years and over | 13 (31.7%) | 52 (61.9%) |
Disability Class by Sex by Age in Fruitland
Disability Class: Hearing Difficulty
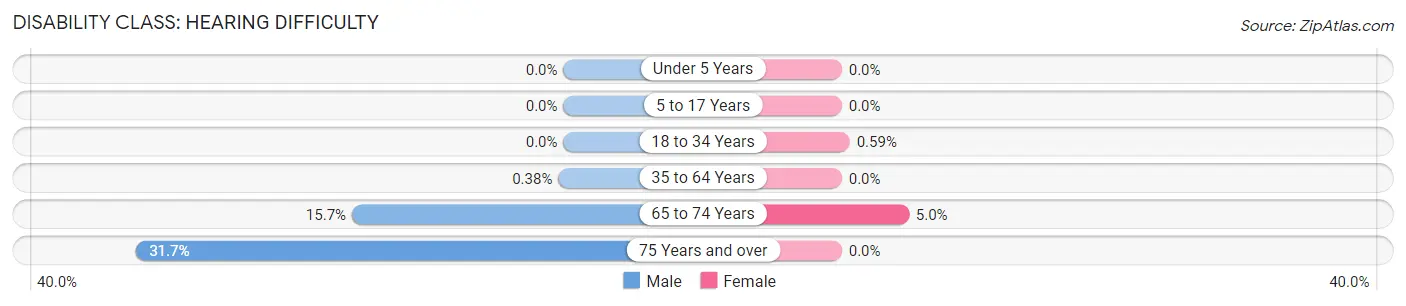
| Age Bracket | Male | Female |
| Under 5 Years | 0 (0.0%) | 0 (0.0%) |
| 5 to 17 Years | 0 (0.0%) | 0 (0.0%) |
| 18 to 34 Years | 0 (0.0%) | 7 (0.6%) |
| 35 to 64 Years | 3 (0.4%) | 0 (0.0%) |
| 65 to 74 Years | 38 (15.7%) | 14 (5.0%) |
| 75 Years and over | 13 (31.7%) | 0 (0.0%) |
Disability Class: Vision Difficulty
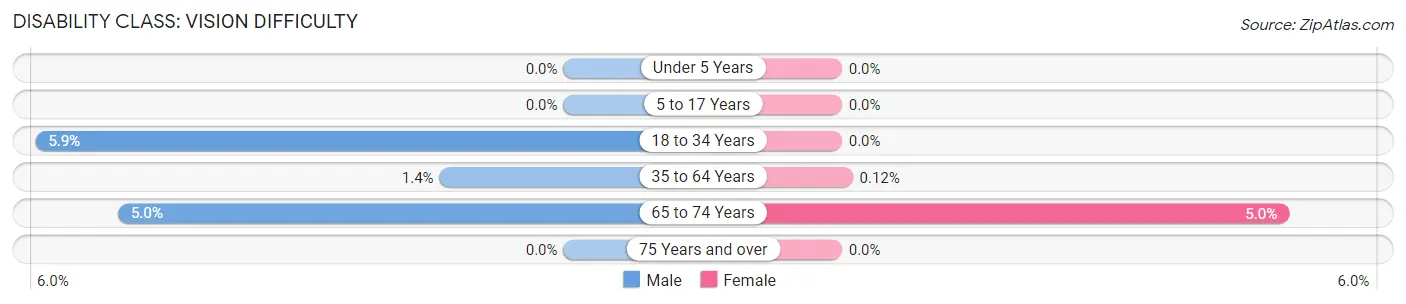
| Age Bracket | Male | Female |
| Under 5 Years | 0 (0.0%) | 0 (0.0%) |
| 5 to 17 Years | 0 (0.0%) | 0 (0.0%) |
| 18 to 34 Years | 50 (5.9%) | 0 (0.0%) |
| 35 to 64 Years | 11 (1.4%) | 1 (0.1%) |
| 65 to 74 Years | 12 (5.0%) | 14 (5.0%) |
| 75 Years and over | 0 (0.0%) | 0 (0.0%) |
Disability Class: Cognitive Difficulty
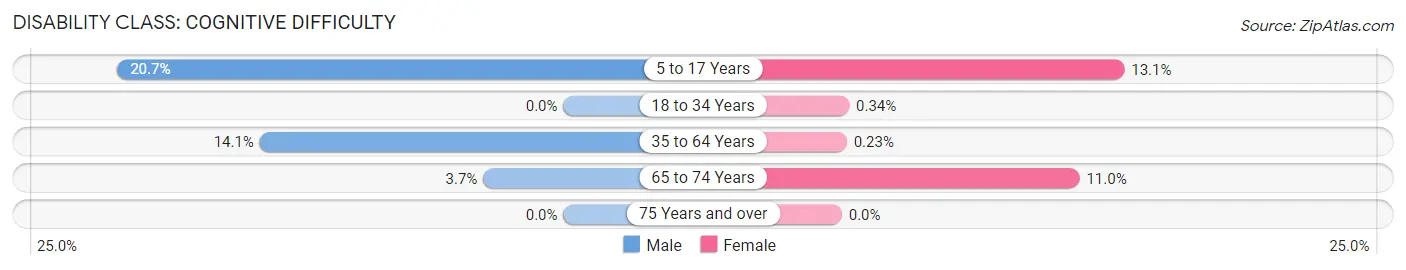
| Age Bracket | Male | Female |
| 5 to 17 Years | 71 (20.7%) | 48 (13.1%) |
| 18 to 34 Years | 0 (0.0%) | 4 (0.3%) |
| 35 to 64 Years | 112 (14.1%) | 2 (0.2%) |
| 65 to 74 Years | 9 (3.7%) | 31 (11.0%) |
| 75 Years and over | 0 (0.0%) | 0 (0.0%) |
Disability Class: Ambulatory Difficulty
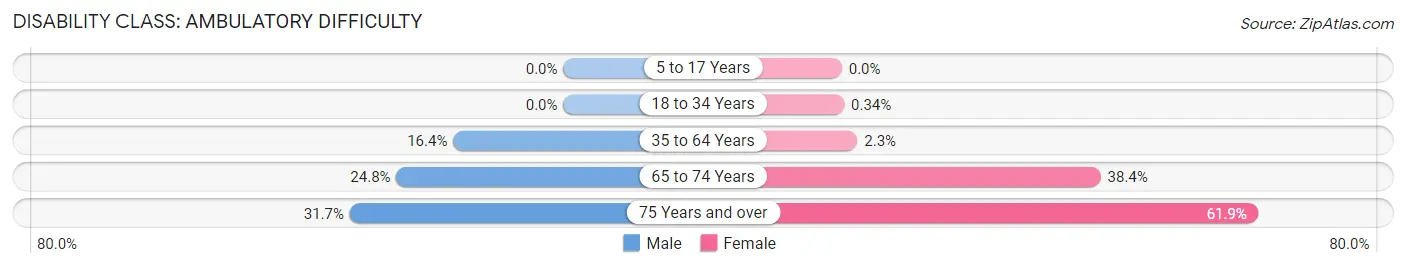
| Age Bracket | Male | Female |
| 5 to 17 Years | 0 (0.0%) | 0 (0.0%) |
| 18 to 34 Years | 0 (0.0%) | 4 (0.3%) |
| 35 to 64 Years | 130 (16.4%) | 20 (2.3%) |
| 65 to 74 Years | 60 (24.8%) | 108 (38.4%) |
| 75 Years and over | 13 (31.7%) | 52 (61.9%) |
Disability Class: Self-Care Difficulty
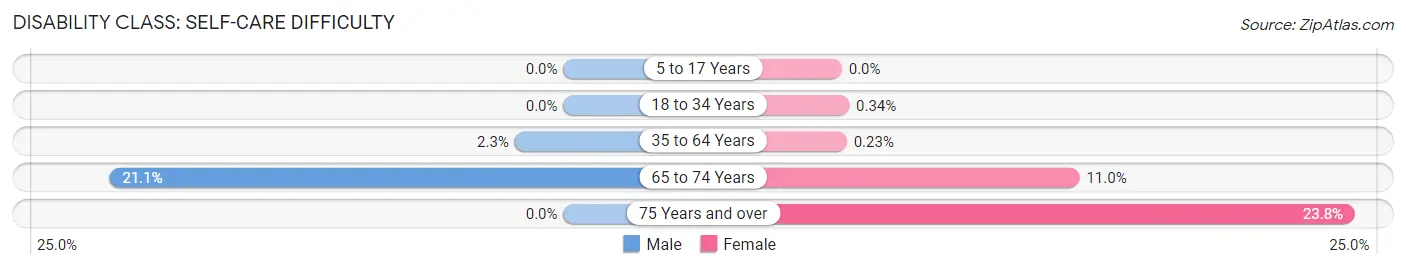
| Age Bracket | Male | Female |
| 5 to 17 Years | 0 (0.0%) | 0 (0.0%) |
| 18 to 34 Years | 0 (0.0%) | 4 (0.3%) |
| 35 to 64 Years | 18 (2.3%) | 2 (0.2%) |
| 65 to 74 Years | 51 (21.1%) | 31 (11.0%) |
| 75 Years and over | 0 (0.0%) | 20 (23.8%) |
Technology Access in Fruitland
Computing Device Access in Fruitland
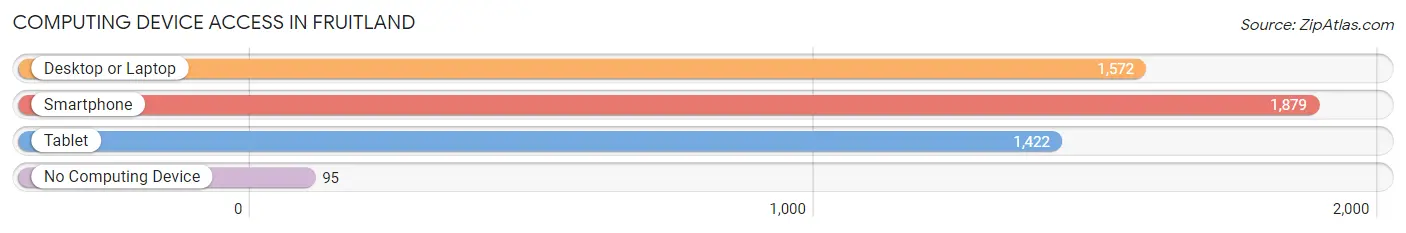
| Device Type | # Households | % Households |
| Desktop or Laptop | 1,572 | 78.0% |
| Smartphone | 1,879 | 93.2% |
| Tablet | 1,422 | 70.5% |
| No Computing Device | 95 | 4.7% |
| Total | 2,016 | 100.0% |
Internet Access in Fruitland
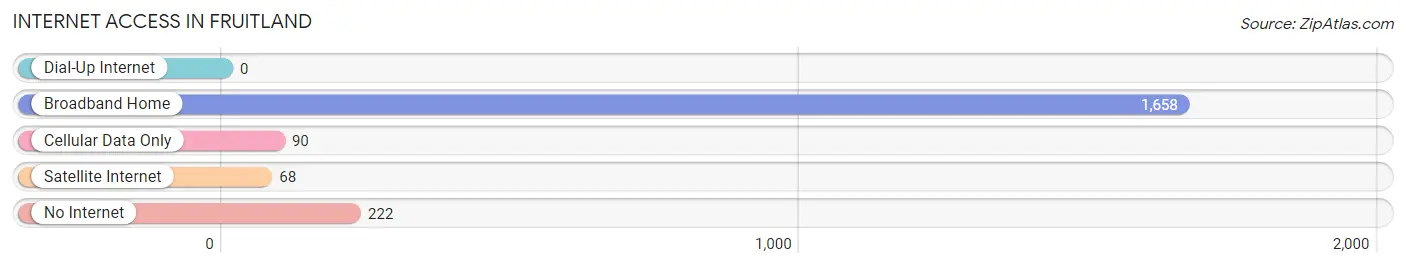
| Internet Type | # Households | % Households |
| Dial-Up Internet | 0 | 0.0% |
| Broadband Home | 1,658 | 82.2% |
| Cellular Data Only | 90 | 4.5% |
| Satellite Internet | 68 | 3.4% |
| No Internet | 222 | 11.0% |
| Total | 2,016 | 100.0% |
Fruitland Summary
Fruitland, Maryland is a small town located in Wicomico County, Maryland. It is situated on the banks of the Nanticoke River, about 10 miles south of Salisbury. The town has a population of approximately 4,000 people and is part of the Salisbury Metropolitan Statistical Area.
History
Fruitland was founded in 1867 by a group of farmers who wanted to create a community that was centered around the production of fruit. The town was named after the abundance of fruit trees that were planted in the area. The town was incorporated in 1887 and has remained a small, rural community ever since.
The town was home to a number of prominent families, including the Bounds, the Brittinghams, and the Truitts. These families were instrumental in the development of the town and helped to shape its culture and history.
Geography
Fruitland is located in the Eastern Shore region of Maryland. It is situated on the banks of the Nanticoke River, about 10 miles south of Salisbury. The town is surrounded by farmland and is located in a rural area. The town is located in a humid subtropical climate zone and experiences hot, humid summers and mild winters.
Economy
Fruitland’s economy is largely based on agriculture. The town is home to a number of farms that produce a variety of fruits and vegetables. The town is also home to a number of small businesses, including restaurants, retail stores, and service providers.
Demographics
As of the 2010 census, Fruitland had a population of 4,000 people. The racial makeup of the town was 79.3% White, 15.2% African American, 0.3% Native American, 0.7% Asian, 0.1% Pacific Islander, and 4.4% from other races. The median household income was $41,250 and the median family income was $50,000.
Fruitland is a small, rural town with a rich history and a strong sense of community. The town is home to a number of farms and small businesses, and is a great place to live for those who enjoy the rural lifestyle.
Common Questions
What is Per Capita Income in Fruitland?
Per Capita income in Fruitland is $28,277.
What is the Median Family Income in Fruitland?
Median Family Income in Fruitland is $84,643.
What is the Median Household income in Fruitland?
Median Household Income in Fruitland is $61,205.
What is Income or Wage Gap in Fruitland?
Income or Wage Gap in Fruitland is 9.4%.
Women in Fruitland earn 90.6 cents for every dollar earned by a man.
What is Inequality or Gini Index in Fruitland?
Inequality or Gini Index in Fruitland is 0.38.
What is the Total Population of Fruitland?
Total Population of Fruitland is 5,603.
What is the Total Male Population of Fruitland?
Total Male Population of Fruitland is 2,577.
What is the Total Female Population of Fruitland?
Total Female Population of Fruitland is 3,026.
What is the Ratio of Males per 100 Females in Fruitland?
There are 85.16 Males per 100 Females in Fruitland.
What is the Ratio of Females per 100 Males in Fruitland?
There are 117.42 Females per 100 Males in Fruitland.
What is the Median Population Age in Fruitland?
Median Population Age in Fruitland is 28.9 Years.
What is the Average Family Size in Fruitland
Average Family Size in Fruitland is 3.4 People.
What is the Average Household Size in Fruitland
Average Household Size in Fruitland is 2.8 People.
How Large is the Labor Force in Fruitland?
There are 2,765 People in the Labor Forcein in Fruitland.
What is the Percentage of People in the Labor Force in Fruitland?
62.2% of People are in the Labor Force in Fruitland.
What is the Unemployment Rate in Fruitland?
Unemployment Rate in Fruitland is 11.1%.