Midlothian, IL Map & Demographics
Midlothian Map
Midlothian Overview
$33,393
PER CAPITA INCOME
$90,703
AVG FAMILY INCOME
$66,994
AVG HOUSEHOLD INCOME
28.9%
WAGE / INCOME GAP [ % ]
71.1¢/ $1
WAGE / INCOME GAP [ $ ]
0.42
INEQUALITY / GINI INDEX
14,200
TOTAL POPULATION
7,113
MALE POPULATION
7,087
FEMALE POPULATION
100.37
MALES / 100 FEMALES
99.63
FEMALES / 100 MALES
39.0
MEDIAN AGE
3.0
AVG FAMILY SIZE
2.5
AVG HOUSEHOLD SIZE
7,159
LABOR FORCE [ PEOPLE ]
64.0%
PERCENT IN LABOR FORCE
5.4%
UNEMPLOYMENT RATE
Midlothian Zip Codes
Midlothian Area Codes
Income in Midlothian
Income Overview in Midlothian
Per Capita Income in Midlothian is $33,393, while median incomes of families and households are $90,703 and $66,994 respectively.
| Characteristic | Number | Measure |
| Per Capita Income | 14,200 | $33,393 |
| Median Family Income | 3,755 | $90,703 |
| Mean Family Income | 3,755 | $96,883 |
| Median Household Income | 5,747 | $66,994 |
| Mean Household Income | 5,747 | $82,004 |
| Income Deficit | 3,755 | $0 |
| Wage / Income Gap (%) | 14,200 | 28.87% |
| Wage / Income Gap ($) | 14,200 | 71.13¢ per $1 |
| Gini / Inequality Index | 14,200 | 0.42 |
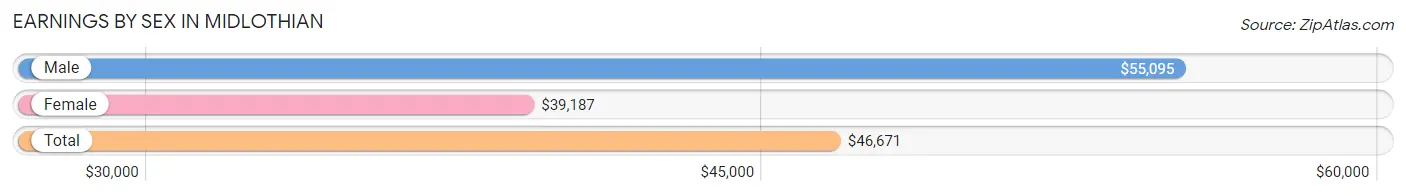
Earnings by Sex in Midlothian
Average Earnings in Midlothian are $46,671, $55,095 for men and $39,187 for women, a difference of 28.9%.
| Sex | Number | Average Earnings |
| Male | 3,752 (52.9%) | $55,095 |
| Female | 3,342 (47.1%) | $39,187 |
| Total | 7,094 (100.0%) | $46,671 |
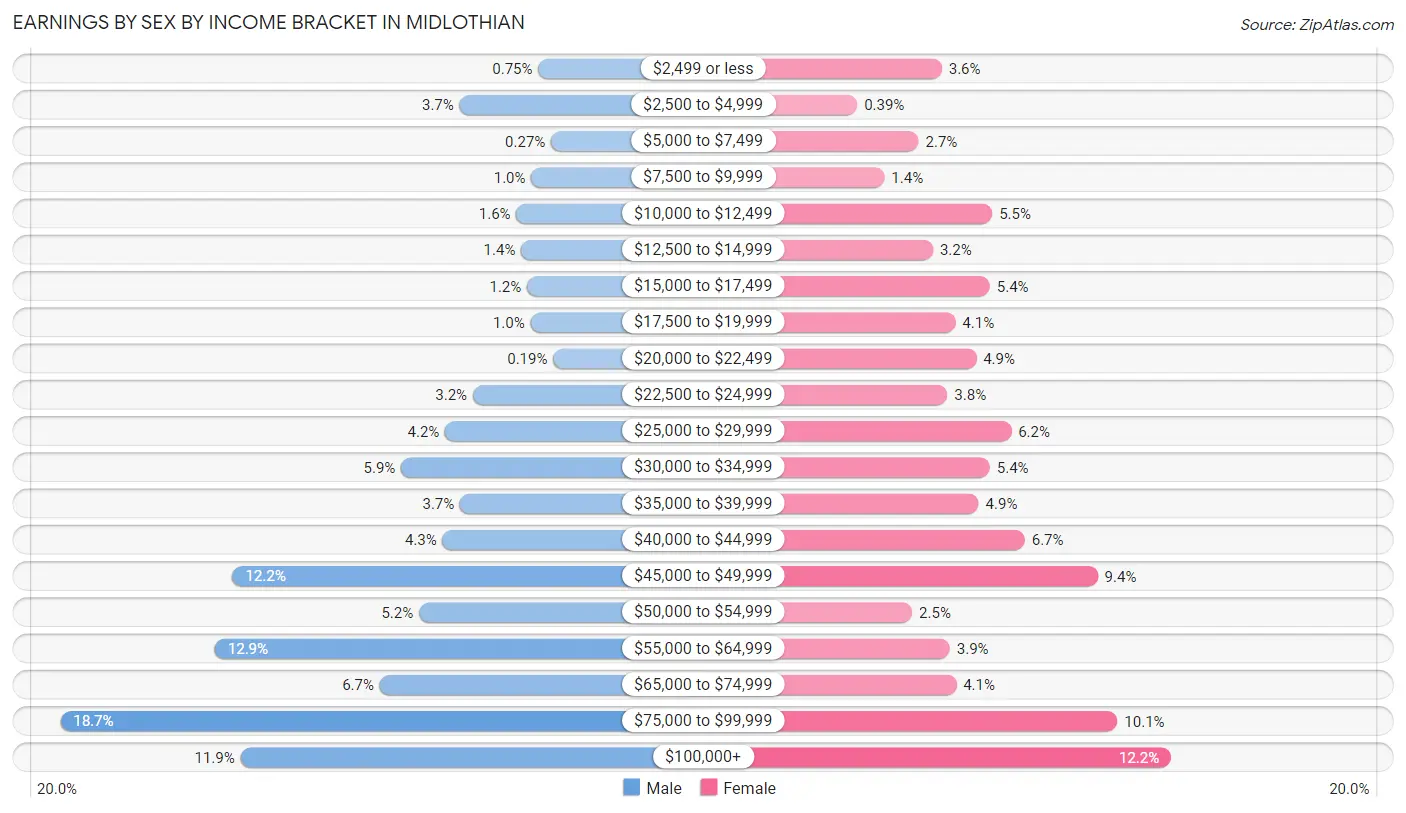
Earnings by Sex by Income Bracket in Midlothian
The most common earnings brackets in Midlothian are $75,000 to $99,999 for men (700 | 18.7%) and $100,000+ for women (406 | 12.1%).
| Income | Male | Female |
| $2,499 or less | 28 (0.7%) | 119 (3.6%) |
| $2,500 to $4,999 | 139 (3.7%) | 13 (0.4%) |
| $5,000 to $7,499 | 10 (0.3%) | 90 (2.7%) |
| $7,500 to $9,999 | 38 (1.0%) | 47 (1.4%) |
| $10,000 to $12,499 | 59 (1.6%) | 182 (5.4%) |
| $12,500 to $14,999 | 52 (1.4%) | 108 (3.2%) |
| $15,000 to $17,499 | 44 (1.2%) | 179 (5.4%) |
| $17,500 to $19,999 | 39 (1.0%) | 136 (4.1%) |
| $20,000 to $22,499 | 7 (0.2%) | 162 (4.9%) |
| $22,500 to $24,999 | 120 (3.2%) | 126 (3.8%) |
| $25,000 to $29,999 | 159 (4.2%) | 206 (6.2%) |
| $30,000 to $34,999 | 221 (5.9%) | 179 (5.4%) |
| $35,000 to $39,999 | 138 (3.7%) | 165 (4.9%) |
| $40,000 to $44,999 | 163 (4.3%) | 223 (6.7%) |
| $45,000 to $49,999 | 458 (12.2%) | 314 (9.4%) |
| $50,000 to $54,999 | 196 (5.2%) | 82 (2.5%) |
| $55,000 to $64,999 | 483 (12.9%) | 129 (3.9%) |
| $65,000 to $74,999 | 251 (6.7%) | 137 (4.1%) |
| $75,000 to $99,999 | 700 (18.7%) | 339 (10.1%) |
| $100,000+ | 447 (11.9%) | 406 (12.1%) |
| Total | 3,752 (100.0%) | 3,342 (100.0%) |
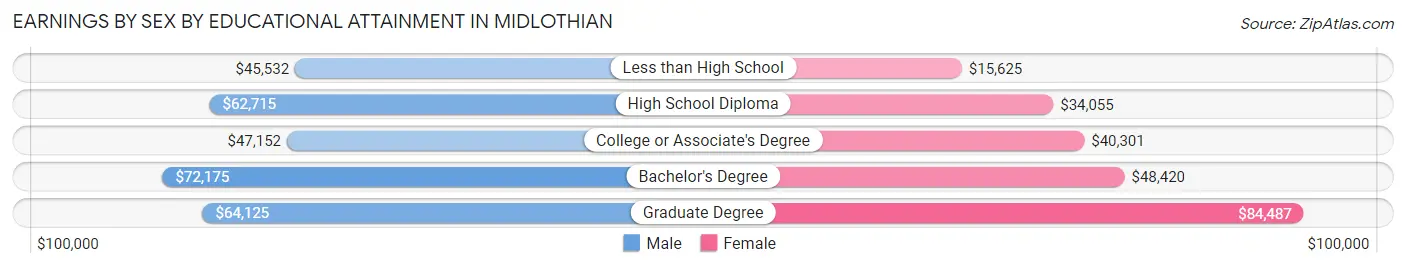
Earnings by Sex by Educational Attainment in Midlothian
Average earnings in Midlothian are $57,166 for men and $42,547 for women, a difference of 25.6%. Men with an educational attainment of bachelor's degree enjoy the highest average annual earnings of $72,175, while those with less than high school education earn the least with $45,532. Women with an educational attainment of graduate degree earn the most with the average annual earnings of $84,487, while those with less than high school education have the smallest earnings of $15,625.
| Educational Attainment | Male Income | Female Income |
| Less than High School | $45,532 | $15,625 |
| High School Diploma | $62,715 | $34,055 |
| College or Associate's Degree | $47,152 | $40,301 |
| Bachelor's Degree | $72,175 | $48,420 |
| Graduate Degree | $64,125 | $84,487 |
| Total | $57,166 | $42,547 |
Family Income in Midlothian
Family Income Brackets in Midlothian
According to the Midlothian family income data, there are 1,010 families falling into the $100,000 to $149,999 income range, which is the most common income bracket and makes up 26.9% of all families. Conversely, the $10,000 to $14,999 income bracket is the least frequent group with only 49 families (1.3%) belonging to this category.
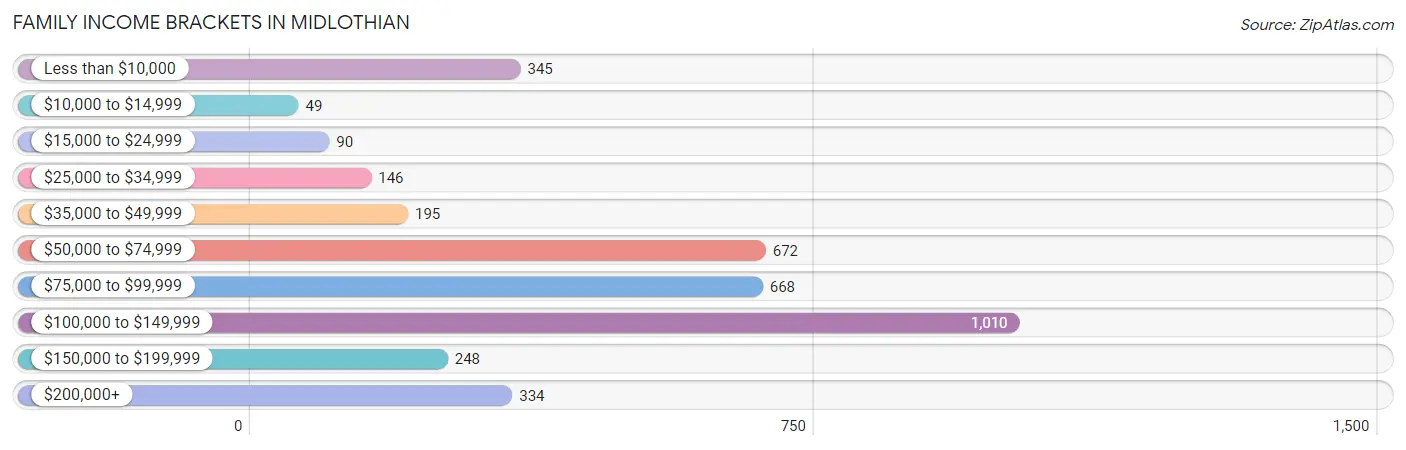
| Income Bracket | # Families | % Families |
| Less than $10,000 | 345 | 9.2% |
| $10,000 to $14,999 | 49 | 1.3% |
| $15,000 to $24,999 | 90 | 2.4% |
| $25,000 to $34,999 | 146 | 3.9% |
| $35,000 to $49,999 | 195 | 5.2% |
| $50,000 to $74,999 | 672 | 17.9% |
| $75,000 to $99,999 | 668 | 17.8% |
| $100,000 to $149,999 | 1,010 | 26.9% |
| $150,000 to $199,999 | 248 | 6.6% |
| $200,000+ | 334 | 8.9% |
Family Income by Famaliy Size in Midlothian
4-person families (994 | 26.5%) account for the highest median family income in Midlothian with $113,961 per family, while 2-person families (1,841 | 49.0%) have the highest median income of $41,892 per family member.
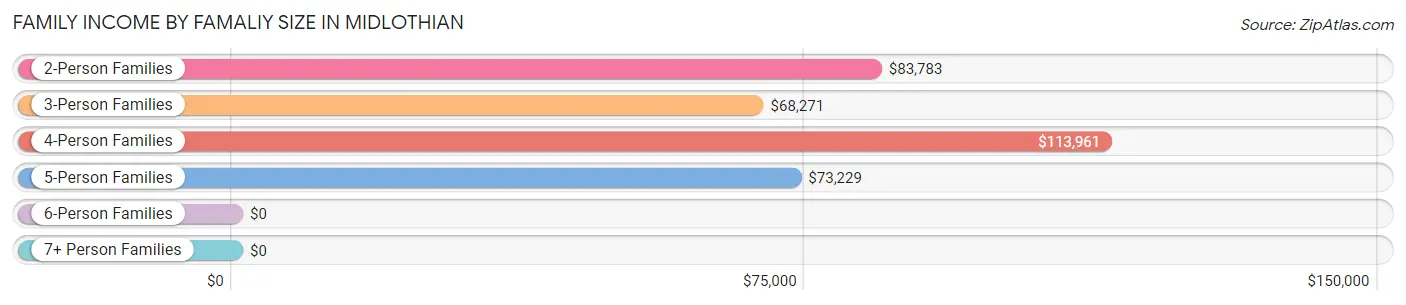
| Income Bracket | # Families | Median Income |
| 2-Person Families | 1,841 (49.0%) | $83,783 |
| 3-Person Families | 543 (14.5%) | $68,271 |
| 4-Person Families | 994 (26.5%) | $113,961 |
| 5-Person Families | 291 (7.7%) | $73,229 |
| 6-Person Families | 46 (1.2%) | $0 |
| 7+ Person Families | 40 (1.1%) | $0 |
| Total | 3,755 (100.0%) | $90,703 |
Family Income by Number of Earners in Midlothian
The median family income in Midlothian is $90,703, with families comprising 3+ earners (342) having the highest median family income of $128,681, while families with no earners (513) have the lowest median family income of $2,499, accounting for 9.1% and 13.7% of families, respectively.
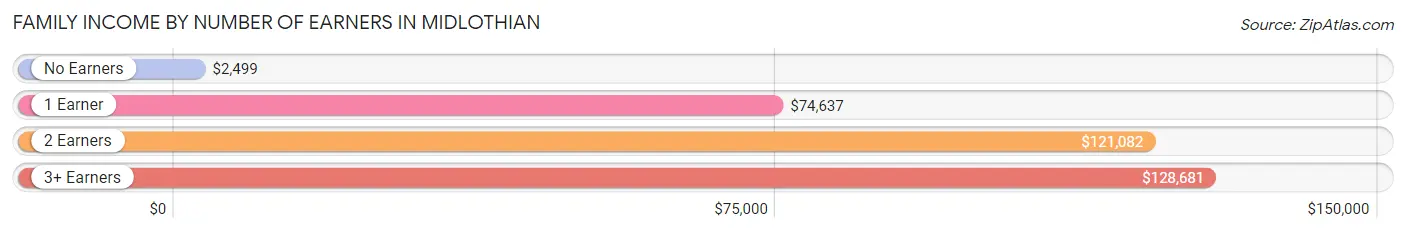
| Number of Earners | # Families | Median Income |
| No Earners | 513 (13.7%) | $2,499 |
| 1 Earner | 1,391 (37.0%) | $74,637 |
| 2 Earners | 1,509 (40.2%) | $121,082 |
| 3+ Earners | 342 (9.1%) | $128,681 |
| Total | 3,755 (100.0%) | $90,703 |
Household Income in Midlothian
Household Income Brackets in Midlothian
With 1,126 households falling in the category, the $100,000 to $149,999 income range is the most frequent in Midlothian, accounting for 19.6% of all households. In contrast, only 126 households (2.2%) fall into the $10,000 to $14,999 income bracket, making it the least populous group.
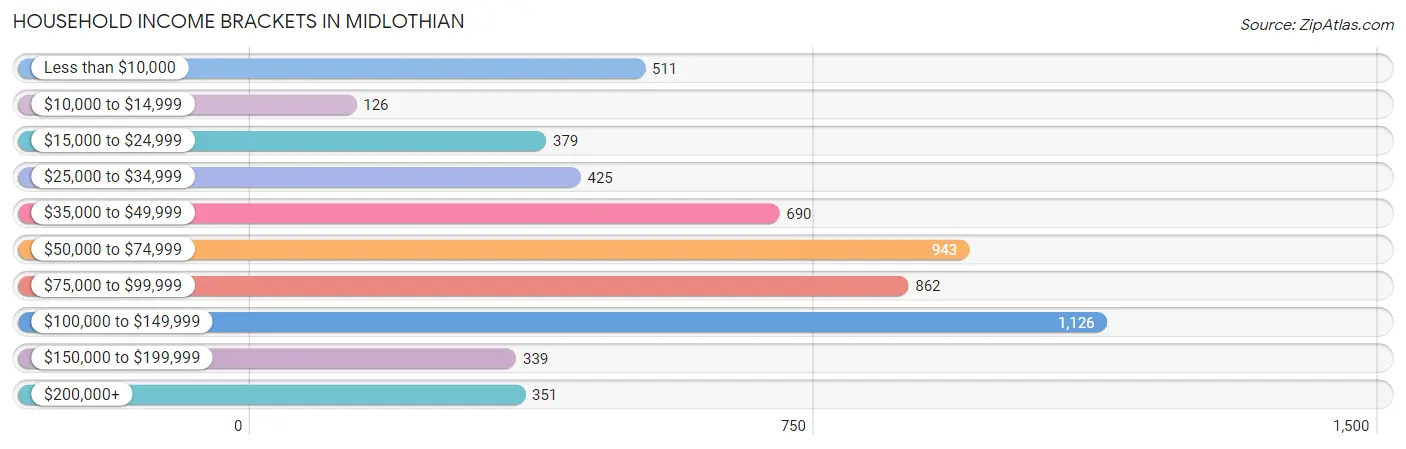
| Income Bracket | # Households | % Households |
| Less than $10,000 | 511 | 8.9% |
| $10,000 to $14,999 | 126 | 2.2% |
| $15,000 to $24,999 | 379 | 6.6% |
| $25,000 to $34,999 | 425 | 7.4% |
| $35,000 to $49,999 | 690 | 12.0% |
| $50,000 to $74,999 | 943 | 16.4% |
| $75,000 to $99,999 | 862 | 15.0% |
| $100,000 to $149,999 | 1,126 | 19.6% |
| $150,000 to $199,999 | 339 | 5.9% |
| $200,000+ | 351 | 6.1% |
Household Income by Householder Age in Midlothian
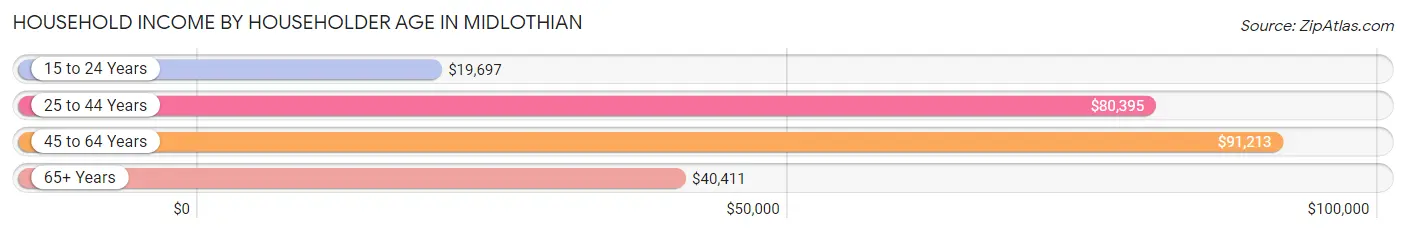
The median household income in Midlothian is $66,994, with the highest median household income of $91,213 found in the 45 to 64 years age bracket for the primary householder. A total of 2,231 households (38.8%) fall into this category. Meanwhile, the 15 to 24 years age bracket for the primary householder has the lowest median household income of $19,697, with 156 households (2.7%) in this group.
| Income Bracket | # Households | Median Income |
| 15 to 24 Years | 156 (2.7%) | $19,697 |
| 25 to 44 Years | 1,880 (32.7%) | $80,395 |
| 45 to 64 Years | 2,231 (38.8%) | $91,213 |
| 65+ Years | 1,480 (25.8%) | $40,411 |
| Total | 5,747 (100.0%) | $66,994 |
Poverty in Midlothian
Income Below Poverty by Sex and Age in Midlothian
With 8.4% poverty level for males and 13.3% for females among the residents of Midlothian, 65 to 74 year old males and 12 to 14 year old females are the most vulnerable to poverty, with 197 males (24.9%) and 157 females (35.0%) in their respective age groups living below the poverty level.
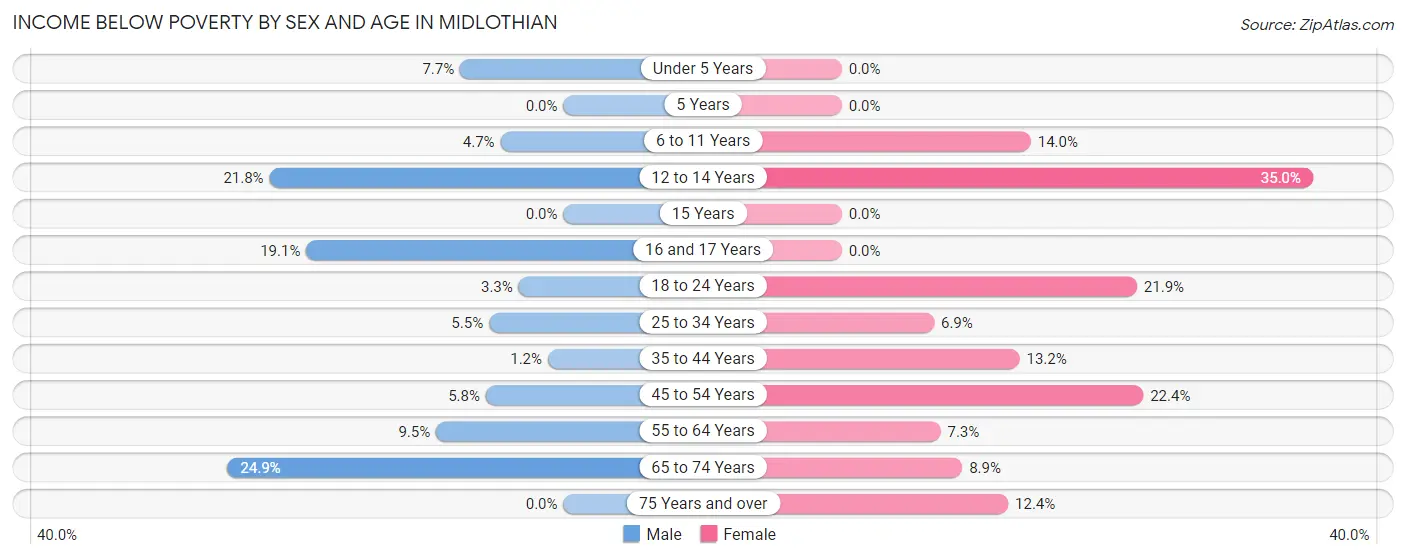
| Age Bracket | Male | Female |
| Under 5 Years | 29 (7.7%) | 0 (0.0%) |
| 5 Years | 0 (0.0%) | 0 (0.0%) |
| 6 to 11 Years | 29 (4.7%) | 78 (14.0%) |
| 12 to 14 Years | 72 (21.8%) | 157 (35.0%) |
| 15 Years | 0 (0.0%) | 0 (0.0%) |
| 16 and 17 Years | 42 (19.1%) | 0 (0.0%) |
| 18 to 24 Years | 13 (3.3%) | 126 (21.9%) |
| 25 to 34 Years | 43 (5.5%) | 74 (6.9%) |
| 35 to 44 Years | 12 (1.1%) | 130 (13.2%) |
| 45 to 54 Years | 56 (5.8%) | 186 (22.4%) |
| 55 to 64 Years | 100 (9.5%) | 68 (7.3%) |
| 65 to 74 Years | 197 (24.9%) | 54 (8.9%) |
| 75 Years and over | 0 (0.0%) | 60 (12.3%) |
| Total | 593 (8.4%) | 933 (13.3%) |
Income Above Poverty by Sex and Age in Midlothian
According to the poverty statistics in Midlothian, males aged 5 years and females aged under 5 years are the age groups that are most secure financially, with 100.0% of males and 100.0% of females in these age groups living above the poverty line.
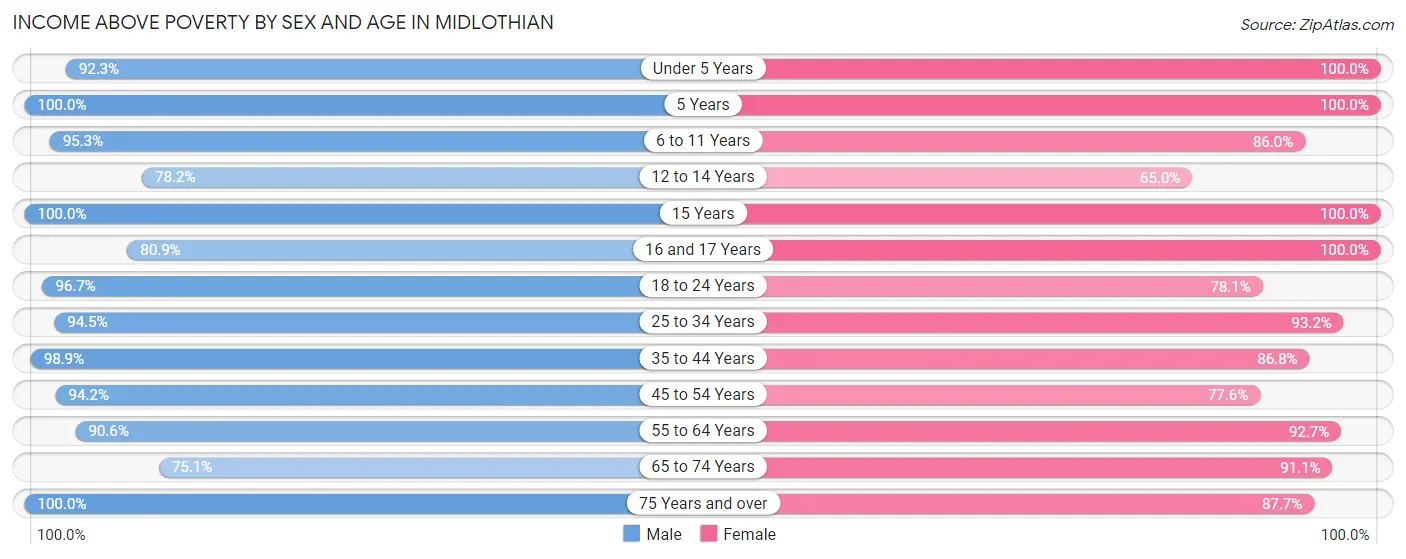
| Age Bracket | Male | Female |
| Under 5 Years | 349 (92.3%) | 322 (100.0%) |
| 5 Years | 66 (100.0%) | 23 (100.0%) |
| 6 to 11 Years | 592 (95.3%) | 478 (86.0%) |
| 12 to 14 Years | 258 (78.2%) | 292 (65.0%) |
| 15 Years | 111 (100.0%) | 84 (100.0%) |
| 16 and 17 Years | 178 (80.9%) | 93 (100.0%) |
| 18 to 24 Years | 379 (96.7%) | 449 (78.1%) |
| 25 to 34 Years | 736 (94.5%) | 1,007 (93.1%) |
| 35 to 44 Years | 1,035 (98.9%) | 855 (86.8%) |
| 45 to 54 Years | 917 (94.2%) | 645 (77.6%) |
| 55 to 64 Years | 958 (90.5%) | 860 (92.7%) |
| 65 to 74 Years | 593 (75.1%) | 550 (91.1%) |
| 75 Years and over | 257 (100.0%) | 426 (87.6%) |
| Total | 6,429 (91.6%) | 6,084 (86.7%) |
Income Below Poverty Among Married-Couple Families in Midlothian
The poverty statistics for married-couple families in Midlothian show that 8.4% or 237 of the total 2,839 families live below the poverty line. Families with no children have the highest poverty rate of 12.4%, comprising of 209 families. On the other hand, families with 3 or 4 children have the lowest poverty rate of 0.0%, which includes 0 families.
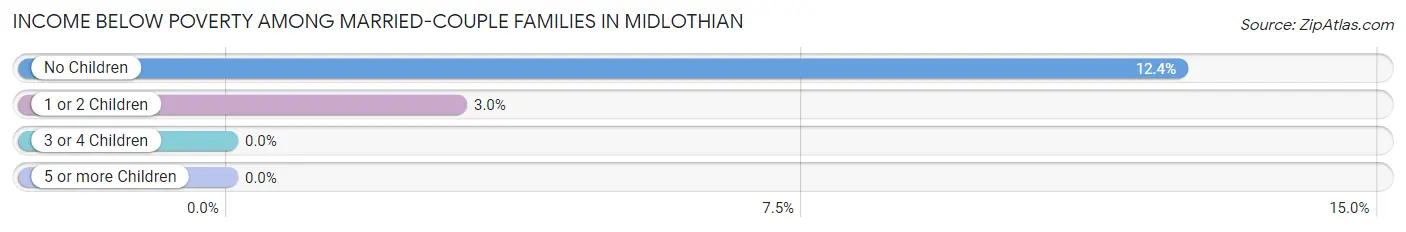
| Children | Above Poverty | Below Poverty |
| No Children | 1,476 (87.6%) | 209 (12.4%) |
| 1 or 2 Children | 909 (97.0%) | 28 (3.0%) |
| 3 or 4 Children | 217 (100.0%) | 0 (0.0%) |
| 5 or more Children | 0 (0.0%) | 0 (0.0%) |
| Total | 2,602 (91.6%) | 237 (8.4%) |
Income Below Poverty Among Single-Parent Households in Midlothian
According to the poverty data in Midlothian, 11.4% or 38 single-father households and 30.8% or 179 single-mother households are living below the poverty line. Among single-father households, those with 1 or 2 children have the highest poverty rate, with 27 households (19.7%) experiencing poverty. Likewise, among single-mother households, those with 3 or 4 children have the highest poverty rate, with 32 households (84.2%) falling below the poverty line.
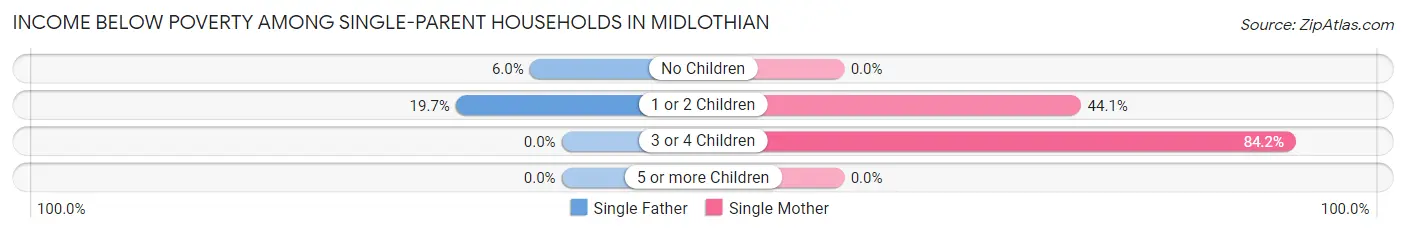
| Children | Single Father | Single Mother |
| No Children | 11 (5.9%) | 0 (0.0%) |
| 1 or 2 Children | 27 (19.7%) | 147 (44.1%) |
| 3 or 4 Children | 0 (0.0%) | 32 (84.2%) |
| 5 or more Children | 0 (0.0%) | 0 (0.0%) |
| Total | 38 (11.4%) | 179 (30.8%) |
Income Below Poverty Among Married-Couple vs Single-Parent Households in Midlothian
The poverty data for Midlothian shows that 237 of the married-couple family households (8.4%) and 217 of the single-parent households (23.7%) are living below the poverty level. Within the married-couple family households, those with no children have the highest poverty rate, with 209 households (12.4%) falling below the poverty line. Among the single-parent households, those with 3 or 4 children have the highest poverty rate, with 32 household (64.0%) living below poverty.
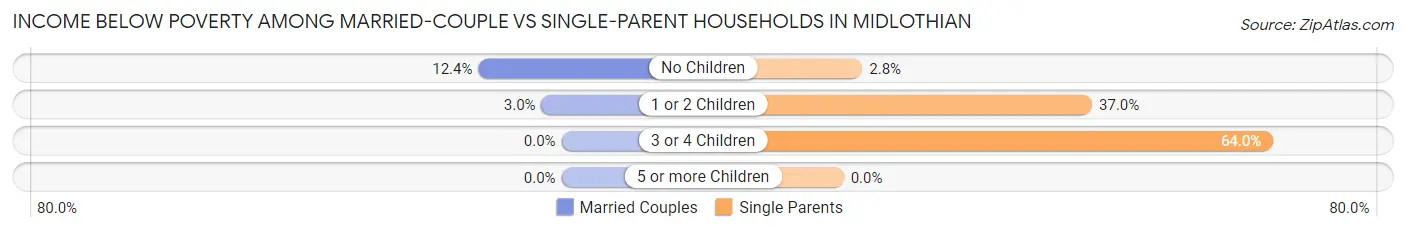
| Children | Married-Couple Families | Single-Parent Households |
| No Children | 209 (12.4%) | 11 (2.8%) |
| 1 or 2 Children | 28 (3.0%) | 174 (37.0%) |
| 3 or 4 Children | 0 (0.0%) | 32 (64.0%) |
| 5 or more Children | 0 (0.0%) | 0 (0.0%) |
| Total | 237 (8.4%) | 217 (23.7%) |
Race in Midlothian
The most populous races in Midlothian are White / Caucasian (8,659 | 61.0%), Hispanic or Latino (4,808 | 33.9%), and Two or more Races (1,731 | 12.2%).
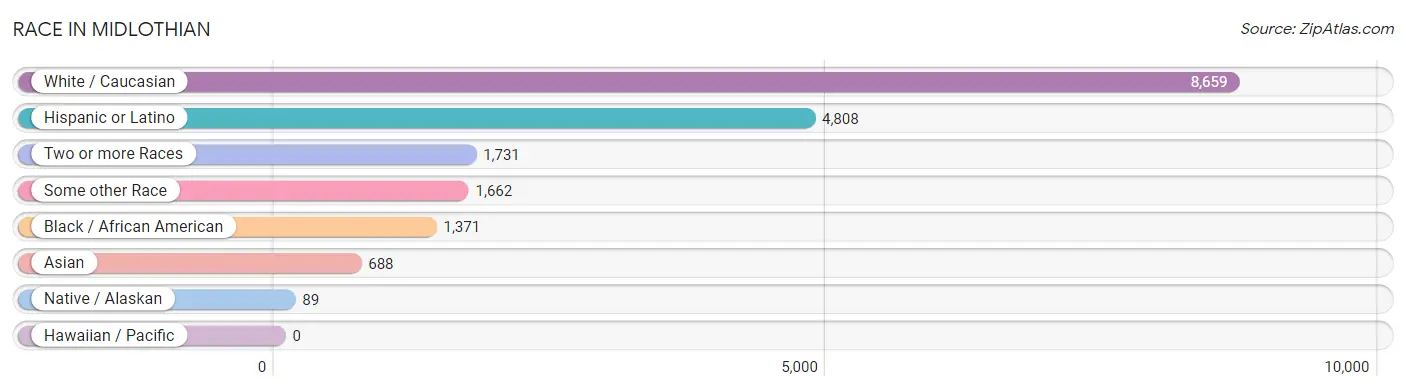
| Race | # Population | % Population |
| Asian | 688 | 4.9% |
| Black / African American | 1,371 | 9.7% |
| Hawaiian / Pacific | 0 | 0.0% |
| Hispanic or Latino | 4,808 | 33.9% |
| Native / Alaskan | 89 | 0.6% |
| White / Caucasian | 8,659 | 61.0% |
| Two or more Races | 1,731 | 12.2% |
| Some other Race | 1,662 | 11.7% |
| Total | 14,200 | 100.0% |
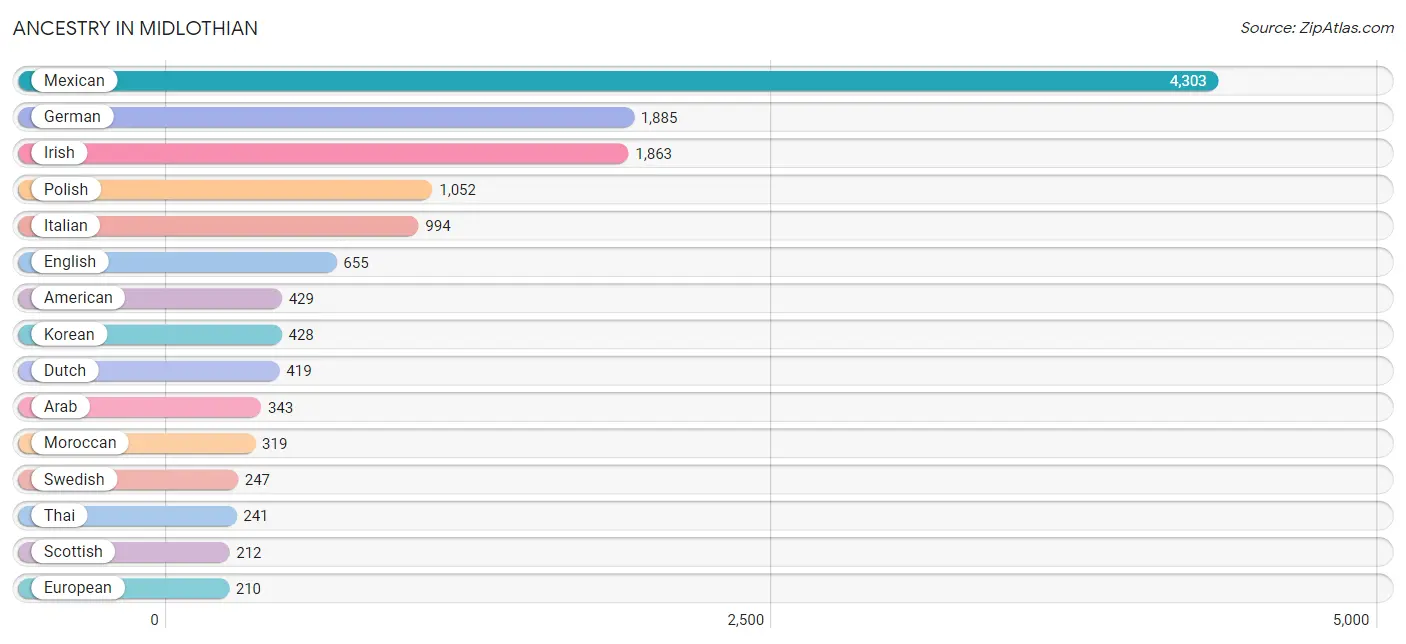
Ancestry in Midlothian
The most populous ancestries reported in Midlothian are Mexican (4,303 | 30.3%), German (1,885 | 13.3%), Irish (1,863 | 13.1%), Polish (1,052 | 7.4%), and Italian (994 | 7.0%), together accounting for 71.1% of all Midlothian residents.
| Ancestry | # Population | % Population |
| African | 34 | 0.2% |
| American | 429 | 3.0% |
| Arab | 343 | 2.4% |
| Argentinean | 22 | 0.2% |
| Austrian | 117 | 0.8% |
| Belgian | 8 | 0.1% |
| Belizean | 31 | 0.2% |
| British | 6 | 0.0% |
| Cambodian | 9 | 0.1% |
| Central American | 9 | 0.1% |
| Central American Indian | 30 | 0.2% |
| Cherokee | 11 | 0.1% |
| Croatian | 30 | 0.2% |
| Cuban | 73 | 0.5% |
| Czech | 35 | 0.3% |
| Czechoslovakian | 16 | 0.1% |
| Danish | 8 | 0.1% |
| Dutch | 419 | 2.9% |
| Eastern European | 23 | 0.2% |
| Ecuadorian | 81 | 0.6% |
| Egyptian | 6 | 0.0% |
| English | 655 | 4.6% |
| European | 210 | 1.5% |
| French | 102 | 0.7% |
| French Canadian | 19 | 0.1% |
| German | 1,885 | 13.3% |
| Greek | 105 | 0.7% |
| Guatemalan | 9 | 0.1% |
| Hungarian | 8 | 0.1% |
| Indian (Asian) | 41 | 0.3% |
| Irish | 1,863 | 13.1% |
| Iroquois | 6 | 0.0% |
| Israeli | 6 | 0.0% |
| Italian | 994 | 7.0% |
| Jamaican | 27 | 0.2% |
| Jordanian | 18 | 0.1% |
| Korean | 428 | 3.0% |
| Lithuanian | 66 | 0.5% |
| Luxembourger | 13 | 0.1% |
| Mexican | 4,303 | 30.3% |
| Mexican American Indian | 76 | 0.5% |
| Moroccan | 319 | 2.2% |
| Nigerian | 20 | 0.1% |
| Norwegian | 31 | 0.2% |
| Palestinian | 6 | 0.0% |
| Polish | 1,052 | 7.4% |
| Puerto Rican | 60 | 0.4% |
| Romanian | 12 | 0.1% |
| Russian | 55 | 0.4% |
| Scotch-Irish | 59 | 0.4% |
| Scottish | 212 | 1.5% |
| Sioux | 1 | 0.0% |
| Slovak | 34 | 0.2% |
| Slovene | 15 | 0.1% |
| South American | 125 | 0.9% |
| Spaniard | 14 | 0.1% |
| Spanish | 122 | 0.9% |
| Subsaharan African | 54 | 0.4% |
| Swedish | 247 | 1.7% |
| Thai | 241 | 1.7% |
| Ukrainian | 6 | 0.0% |
| Uruguayan | 21 | 0.2% |
| Venezuelan | 1 | 0.0% |
| Welsh | 68 | 0.5% | View All 64 Rows |
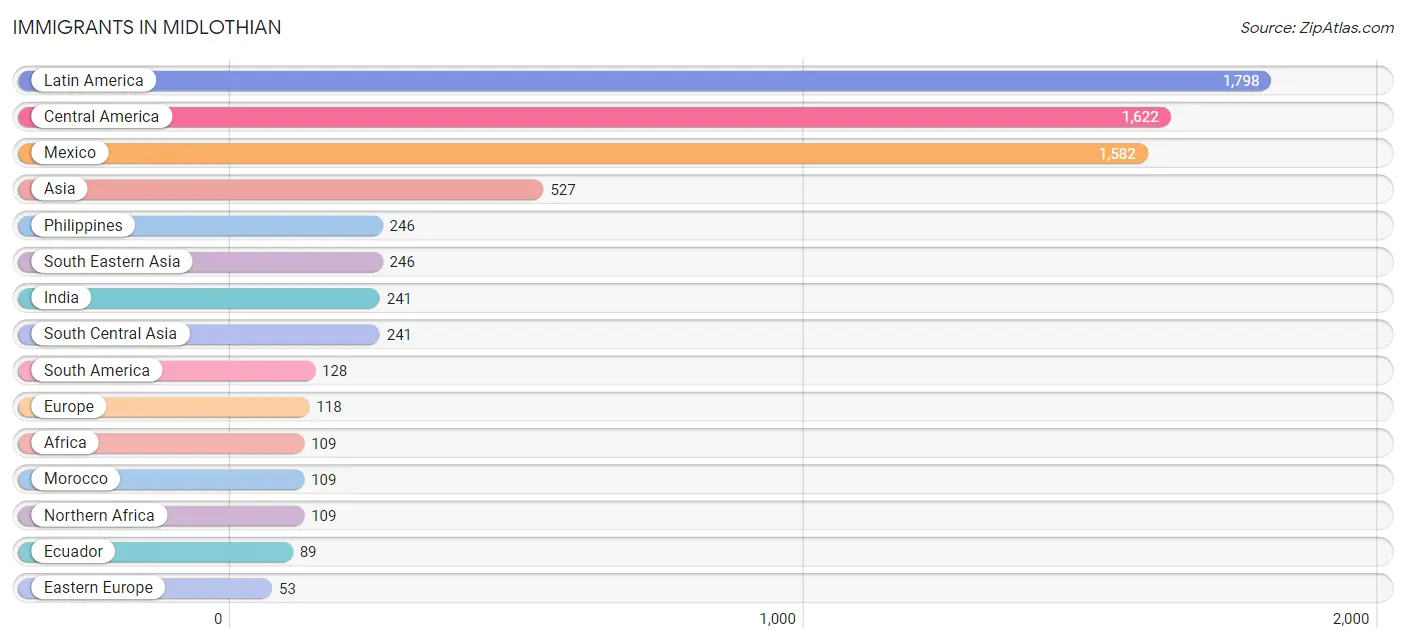
Immigrants in Midlothian
The most numerous immigrant groups reported in Midlothian came from Latin America (1,798 | 12.7%), Central America (1,622 | 11.4%), Mexico (1,582 | 11.1%), Asia (527 | 3.7%), and Philippines (246 | 1.7%), together accounting for 40.7% of all Midlothian residents.
| Immigration Origin | # Population | % Population |
| Africa | 109 | 0.8% |
| Asia | 527 | 3.7% |
| Bahamas | 21 | 0.2% |
| Belize | 31 | 0.2% |
| Brazil | 17 | 0.1% |
| Caribbean | 48 | 0.3% |
| Central America | 1,622 | 11.4% |
| China | 13 | 0.1% |
| Eastern Asia | 22 | 0.2% |
| Eastern Europe | 53 | 0.4% |
| Ecuador | 89 | 0.6% |
| England | 22 | 0.2% |
| Europe | 118 | 0.8% |
| Germany | 12 | 0.1% |
| Greece | 17 | 0.1% |
| Guatemala | 9 | 0.1% |
| India | 241 | 1.7% |
| Jamaica | 27 | 0.2% |
| Latin America | 1,798 | 12.7% |
| Mexico | 1,582 | 11.1% |
| Morocco | 109 | 0.8% |
| Northern Africa | 109 | 0.8% |
| Northern Europe | 22 | 0.2% |
| Philippines | 246 | 1.7% |
| Poland | 34 | 0.2% |
| Russia | 4 | 0.0% |
| South America | 128 | 0.9% |
| South Central Asia | 241 | 1.7% |
| South Eastern Asia | 246 | 1.7% |
| Southern Europe | 31 | 0.2% |
| Spain | 14 | 0.1% |
| Uruguay | 21 | 0.2% |
| Venezuela | 1 | 0.0% |
| Western Asia | 18 | 0.1% |
| Western Europe | 12 | 0.1% | View All 35 Rows |
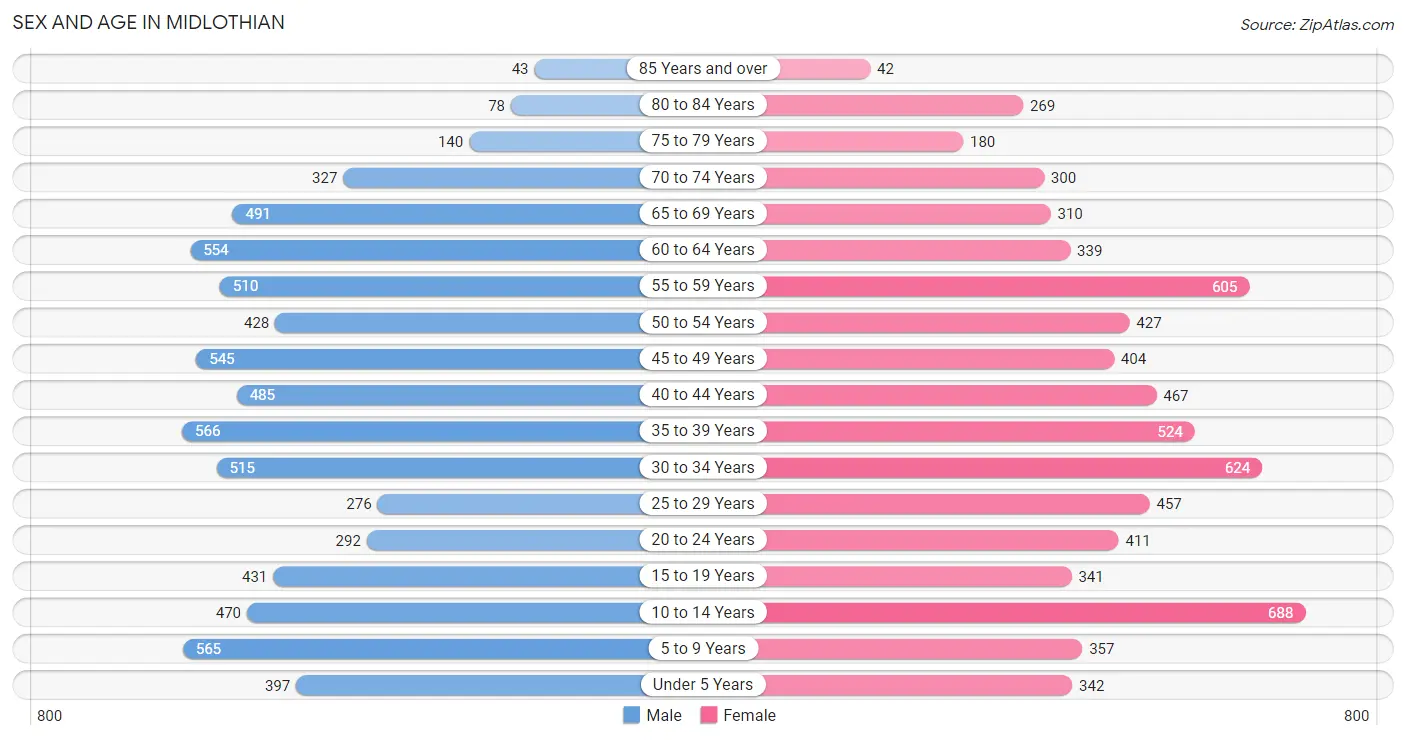
Sex and Age in Midlothian
Sex and Age in Midlothian
The most populous age groups in Midlothian are 35 to 39 Years (566 | 8.0%) for men and 10 to 14 Years (688 | 9.7%) for women.
| Age Bracket | Male | Female |
| Under 5 Years | 397 (5.6%) | 342 (4.8%) |
| 5 to 9 Years | 565 (7.9%) | 357 (5.0%) |
| 10 to 14 Years | 470 (6.6%) | 688 (9.7%) |
| 15 to 19 Years | 431 (6.1%) | 341 (4.8%) |
| 20 to 24 Years | 292 (4.1%) | 411 (5.8%) |
| 25 to 29 Years | 276 (3.9%) | 457 (6.5%) |
| 30 to 34 Years | 515 (7.2%) | 624 (8.8%) |
| 35 to 39 Years | 566 (8.0%) | 524 (7.4%) |
| 40 to 44 Years | 485 (6.8%) | 467 (6.6%) |
| 45 to 49 Years | 545 (7.7%) | 404 (5.7%) |
| 50 to 54 Years | 428 (6.0%) | 427 (6.0%) |
| 55 to 59 Years | 510 (7.2%) | 605 (8.5%) |
| 60 to 64 Years | 554 (7.8%) | 339 (4.8%) |
| 65 to 69 Years | 491 (6.9%) | 310 (4.4%) |
| 70 to 74 Years | 327 (4.6%) | 300 (4.2%) |
| 75 to 79 Years | 140 (2.0%) | 180 (2.5%) |
| 80 to 84 Years | 78 (1.1%) | 269 (3.8%) |
| 85 Years and over | 43 (0.6%) | 42 (0.6%) |
| Total | 7,113 (100.0%) | 7,087 (100.0%) |
Families and Households in Midlothian
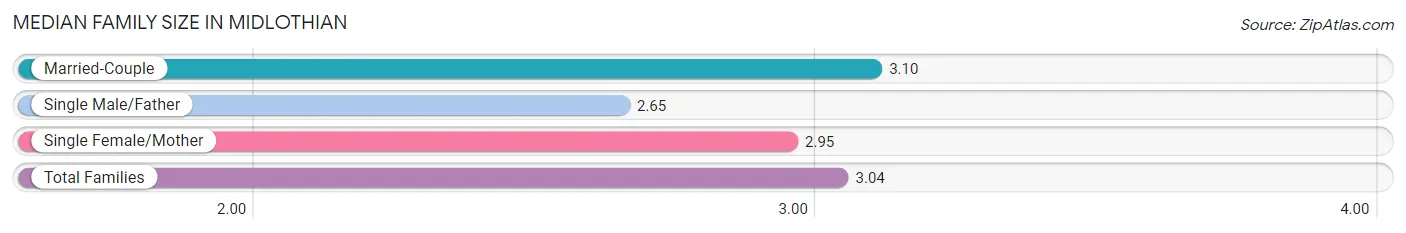
Median Family Size in Midlothian
The median family size in Midlothian is 3.04 persons per family, with married-couple families (2,839 | 75.6%) accounting for the largest median family size of 3.1 persons per family. On the other hand, single male/father families (334 | 8.9%) represent the smallest median family size with 2.65 persons per family.
| Family Type | # Families | Family Size |
| Married-Couple | 2,839 (75.6%) | 3.10 |
| Single Male/Father | 334 (8.9%) | 2.65 |
| Single Female/Mother | 582 (15.5%) | 2.95 |
| Total Families | 3,755 (100.0%) | 3.04 |
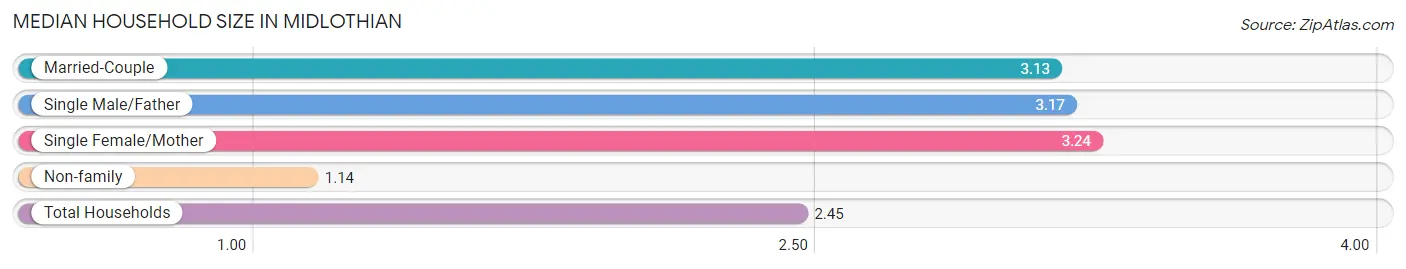
Median Household Size in Midlothian
The median household size in Midlothian is 2.45 persons per household, with single female/mother households (582 | 10.1%) accounting for the largest median household size of 3.24 persons per household. non-family households (1,992 | 34.7%) represent the smallest median household size with 1.14 persons per household.
| Household Type | # Households | Household Size |
| Married-Couple | 2,839 (49.4%) | 3.13 |
| Single Male/Father | 334 (5.8%) | 3.17 |
| Single Female/Mother | 582 (10.1%) | 3.24 |
| Non-family | 1,992 (34.7%) | 1.14 |
| Total Households | 5,747 (100.0%) | 2.45 |
Household Size by Marriage Status in Midlothian
Out of a total of 5,747 households in Midlothian, 3,755 (65.3%) are family households, while 1,992 (34.7%) are nonfamily households. The most numerous type of family households are 2-person households, comprising 1,631, and the most common type of nonfamily households are 1-person households, comprising 1,731.
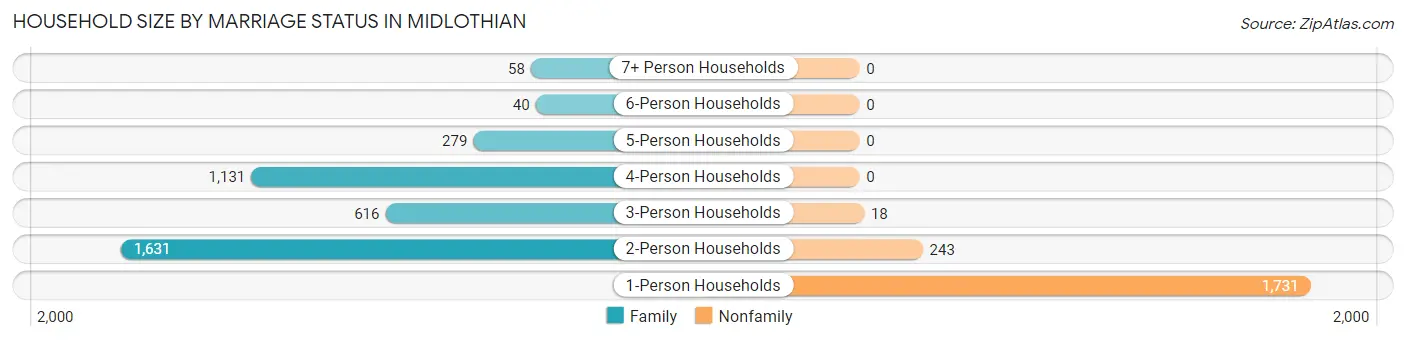
| Household Size | Family Households | Nonfamily Households |
| 1-Person Households | - | 1,731 (30.1%) |
| 2-Person Households | 1,631 (28.4%) | 243 (4.2%) |
| 3-Person Households | 616 (10.7%) | 18 (0.3%) |
| 4-Person Households | 1,131 (19.7%) | 0 (0.0%) |
| 5-Person Households | 279 (4.9%) | 0 (0.0%) |
| 6-Person Households | 40 (0.7%) | 0 (0.0%) |
| 7+ Person Households | 58 (1.0%) | 0 (0.0%) |
| Total | 3,755 (65.3%) | 1,992 (34.7%) |
Female Fertility in Midlothian
Fertility by Age in Midlothian
Average fertility rate in Midlothian is 39.0 births per 1,000 women. Women in the age bracket of 20 to 34 years have the highest fertility rate with 75.0 births per 1,000 women. Women in the age bracket of 20 to 34 years acount for 86.8% of all women with births.
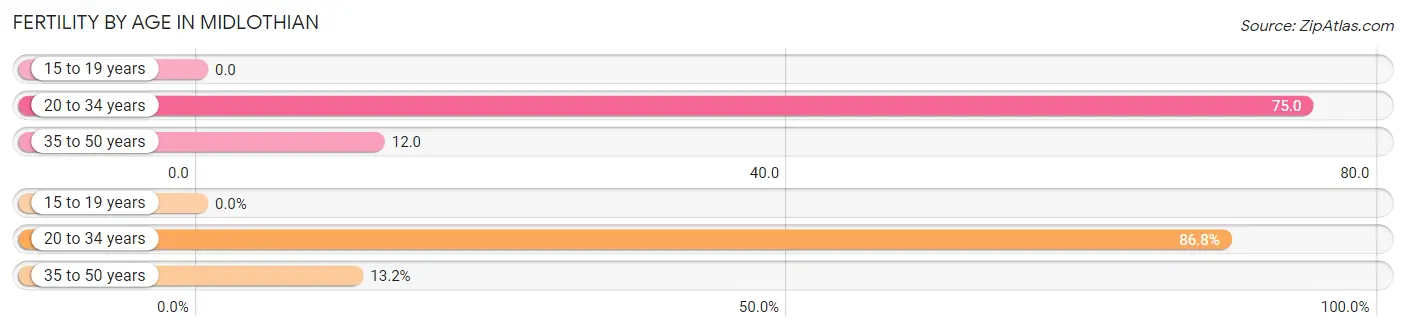
| Age Bracket | Women with Births | Births / 1,000 Women |
| 15 to 19 years | 0 (0.0%) | 0.0 |
| 20 to 34 years | 112 (86.8%) | 75.0 |
| 35 to 50 years | 17 (13.2%) | 12.0 |
| Total | 129 (100.0%) | 39.0 |
Fertility by Age by Marriage Status in Midlothian
44.2% of women with births (129) in Midlothian are married. The highest percentage of unmarried women with births falls into 35 to 50 years age bracket with 100.0% of them unmarried at the time of birth, while the lowest percentage of unmarried women with births belong to 20 to 34 years age bracket with 49.1% of them unmarried.
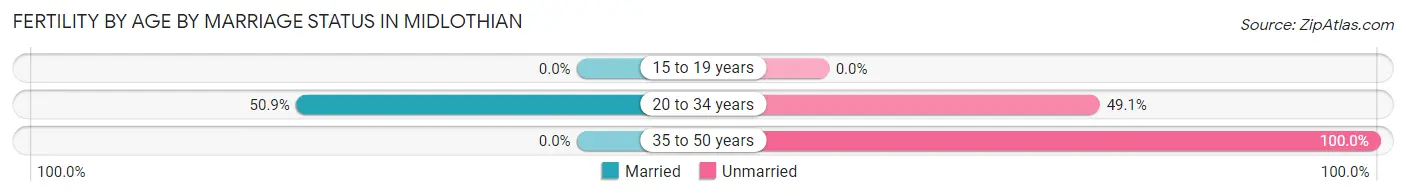
| Age Bracket | Married | Unmarried |
| 15 to 19 years | 0 (0.0%) | 0 (0.0%) |
| 20 to 34 years | 57 (50.9%) | 55 (49.1%) |
| 35 to 50 years | 0 (0.0%) | 17 (100.0%) |
| Total | 57 (44.2%) | 72 (55.8%) |
Fertility by Education in Midlothian
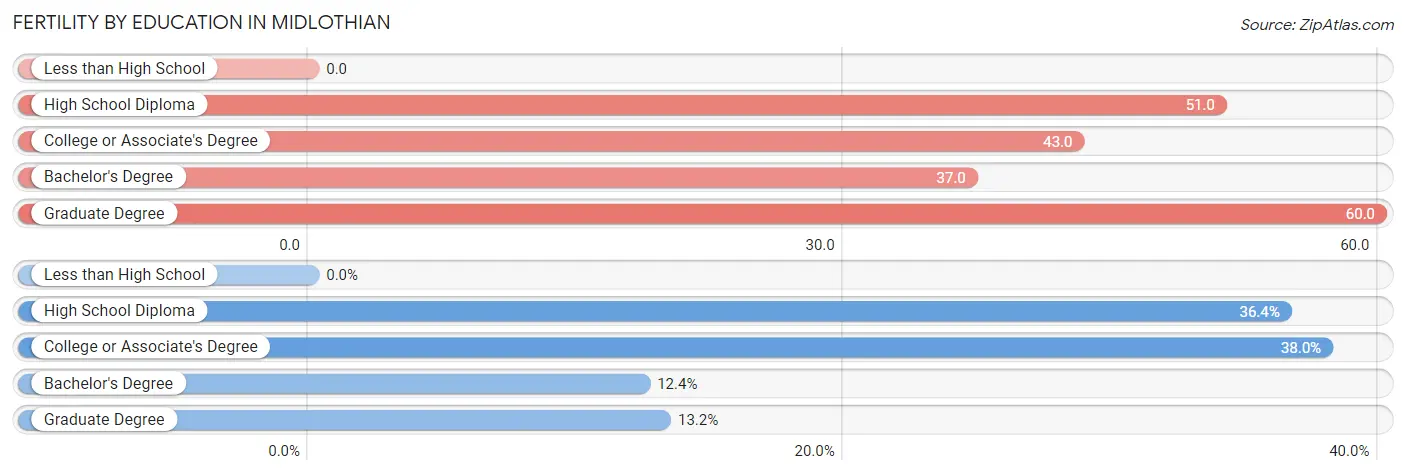
| Educational Attainment | Women with Births | Births / 1,000 Women |
| Less than High School | 0 (0.0%) | 0.0 |
| High School Diploma | 47 (36.4%) | 51.0 |
| College or Associate's Degree | 49 (38.0%) | 43.0 |
| Bachelor's Degree | 16 (12.4%) | 37.0 |
| Graduate Degree | 17 (13.2%) | 60.0 |
| Total | 129 (100.0%) | 39.0 |
Fertility by Education by Marriage Status in Midlothian
55.8% of women with births in Midlothian are unmarried. Women with the educational attainment of bachelor's degree are most likely to be married with 100.0% of them married at childbirth, while women with the educational attainment of high school diploma are least likely to be married with 100.0% of them unmarried at childbirth.
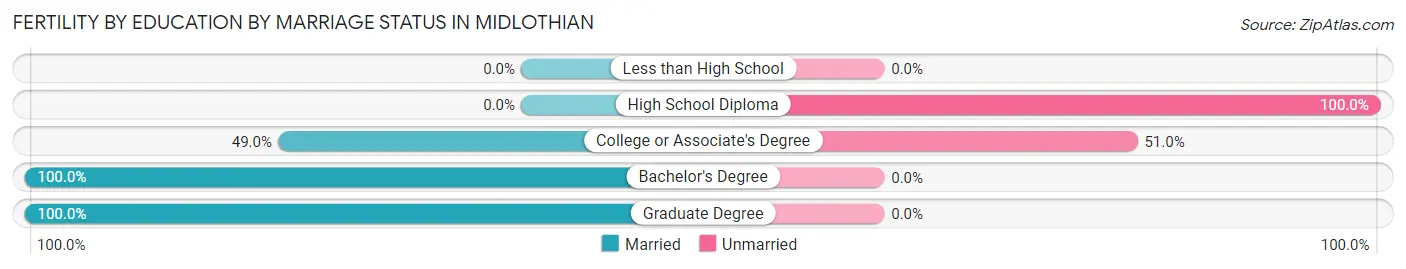
| Educational Attainment | Married | Unmarried |
| Less than High School | 0 (0.0%) | 0 (0.0%) |
| High School Diploma | 0 (0.0%) | 47 (100.0%) |
| College or Associate's Degree | 24 (49.0%) | 25 (51.0%) |
| Bachelor's Degree | 16 (100.0%) | 0 (0.0%) |
| Graduate Degree | 17 (100.0%) | 0 (0.0%) |
| Total | 57 (44.2%) | 72 (55.8%) |
Employment Characteristics in Midlothian
Employment by Class of Employer in Midlothian
Among the 6,513 employed individuals in Midlothian, private company employees (4,580 | 70.3%), local government employees (648 | 10.0%), and not-for-profit organizations (468 | 7.2%) make up the most common classes of employment.
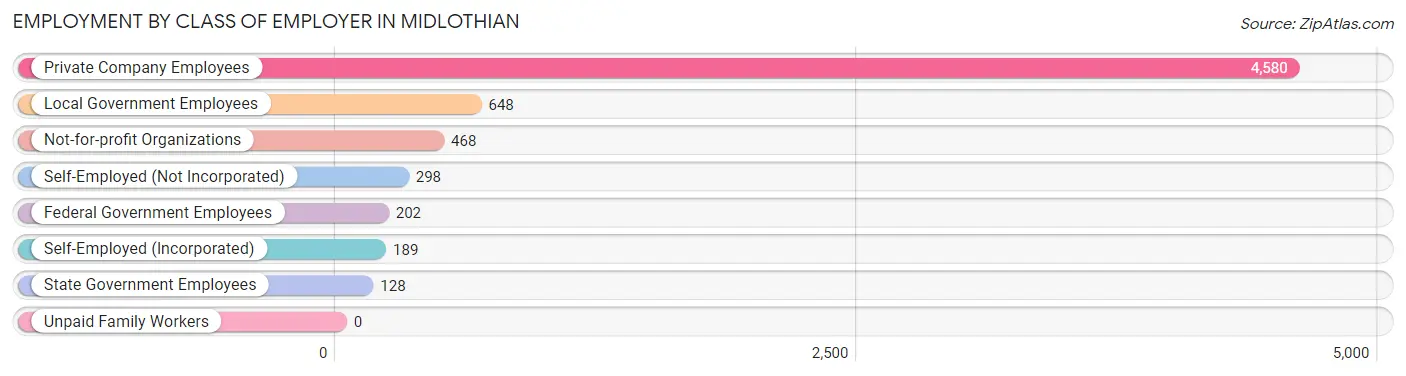
| Employer Class | # Employees | % Employees |
| Private Company Employees | 4,580 | 70.3% |
| Self-Employed (Incorporated) | 189 | 2.9% |
| Self-Employed (Not Incorporated) | 298 | 4.6% |
| Not-for-profit Organizations | 468 | 7.2% |
| Local Government Employees | 648 | 10.0% |
| State Government Employees | 128 | 2.0% |
| Federal Government Employees | 202 | 3.1% |
| Unpaid Family Workers | 0 | 0.0% |
| Total | 6,513 | 100.0% |
Employment Status by Age in Midlothian
According to the labor force statistics for Midlothian, out of the total population over 16 years of age (11,186), 64.0% or 7,159 individuals are in the labor force, with 5.4% or 387 of them unemployed. The age group with the highest labor force participation rate is 55 to 59 years, with 85.6% or 954 individuals in the labor force. Within the labor force, the 16 to 19 years age range has the highest percentage of unemployed individuals, with 26.1% or 42 of them being unemployed.
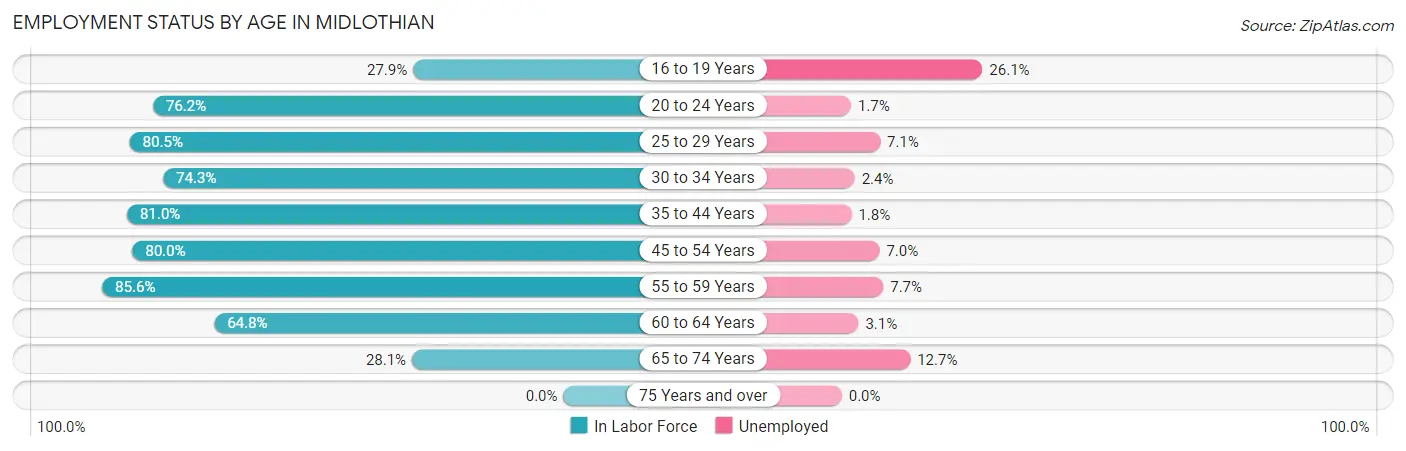
| Age Bracket | In Labor Force | Unemployed |
| 16 to 19 Years | 161 (27.9%) | 42 (26.1%) |
| 20 to 24 Years | 536 (76.2%) | 9 (1.7%) |
| 25 to 29 Years | 590 (80.5%) | 42 (7.1%) |
| 30 to 34 Years | 846 (74.3%) | 20 (2.4%) |
| 35 to 44 Years | 1,654 (81.0%) | 30 (1.8%) |
| 45 to 54 Years | 1,443 (80.0%) | 101 (7.0%) |
| 55 to 59 Years | 954 (85.6%) | 73 (7.7%) |
| 60 to 64 Years | 579 (64.8%) | 18 (3.1%) |
| 65 to 74 Years | 401 (28.1%) | 51 (12.7%) |
| 75 Years and over | 0 (0.0%) | 0 (0.0%) |
| Total | 7,159 (64.0%) | 387 (5.4%) |
Employment Status by Educational Attainment in Midlothian
According to labor force statistics for Midlothian, 78.5% of individuals (6,065) out of the total population between 25 and 64 years of age (7,726) are in the labor force, with 4.7% or 285 of them being unemployed. The group with the highest labor force participation rate are those with the educational attainment of bachelor's degree or higher, with 92.5% or 1,449 individuals in the labor force. Within the labor force, individuals with college / associate degree education have the highest percentage of unemployment, with 8.1% or 190 of them being unemployed.
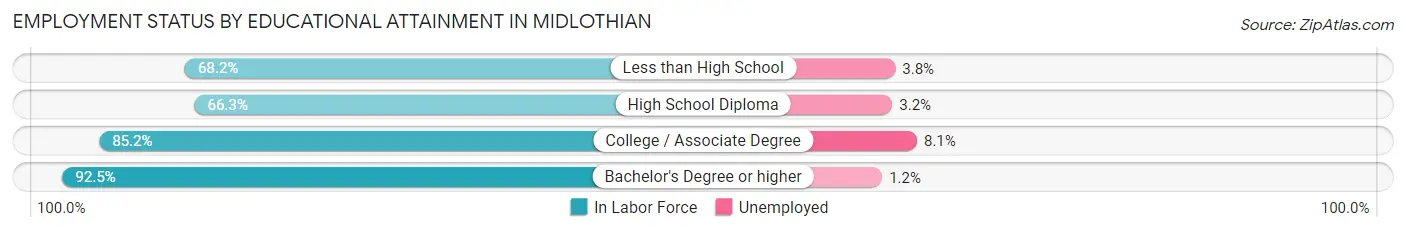
| Educational Attainment | In Labor Force | Unemployed |
| Less than High School | 499 (68.2%) | 28 (3.8%) |
| High School Diploma | 1,777 (66.3%) | 86 (3.2%) |
| College / Associate Degree | 2,340 (85.2%) | 223 (8.1%) |
| Bachelor's Degree or higher | 1,449 (92.5%) | 19 (1.2%) |
| Total | 6,065 (78.5%) | 363 (4.7%) |
Employment Occupations by Sex in Midlothian
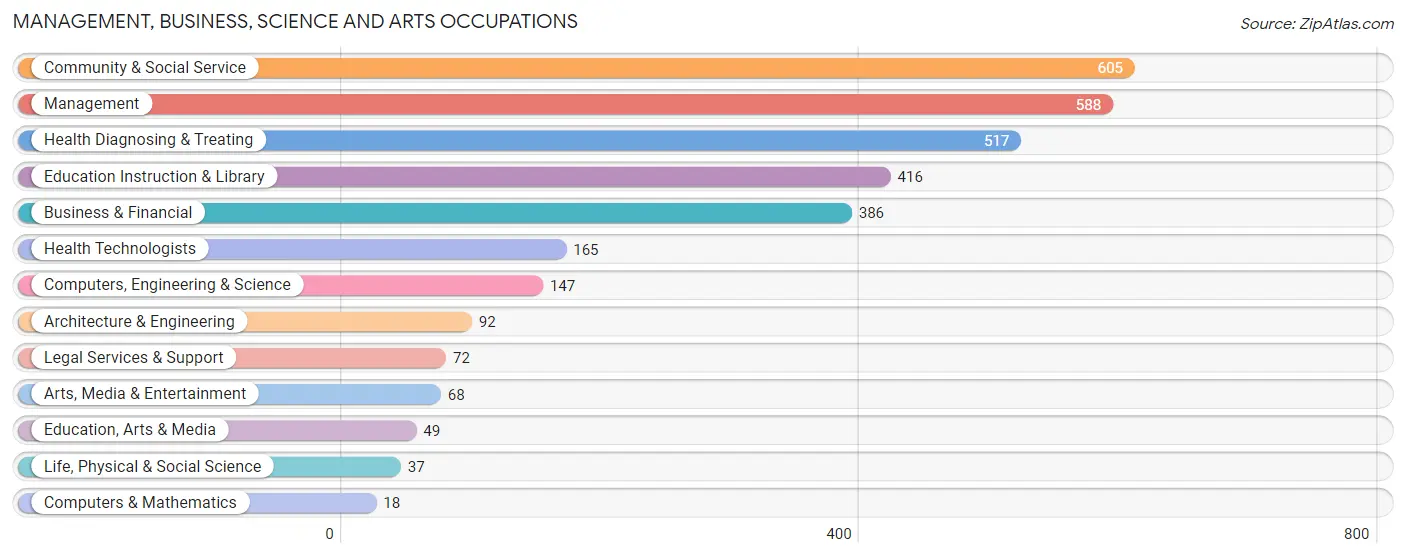
Management, Business, Science and Arts Occupations
The most common Management, Business, Science and Arts occupations in Midlothian are Community & Social Service (605 | 8.9%), Management (588 | 8.7%), Health Diagnosing & Treating (517 | 7.6%), Education Instruction & Library (416 | 6.1%), and Business & Financial (386 | 5.7%).
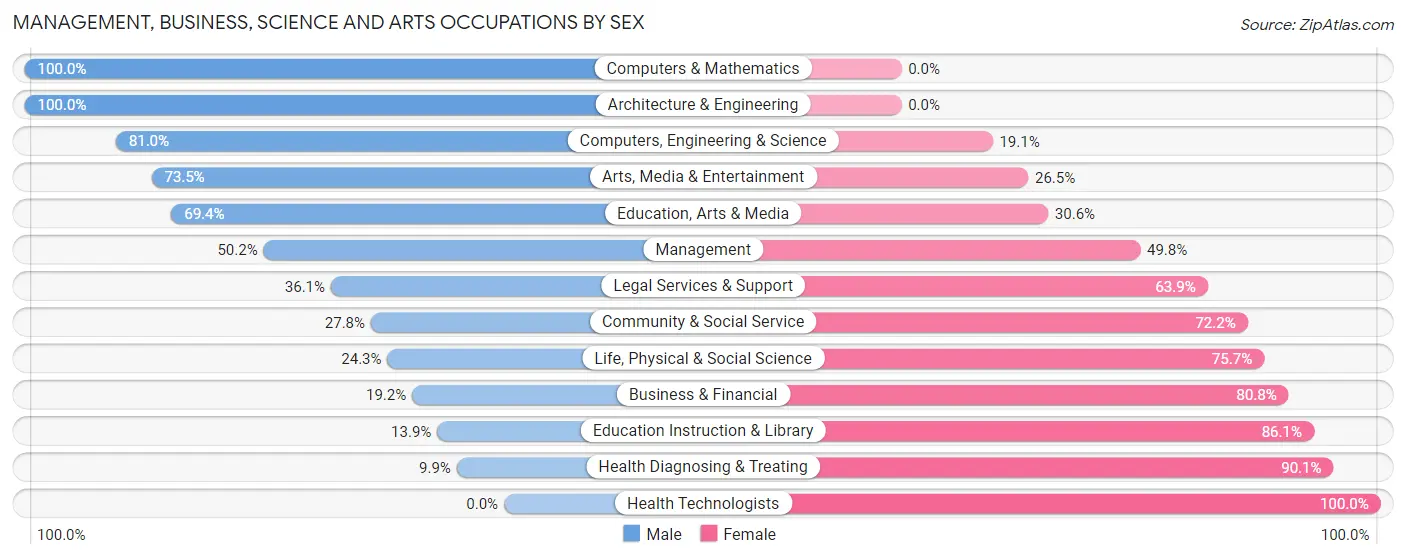
Management, Business, Science and Arts Occupations by Sex
Within the Management, Business, Science and Arts occupations in Midlothian, the most male-oriented occupations are Computers & Mathematics (100.0%), Architecture & Engineering (100.0%), and Computers, Engineering & Science (80.9%), while the most female-oriented occupations are Health Technologists (100.0%), Health Diagnosing & Treating (90.1%), and Education Instruction & Library (86.1%).
| Occupation | Male | Female |
| Management | 295 (50.2%) | 293 (49.8%) |
| Business & Financial | 74 (19.2%) | 312 (80.8%) |
| Computers, Engineering & Science | 119 (80.9%) | 28 (19.1%) |
| Computers & Mathematics | 18 (100.0%) | 0 (0.0%) |
| Architecture & Engineering | 92 (100.0%) | 0 (0.0%) |
| Life, Physical & Social Science | 9 (24.3%) | 28 (75.7%) |
| Community & Social Service | 168 (27.8%) | 437 (72.2%) |
| Education, Arts & Media | 34 (69.4%) | 15 (30.6%) |
| Legal Services & Support | 26 (36.1%) | 46 (63.9%) |
| Education Instruction & Library | 58 (13.9%) | 358 (86.1%) |
| Arts, Media & Entertainment | 50 (73.5%) | 18 (26.5%) |
| Health Diagnosing & Treating | 51 (9.9%) | 466 (90.1%) |
| Health Technologists | 0 (0.0%) | 165 (100.0%) |
| Total (Category) | 707 (31.5%) | 1,536 (68.5%) |
| Total (Overall) | 3,545 (52.3%) | 3,233 (47.7%) |
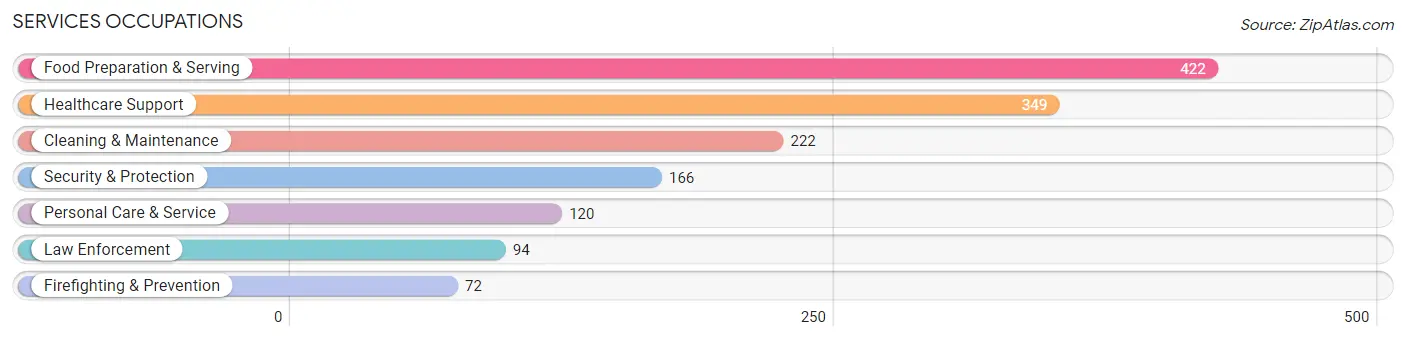
Services Occupations
The most common Services occupations in Midlothian are Food Preparation & Serving (422 | 6.2%), Healthcare Support (349 | 5.1%), Cleaning & Maintenance (222 | 3.3%), Security & Protection (166 | 2.5%), and Personal Care & Service (120 | 1.8%).
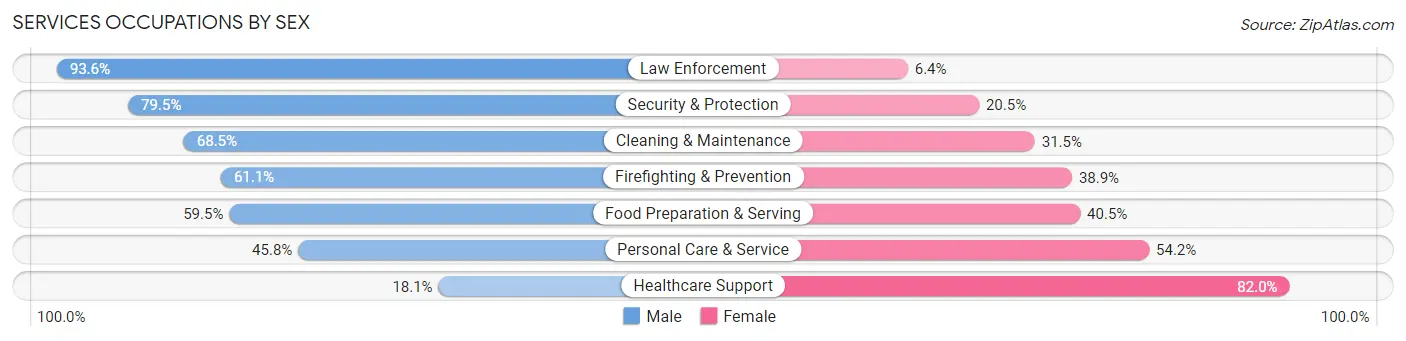
Services Occupations by Sex
Within the Services occupations in Midlothian, the most male-oriented occupations are Law Enforcement (93.6%), Security & Protection (79.5%), and Cleaning & Maintenance (68.5%), while the most female-oriented occupations are Healthcare Support (82.0%), Personal Care & Service (54.2%), and Food Preparation & Serving (40.5%).
| Occupation | Male | Female |
| Healthcare Support | 63 (18.0%) | 286 (82.0%) |
| Security & Protection | 132 (79.5%) | 34 (20.5%) |
| Firefighting & Prevention | 44 (61.1%) | 28 (38.9%) |
| Law Enforcement | 88 (93.6%) | 6 (6.4%) |
| Food Preparation & Serving | 251 (59.5%) | 171 (40.5%) |
| Cleaning & Maintenance | 152 (68.5%) | 70 (31.5%) |
| Personal Care & Service | 55 (45.8%) | 65 (54.2%) |
| Total (Category) | 653 (51.1%) | 626 (48.9%) |
| Total (Overall) | 3,545 (52.3%) | 3,233 (47.7%) |
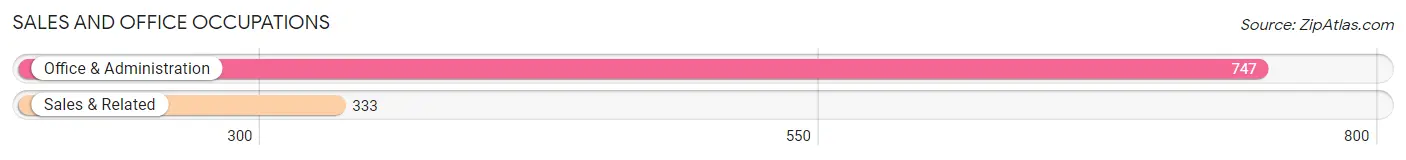
Sales and Office Occupations
The most common Sales and Office occupations in Midlothian are Office & Administration (747 | 11.0%), and Sales & Related (333 | 4.9%).
Sales and Office Occupations by Sex
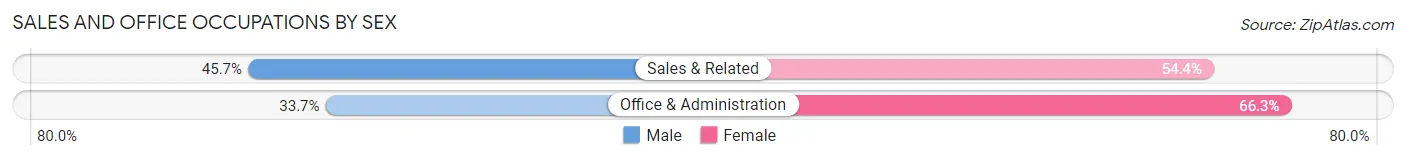
| Occupation | Male | Female |
| Sales & Related | 152 (45.7%) | 181 (54.3%) |
| Office & Administration | 252 (33.7%) | 495 (66.3%) |
| Total (Category) | 404 (37.4%) | 676 (62.6%) |
| Total (Overall) | 3,545 (52.3%) | 3,233 (47.7%) |
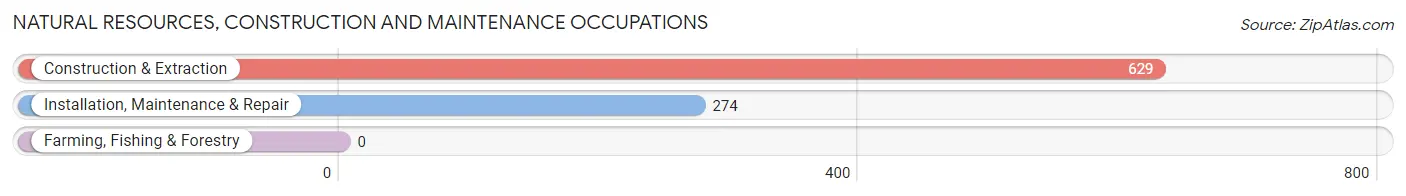
Natural Resources, Construction and Maintenance Occupations
The most common Natural Resources, Construction and Maintenance occupations in Midlothian are Construction & Extraction (629 | 9.3%), and Installation, Maintenance & Repair (274 | 4.0%).
Natural Resources, Construction and Maintenance Occupations by Sex
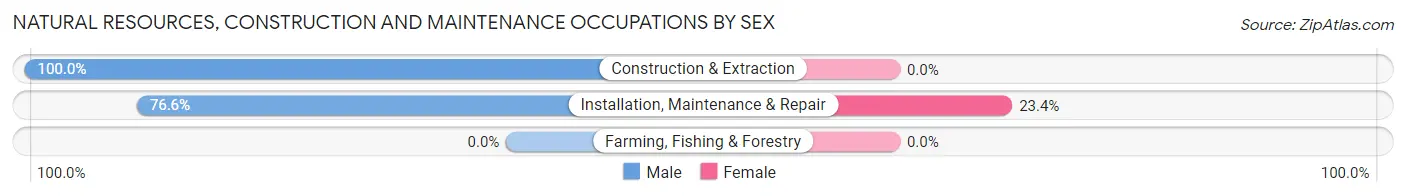
| Occupation | Male | Female |
| Farming, Fishing & Forestry | 0 (0.0%) | 0 (0.0%) |
| Construction & Extraction | 629 (100.0%) | 0 (0.0%) |
| Installation, Maintenance & Repair | 210 (76.6%) | 64 (23.4%) |
| Total (Category) | 839 (92.9%) | 64 (7.1%) |
| Total (Overall) | 3,545 (52.3%) | 3,233 (47.7%) |
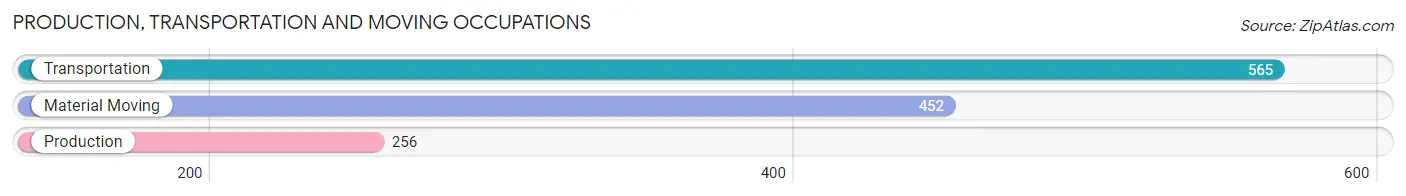
Production, Transportation and Moving Occupations
The most common Production, Transportation and Moving occupations in Midlothian are Transportation (565 | 8.3%), Material Moving (452 | 6.7%), and Production (256 | 3.8%).
Production, Transportation and Moving Occupations by Sex
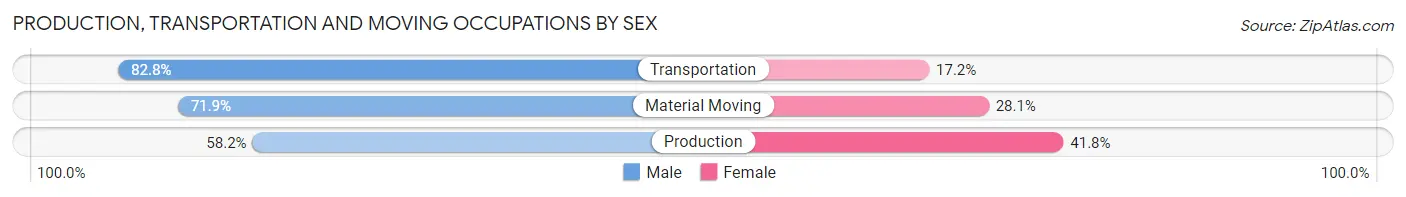
| Occupation | Male | Female |
| Production | 149 (58.2%) | 107 (41.8%) |
| Transportation | 468 (82.8%) | 97 (17.2%) |
| Material Moving | 325 (71.9%) | 127 (28.1%) |
| Total (Category) | 942 (74.0%) | 331 (26.0%) |
| Total (Overall) | 3,545 (52.3%) | 3,233 (47.7%) |
Employment Industries by Sex in Midlothian
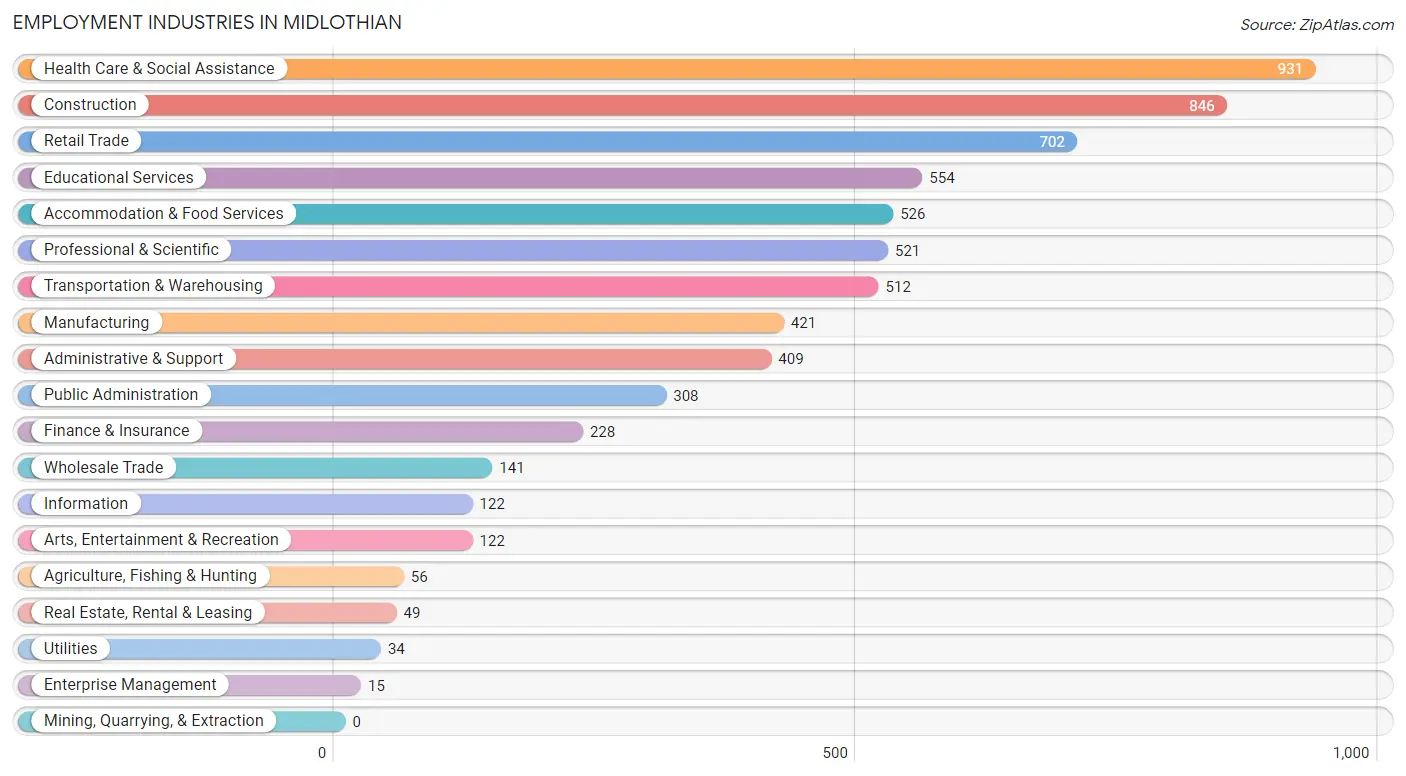
Employment Industries in Midlothian
The major employment industries in Midlothian include Health Care & Social Assistance (931 | 13.7%), Construction (846 | 12.5%), Retail Trade (702 | 10.4%), Educational Services (554 | 8.2%), and Accommodation & Food Services (526 | 7.8%).
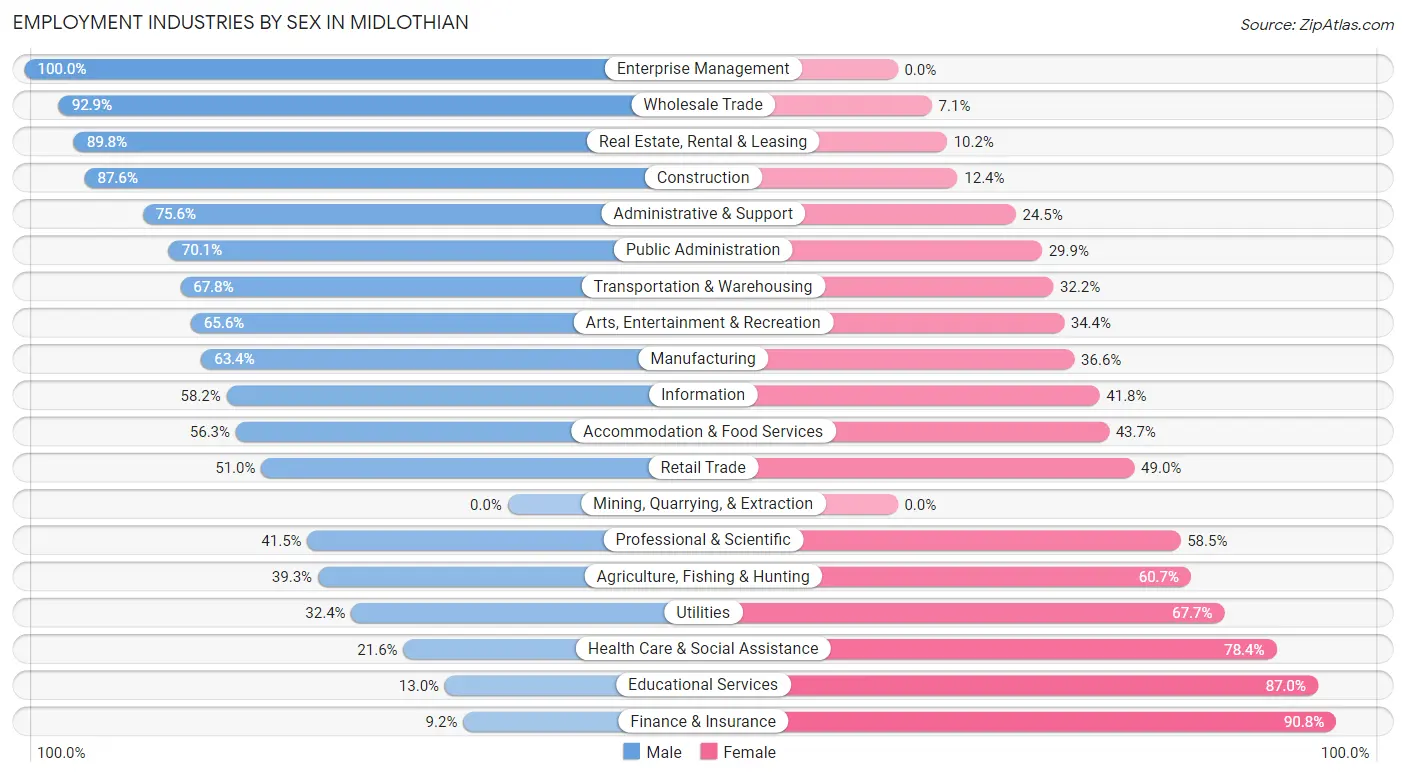
Employment Industries by Sex in Midlothian
The Midlothian industries that see more men than women are Enterprise Management (100.0%), Wholesale Trade (92.9%), and Real Estate, Rental & Leasing (89.8%), whereas the industries that tend to have a higher number of women are Finance & Insurance (90.8%), Educational Services (87.0%), and Health Care & Social Assistance (78.4%).
| Industry | Male | Female |
| Agriculture, Fishing & Hunting | 22 (39.3%) | 34 (60.7%) |
| Mining, Quarrying, & Extraction | 0 (0.0%) | 0 (0.0%) |
| Construction | 741 (87.6%) | 105 (12.4%) |
| Manufacturing | 267 (63.4%) | 154 (36.6%) |
| Wholesale Trade | 131 (92.9%) | 10 (7.1%) |
| Retail Trade | 358 (51.0%) | 344 (49.0%) |
| Transportation & Warehousing | 347 (67.8%) | 165 (32.2%) |
| Utilities | 11 (32.4%) | 23 (67.6%) |
| Information | 71 (58.2%) | 51 (41.8%) |
| Finance & Insurance | 21 (9.2%) | 207 (90.8%) |
| Real Estate, Rental & Leasing | 44 (89.8%) | 5 (10.2%) |
| Professional & Scientific | 216 (41.5%) | 305 (58.5%) |
| Enterprise Management | 15 (100.0%) | 0 (0.0%) |
| Administrative & Support | 309 (75.5%) | 100 (24.4%) |
| Educational Services | 72 (13.0%) | 482 (87.0%) |
| Health Care & Social Assistance | 201 (21.6%) | 730 (78.4%) |
| Arts, Entertainment & Recreation | 80 (65.6%) | 42 (34.4%) |
| Accommodation & Food Services | 296 (56.3%) | 230 (43.7%) |
| Public Administration | 216 (70.1%) | 92 (29.9%) |
| Total | 3,545 (52.3%) | 3,233 (47.7%) |
Education in Midlothian
School Enrollment in Midlothian
The most common levels of schooling among the 3,355 students in Midlothian are middle school (811 | 24.2%), high school (779 | 23.2%), and elementary school (699 | 20.8%).
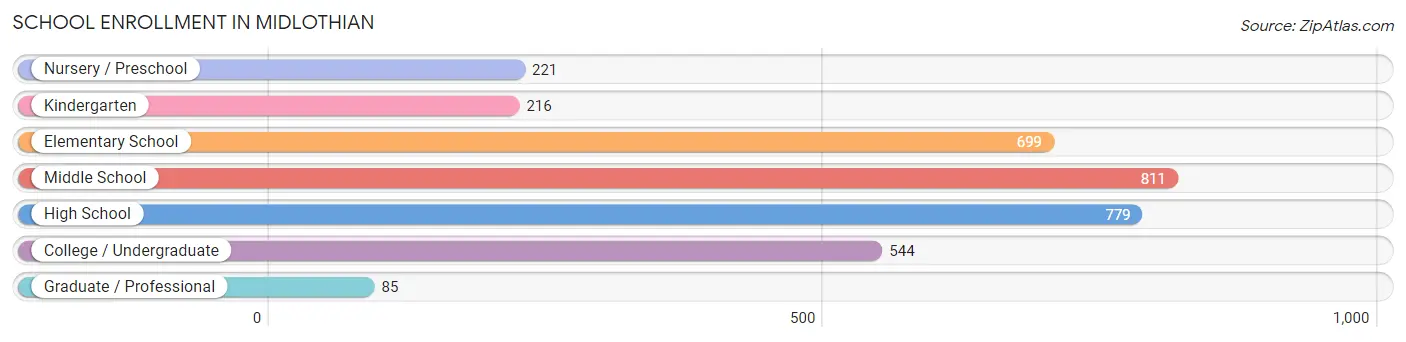
| School Level | # Students | % Students |
| Nursery / Preschool | 221 | 6.6% |
| Kindergarten | 216 | 6.4% |
| Elementary School | 699 | 20.8% |
| Middle School | 811 | 24.2% |
| High School | 779 | 23.2% |
| College / Undergraduate | 544 | 16.2% |
| Graduate / Professional | 85 | 2.5% |
| Total | 3,355 | 100.0% |
School Enrollment by Age by Funding Source in Midlothian
Out of a total of 3,355 students who are enrolled in schools in Midlothian, 587 (17.5%) attend a private institution, while the remaining 2,768 (82.5%) are enrolled in public schools. The age group of 3 to 4 year olds has the highest likelihood of being enrolled in private schools, with 140 (70.0% in the age bracket) enrolled. Conversely, the age group of 15 to 17 year olds has the lowest likelihood of being enrolled in a private school, with 478 (96.2% in the age bracket) attending a public institution.
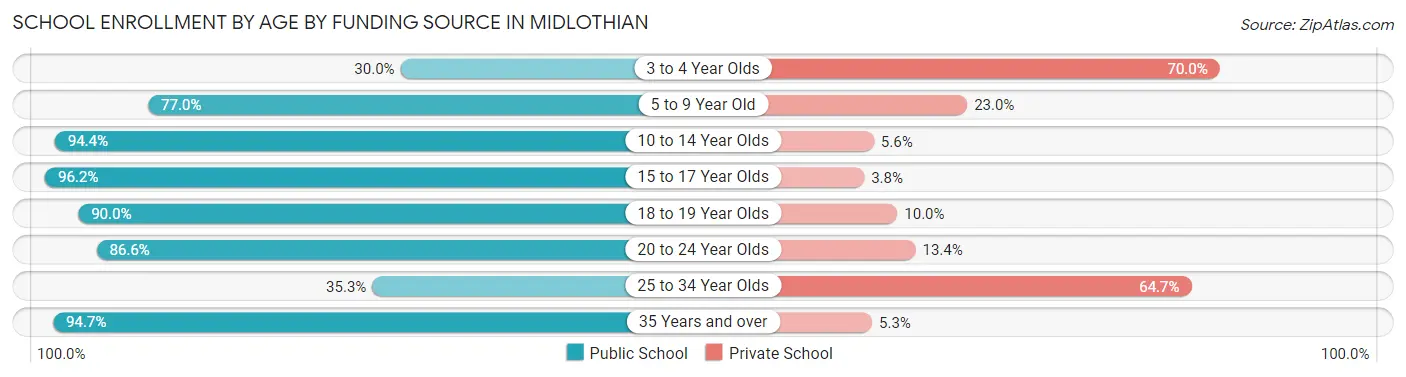
| Age Bracket | Public School | Private School |
| 3 to 4 Year Olds | 60 (30.0%) | 140 (70.0%) |
| 5 to 9 Year Old | 676 (77.0%) | 202 (23.0%) |
| 10 to 14 Year Olds | 1,022 (94.4%) | 61 (5.6%) |
| 15 to 17 Year Olds | 478 (96.2%) | 19 (3.8%) |
| 18 to 19 Year Olds | 117 (90.0%) | 13 (10.0%) |
| 20 to 24 Year Olds | 194 (86.6%) | 30 (13.4%) |
| 25 to 34 Year Olds | 61 (35.3%) | 112 (64.7%) |
| 35 Years and over | 161 (94.7%) | 9 (5.3%) |
| Total | 2,768 (82.5%) | 587 (17.5%) |
Educational Attainment by Field of Study in Midlothian
Business (376 | 18.4%), science & technology (290 | 14.2%), education (268 | 13.1%), bio, nature & agricultural (211 | 10.3%), and arts & humanities (170 | 8.3%) are the most common fields of study among 2,039 individuals in Midlothian who have obtained a bachelor's degree or higher.
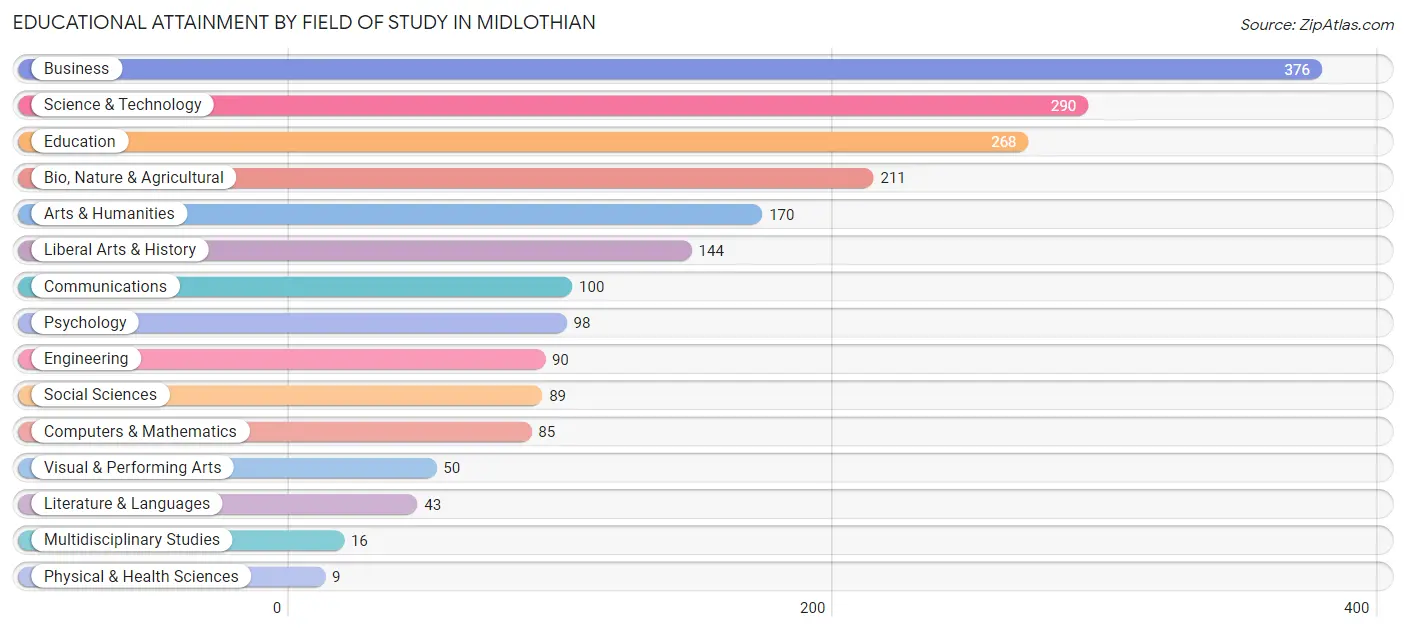
| Field of Study | # Graduates | % Graduates |
| Computers & Mathematics | 85 | 4.2% |
| Bio, Nature & Agricultural | 211 | 10.3% |
| Physical & Health Sciences | 9 | 0.4% |
| Psychology | 98 | 4.8% |
| Social Sciences | 89 | 4.4% |
| Engineering | 90 | 4.4% |
| Multidisciplinary Studies | 16 | 0.8% |
| Science & Technology | 290 | 14.2% |
| Business | 376 | 18.4% |
| Education | 268 | 13.1% |
| Literature & Languages | 43 | 2.1% |
| Liberal Arts & History | 144 | 7.1% |
| Visual & Performing Arts | 50 | 2.5% |
| Communications | 100 | 4.9% |
| Arts & Humanities | 170 | 8.3% |
| Total | 2,039 | 100.0% |
Transportation & Commute in Midlothian
Vehicle Availability by Sex in Midlothian
The most prevalent vehicle ownership categories in Midlothian are males with 2 vehicles (1,701, accounting for 49.7%) and females with 2 vehicles (1,286, making up 55.1%).
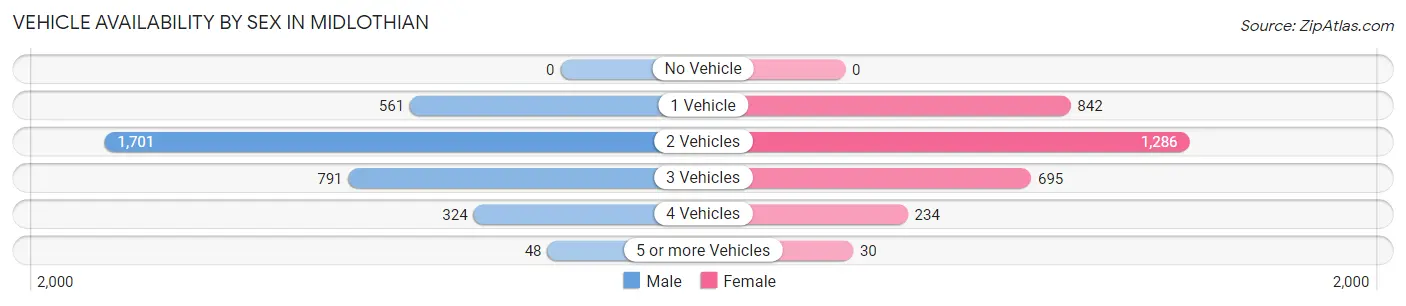
| Vehicles Available | Male | Female |
| No Vehicle | 0 (0.0%) | 0 (0.0%) |
| 1 Vehicle | 561 (16.4%) | 842 (27.3%) |
| 2 Vehicles | 1,701 (49.7%) | 1,286 (41.7%) |
| 3 Vehicles | 791 (23.1%) | 695 (22.5%) |
| 4 Vehicles | 324 (9.5%) | 234 (7.6%) |
| 5 or more Vehicles | 48 (1.4%) | 30 (1.0%) |
| Total | 3,425 (100.0%) | 3,087 (100.0%) |
Commute Time in Midlothian
The most frequently occuring commute durations in Midlothian are 15 to 19 minutes (868 commuters, 14.6%), 20 to 24 minutes (811 commuters, 13.6%), and 30 to 34 minutes (802 commuters, 13.5%).
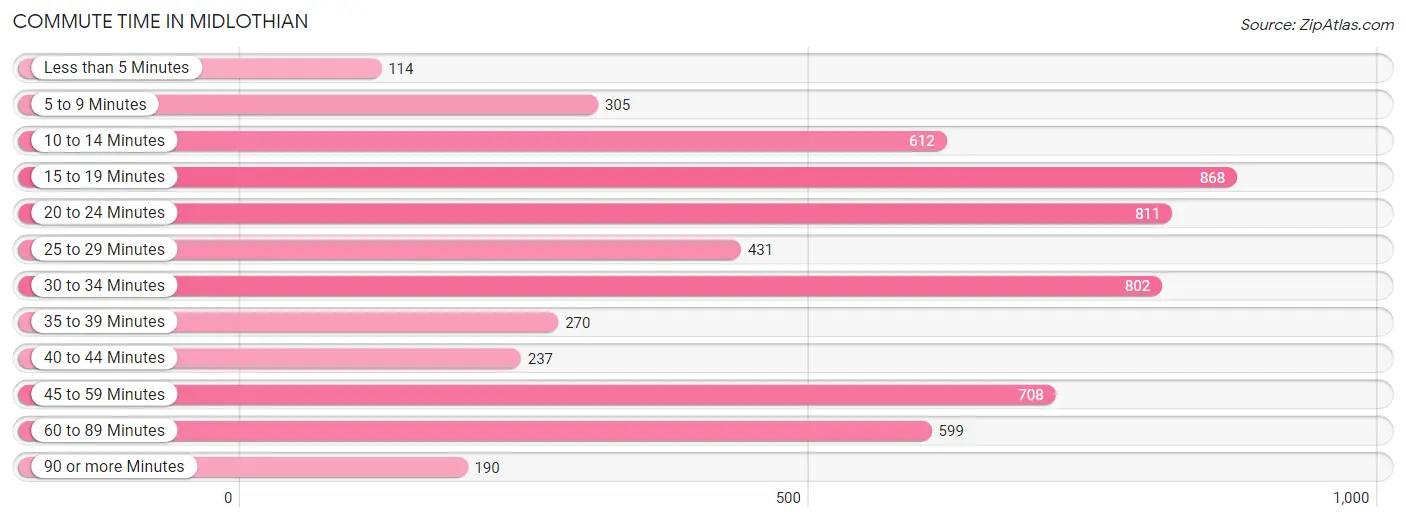
| Commute Time | # Commuters | % Commuters |
| Less than 5 Minutes | 114 | 1.9% |
| 5 to 9 Minutes | 305 | 5.1% |
| 10 to 14 Minutes | 612 | 10.3% |
| 15 to 19 Minutes | 868 | 14.6% |
| 20 to 24 Minutes | 811 | 13.6% |
| 25 to 29 Minutes | 431 | 7.2% |
| 30 to 34 Minutes | 802 | 13.5% |
| 35 to 39 Minutes | 270 | 4.5% |
| 40 to 44 Minutes | 237 | 4.0% |
| 45 to 59 Minutes | 708 | 11.9% |
| 60 to 89 Minutes | 599 | 10.1% |
| 90 or more Minutes | 190 | 3.2% |
Commute Time by Sex in Midlothian
The most common commute times in Midlothian are 45 to 59 minutes (555 commuters, 17.6%) for males and 15 to 19 minutes (573 commuters, 20.5%) for females.
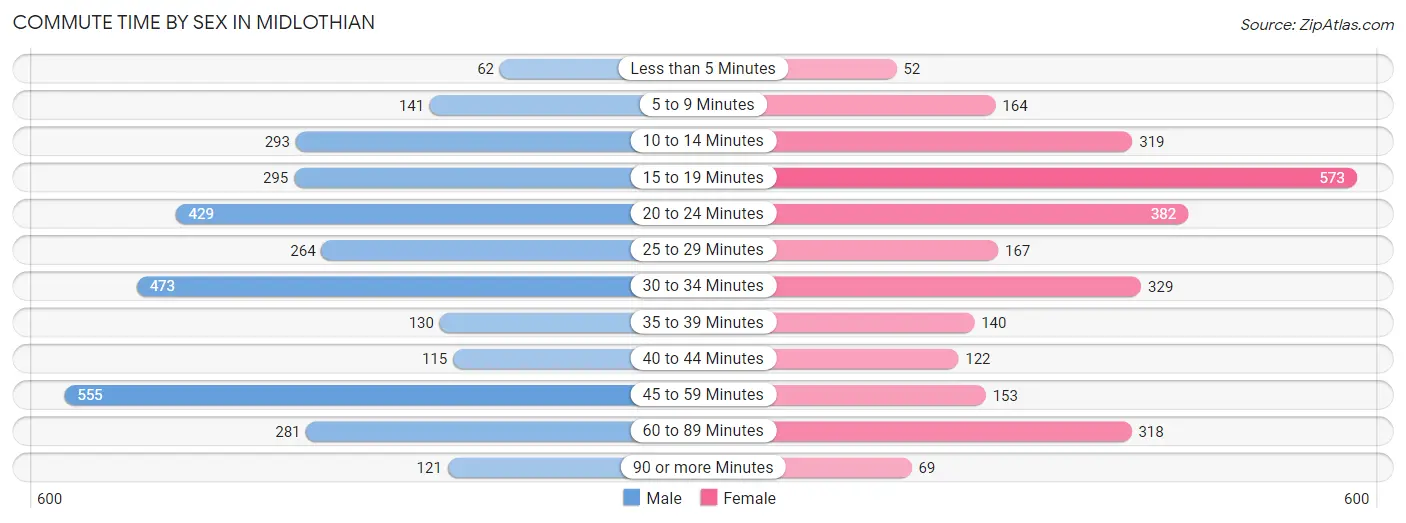
| Commute Time | Male | Female |
| Less than 5 Minutes | 62 (2.0%) | 52 (1.9%) |
| 5 to 9 Minutes | 141 (4.5%) | 164 (5.9%) |
| 10 to 14 Minutes | 293 (9.3%) | 319 (11.4%) |
| 15 to 19 Minutes | 295 (9.3%) | 573 (20.5%) |
| 20 to 24 Minutes | 429 (13.6%) | 382 (13.7%) |
| 25 to 29 Minutes | 264 (8.4%) | 167 (6.0%) |
| 30 to 34 Minutes | 473 (15.0%) | 329 (11.8%) |
| 35 to 39 Minutes | 130 (4.1%) | 140 (5.0%) |
| 40 to 44 Minutes | 115 (3.6%) | 122 (4.4%) |
| 45 to 59 Minutes | 555 (17.6%) | 153 (5.5%) |
| 60 to 89 Minutes | 281 (8.9%) | 318 (11.4%) |
| 90 or more Minutes | 121 (3.8%) | 69 (2.5%) |
Time of Departure to Work by Sex in Midlothian
The most frequent times of departure to work in Midlothian are 7:00 AM to 7:29 AM (432, 13.7%) for males and 7:00 AM to 7:29 AM (585, 21.0%) for females.
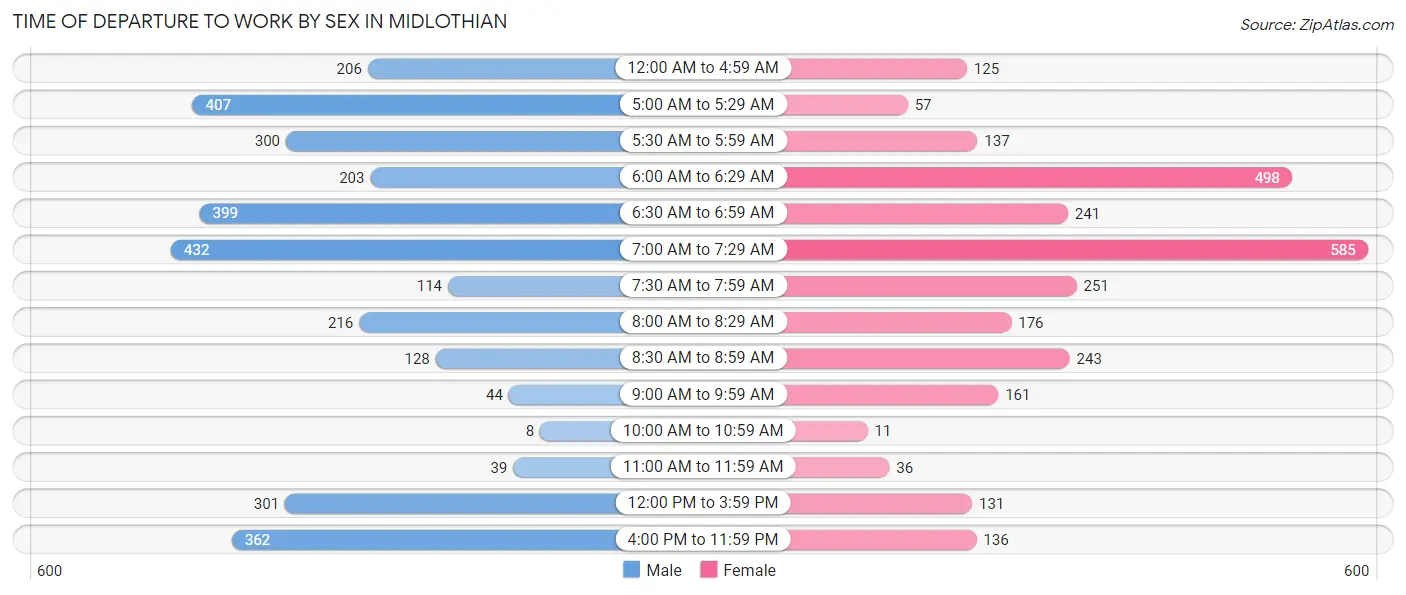
| Time of Departure | Male | Female |
| 12:00 AM to 4:59 AM | 206 (6.5%) | 125 (4.5%) |
| 5:00 AM to 5:29 AM | 407 (12.9%) | 57 (2.0%) |
| 5:30 AM to 5:59 AM | 300 (9.5%) | 137 (4.9%) |
| 6:00 AM to 6:29 AM | 203 (6.4%) | 498 (17.9%) |
| 6:30 AM to 6:59 AM | 399 (12.6%) | 241 (8.6%) |
| 7:00 AM to 7:29 AM | 432 (13.7%) | 585 (21.0%) |
| 7:30 AM to 7:59 AM | 114 (3.6%) | 251 (9.0%) |
| 8:00 AM to 8:29 AM | 216 (6.8%) | 176 (6.3%) |
| 8:30 AM to 8:59 AM | 128 (4.1%) | 243 (8.7%) |
| 9:00 AM to 9:59 AM | 44 (1.4%) | 161 (5.8%) |
| 10:00 AM to 10:59 AM | 8 (0.3%) | 11 (0.4%) |
| 11:00 AM to 11:59 AM | 39 (1.2%) | 36 (1.3%) |
| 12:00 PM to 3:59 PM | 301 (9.5%) | 131 (4.7%) |
| 4:00 PM to 11:59 PM | 362 (11.5%) | 136 (4.9%) |
| Total | 3,159 (100.0%) | 2,788 (100.0%) |
Housing Occupancy in Midlothian
Occupancy by Ownership in Midlothian
Of the total 5,747 dwellings in Midlothian, owner-occupied units account for 4,425 (77.0%), while renter-occupied units make up 1,322 (23.0%).
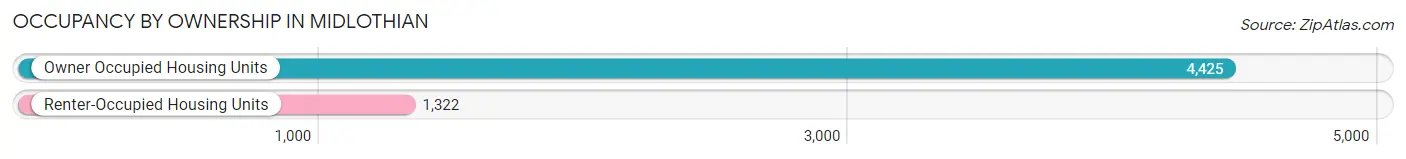
| Occupancy | # Housing Units | % Housing Units |
| Owner Occupied Housing Units | 4,425 | 77.0% |
| Renter-Occupied Housing Units | 1,322 | 23.0% |
| Total Occupied Housing Units | 5,747 | 100.0% |
Occupancy by Household Size in Midlothian
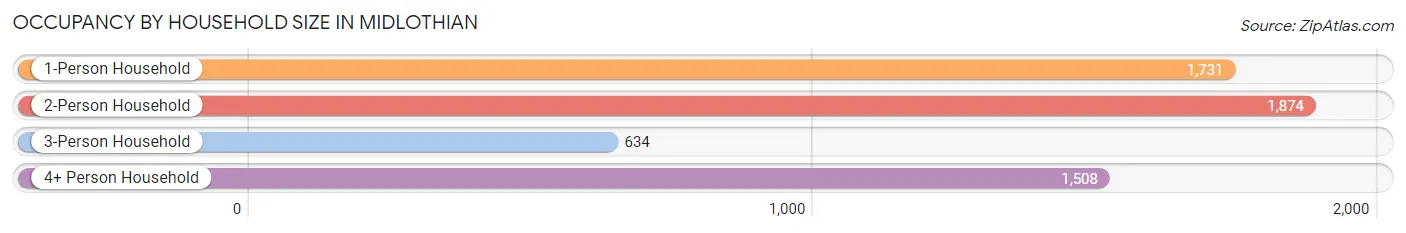
| Household Size | # Housing Units | % Housing Units |
| 1-Person Household | 1,731 | 30.1% |
| 2-Person Household | 1,874 | 32.6% |
| 3-Person Household | 634 | 11.0% |
| 4+ Person Household | 1,508 | 26.2% |
| Total Housing Units | 5,747 | 100.0% |
Occupancy by Ownership by Household Size in Midlothian
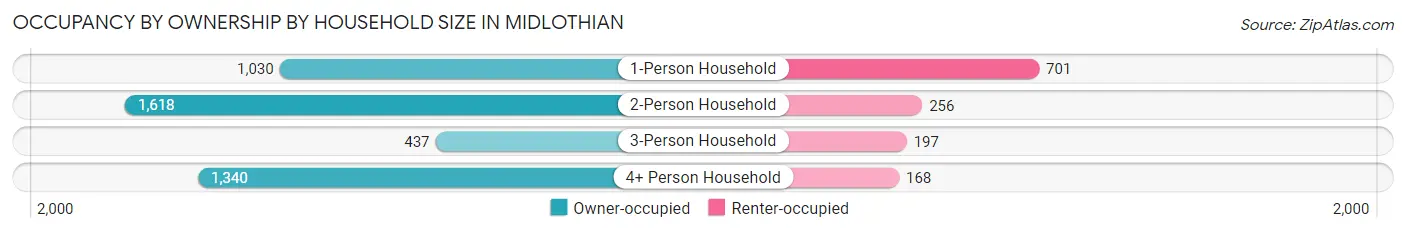
| Household Size | Owner-occupied | Renter-occupied |
| 1-Person Household | 1,030 (59.5%) | 701 (40.5%) |
| 2-Person Household | 1,618 (86.3%) | 256 (13.7%) |
| 3-Person Household | 437 (68.9%) | 197 (31.1%) |
| 4+ Person Household | 1,340 (88.9%) | 168 (11.1%) |
| Total Housing Units | 4,425 (77.0%) | 1,322 (23.0%) |
Occupancy by Educational Attainment in Midlothian
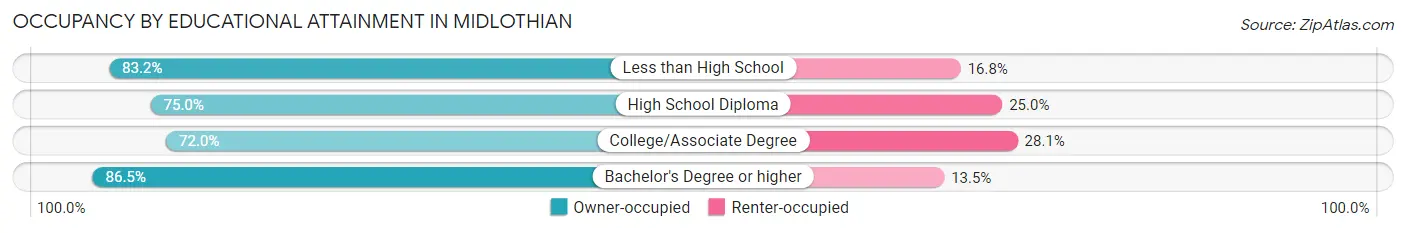
| Household Size | Owner-occupied | Renter-occupied |
| Less than High School | 467 (83.2%) | 94 (16.8%) |
| High School Diploma | 1,378 (75.0%) | 459 (25.0%) |
| College/Associate Degree | 1,567 (72.0%) | 611 (28.1%) |
| Bachelor's Degree or higher | 1,013 (86.5%) | 158 (13.5%) |
Occupancy by Age of Householder in Midlothian
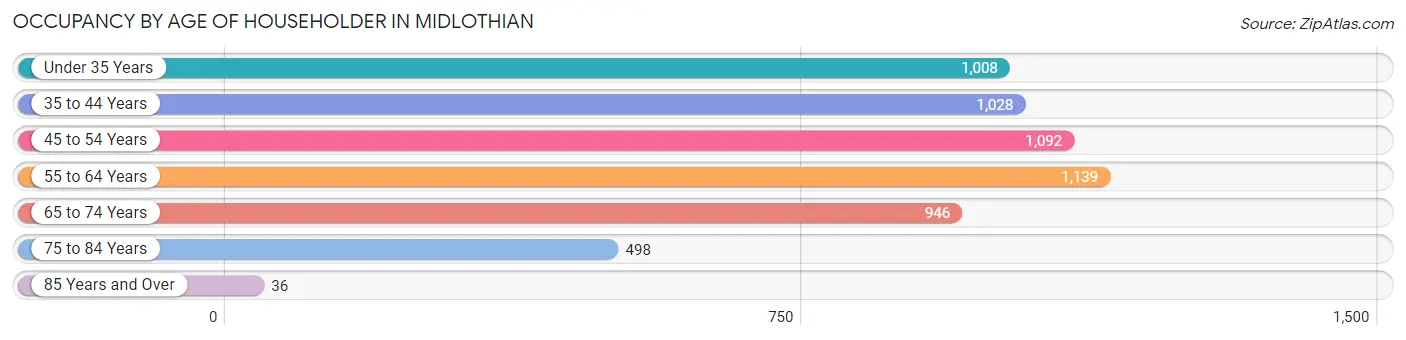
| Age Bracket | # Households | % Households |
| Under 35 Years | 1,008 | 17.5% |
| 35 to 44 Years | 1,028 | 17.9% |
| 45 to 54 Years | 1,092 | 19.0% |
| 55 to 64 Years | 1,139 | 19.8% |
| 65 to 74 Years | 946 | 16.5% |
| 75 to 84 Years | 498 | 8.7% |
| 85 Years and Over | 36 | 0.6% |
| Total | 5,747 | 100.0% |
Housing Finances in Midlothian
Median Income by Occupancy in Midlothian
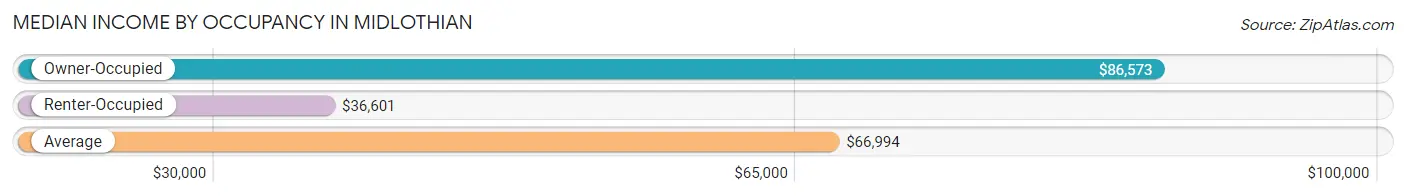
| Occupancy Type | # Households | Median Income |
| Owner-Occupied | 4,425 (77.0%) | $86,573 |
| Renter-Occupied | 1,322 (23.0%) | $36,601 |
| Average | 5,747 (100.0%) | $66,994 |
Occupancy by Householder Income Bracket in Midlothian
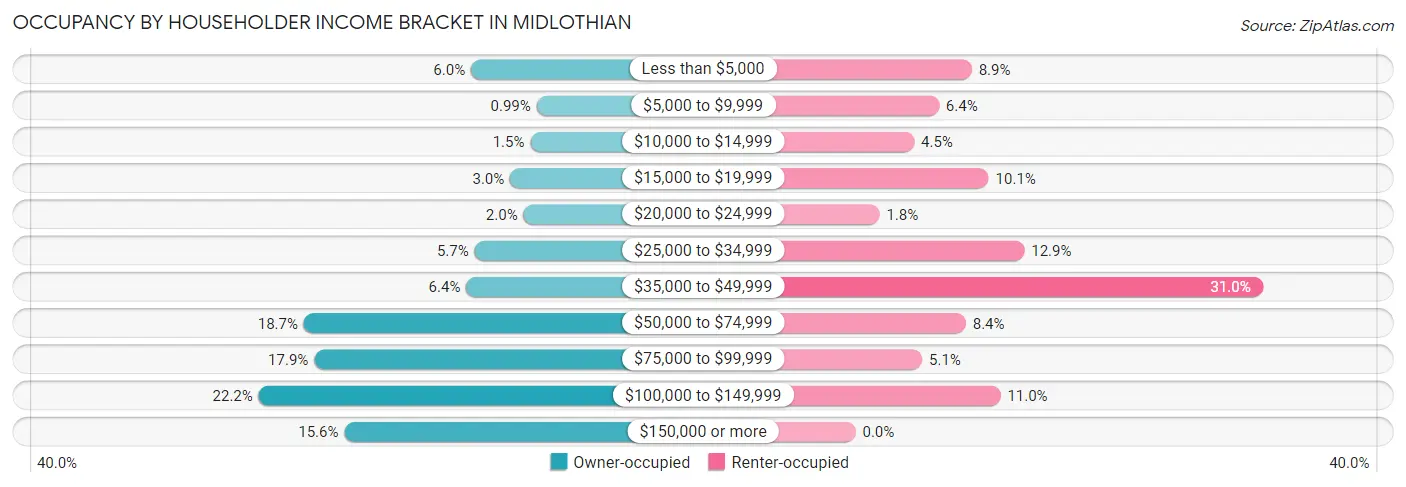
| Income Bracket | Owner-occupied | Renter-occupied |
| Less than $5,000 | 265 (6.0%) | 117 (8.8%) |
| $5,000 to $9,999 | 44 (1.0%) | 84 (6.4%) |
| $10,000 to $14,999 | 65 (1.5%) | 59 (4.5%) |
| $15,000 to $19,999 | 133 (3.0%) | 134 (10.1%) |
| $20,000 to $24,999 | 88 (2.0%) | 24 (1.8%) |
| $25,000 to $34,999 | 253 (5.7%) | 170 (12.9%) |
| $35,000 to $49,999 | 281 (6.4%) | 410 (31.0%) |
| $50,000 to $74,999 | 829 (18.7%) | 111 (8.4%) |
| $75,000 to $99,999 | 794 (17.9%) | 67 (5.1%) |
| $100,000 to $149,999 | 981 (22.2%) | 146 (11.0%) |
| $150,000 or more | 692 (15.6%) | 0 (0.0%) |
| Total | 4,425 (100.0%) | 1,322 (100.0%) |
Monthly Housing Cost Tiers in Midlothian
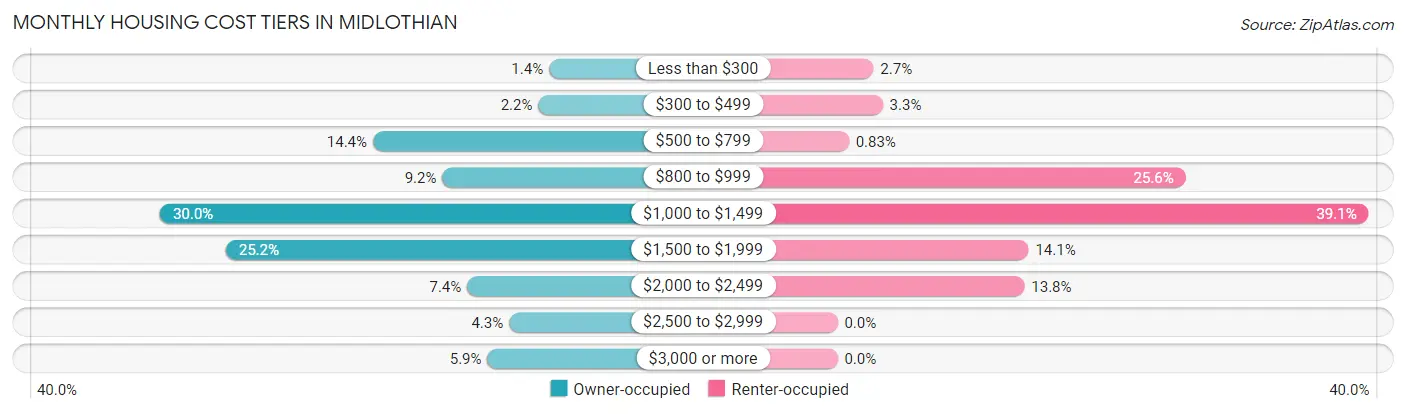
| Monthly Cost | Owner-occupied | Renter-occupied |
| Less than $300 | 61 (1.4%) | 35 (2.6%) |
| $300 to $499 | 96 (2.2%) | 44 (3.3%) |
| $500 to $799 | 635 (14.3%) | 11 (0.8%) |
| $800 to $999 | 409 (9.2%) | 339 (25.6%) |
| $1,000 to $1,499 | 1,329 (30.0%) | 517 (39.1%) |
| $1,500 to $1,999 | 1,114 (25.2%) | 186 (14.1%) |
| $2,000 to $2,499 | 328 (7.4%) | 182 (13.8%) |
| $2,500 to $2,999 | 191 (4.3%) | 0 (0.0%) |
| $3,000 or more | 262 (5.9%) | 0 (0.0%) |
| Total | 4,425 (100.0%) | 1,322 (100.0%) |
Physical Housing Characteristics in Midlothian
Housing Structures in Midlothian
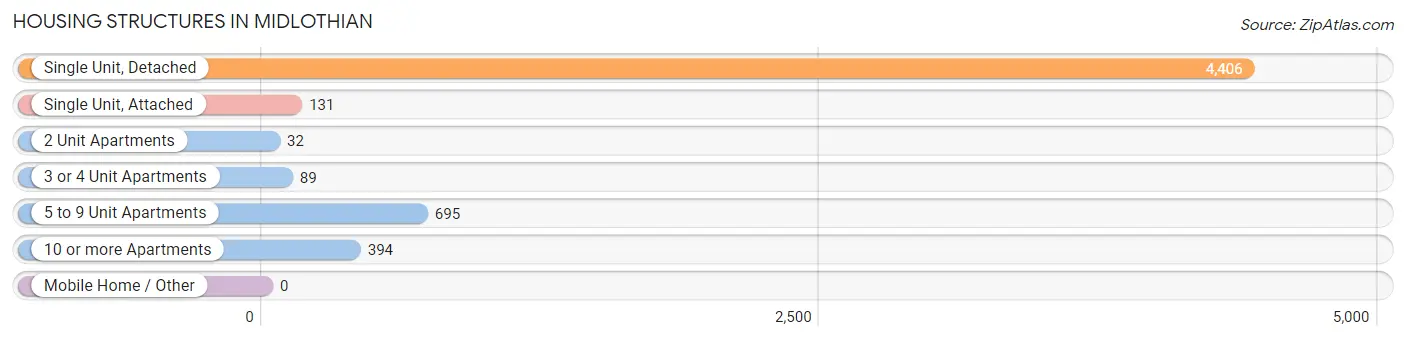
| Structure Type | # Housing Units | % Housing Units |
| Single Unit, Detached | 4,406 | 76.7% |
| Single Unit, Attached | 131 | 2.3% |
| 2 Unit Apartments | 32 | 0.6% |
| 3 or 4 Unit Apartments | 89 | 1.5% |
| 5 to 9 Unit Apartments | 695 | 12.1% |
| 10 or more Apartments | 394 | 6.9% |
| Mobile Home / Other | 0 | 0.0% |
| Total | 5,747 | 100.0% |
Housing Structures by Occupancy in Midlothian
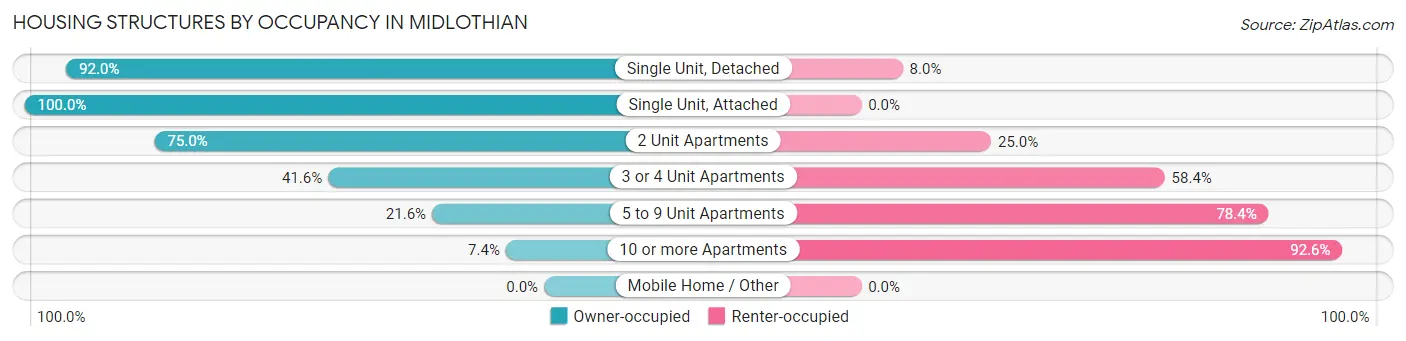
| Structure Type | Owner-occupied | Renter-occupied |
| Single Unit, Detached | 4,054 (92.0%) | 352 (8.0%) |
| Single Unit, Attached | 131 (100.0%) | 0 (0.0%) |
| 2 Unit Apartments | 24 (75.0%) | 8 (25.0%) |
| 3 or 4 Unit Apartments | 37 (41.6%) | 52 (58.4%) |
| 5 to 9 Unit Apartments | 150 (21.6%) | 545 (78.4%) |
| 10 or more Apartments | 29 (7.4%) | 365 (92.6%) |
| Mobile Home / Other | 0 (0.0%) | 0 (0.0%) |
| Total | 4,425 (77.0%) | 1,322 (23.0%) |
Housing Structures by Number of Rooms in Midlothian
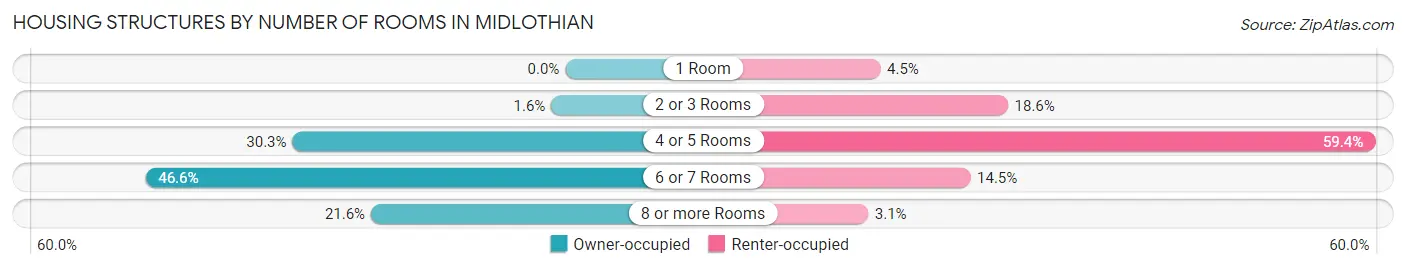
| Number of Rooms | Owner-occupied | Renter-occupied |
| 1 Room | 0 (0.0%) | 59 (4.5%) |
| 2 or 3 Rooms | 69 (1.6%) | 246 (18.6%) |
| 4 or 5 Rooms | 1,340 (30.3%) | 785 (59.4%) |
| 6 or 7 Rooms | 2,062 (46.6%) | 191 (14.4%) |
| 8 or more Rooms | 954 (21.6%) | 41 (3.1%) |
| Total | 4,425 (100.0%) | 1,322 (100.0%) |
Housing Structure by Heating Type in Midlothian
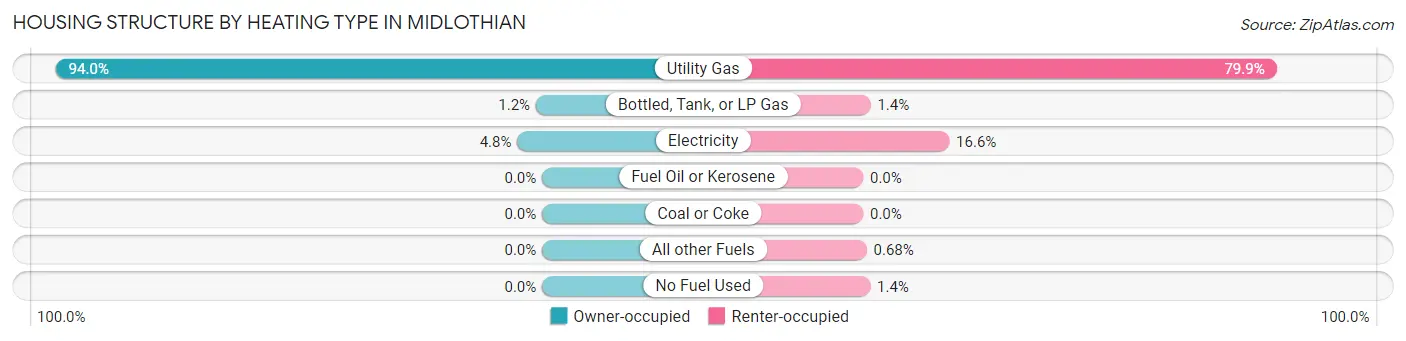
| Heating Type | Owner-occupied | Renter-occupied |
| Utility Gas | 4,160 (94.0%) | 1,056 (79.9%) |
| Bottled, Tank, or LP Gas | 53 (1.2%) | 19 (1.4%) |
| Electricity | 212 (4.8%) | 220 (16.6%) |
| Fuel Oil or Kerosene | 0 (0.0%) | 0 (0.0%) |
| Coal or Coke | 0 (0.0%) | 0 (0.0%) |
| All other Fuels | 0 (0.0%) | 9 (0.7%) |
| No Fuel Used | 0 (0.0%) | 18 (1.4%) |
| Total | 4,425 (100.0%) | 1,322 (100.0%) |
Household Vehicle Usage in Midlothian
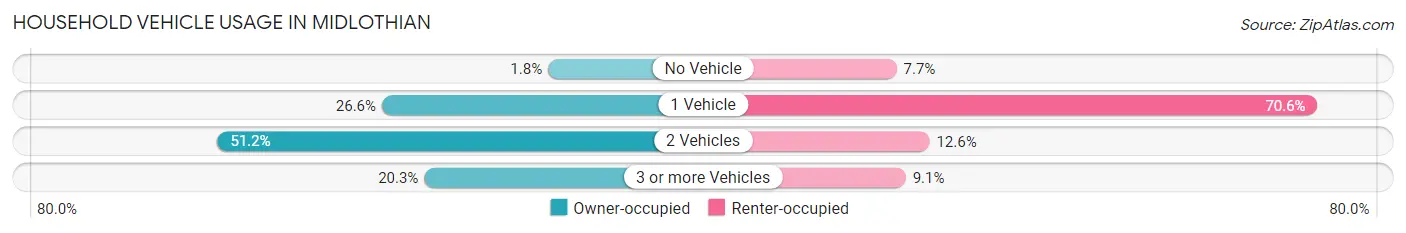
| Vehicles per Household | Owner-occupied | Renter-occupied |
| No Vehicle | 81 (1.8%) | 102 (7.7%) |
| 1 Vehicle | 1,179 (26.6%) | 933 (70.6%) |
| 2 Vehicles | 2,266 (51.2%) | 167 (12.6%) |
| 3 or more Vehicles | 899 (20.3%) | 120 (9.1%) |
| Total | 4,425 (100.0%) | 1,322 (100.0%) |
Real Estate & Mortgages in Midlothian
Real Estate and Mortgage Overview in Midlothian
| Characteristic | Without Mortgage | With Mortgage |
| Housing Units | 1,525 | 2,900 |
| Median Property Value | $168,100 | $193,600 |
| Median Household Income | $54,457 | $443 |
| Monthly Housing Costs | $822 | $236 |
| Real Estate Taxes | $5,154 | $13 |
Property Value by Mortgage Status in Midlothian
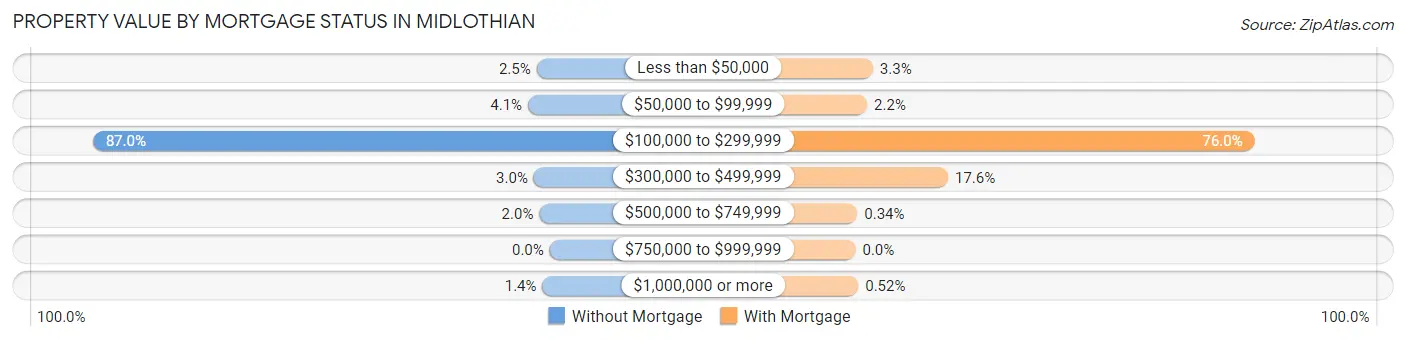
| Property Value | Without Mortgage | With Mortgage |
| Less than $50,000 | 38 (2.5%) | 96 (3.3%) |
| $50,000 to $99,999 | 63 (4.1%) | 64 (2.2%) |
| $100,000 to $299,999 | 1,327 (87.0%) | 2,204 (76.0%) |
| $300,000 to $499,999 | 46 (3.0%) | 511 (17.6%) |
| $500,000 to $749,999 | 30 (2.0%) | 10 (0.3%) |
| $750,000 to $999,999 | 0 (0.0%) | 0 (0.0%) |
| $1,000,000 or more | 21 (1.4%) | 15 (0.5%) |
| Total | 1,525 (100.0%) | 2,900 (100.0%) |
Household Income by Mortgage Status in Midlothian
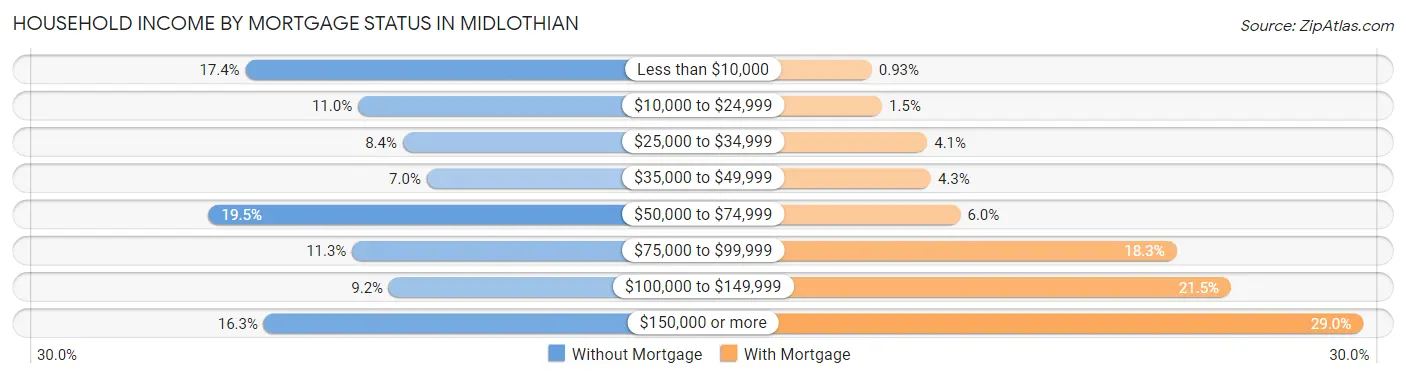
| Household Income | Without Mortgage | With Mortgage |
| Less than $10,000 | 265 (17.4%) | 27 (0.9%) |
| $10,000 to $24,999 | 167 (11.0%) | 44 (1.5%) |
| $25,000 to $34,999 | 128 (8.4%) | 119 (4.1%) |
| $35,000 to $49,999 | 107 (7.0%) | 125 (4.3%) |
| $50,000 to $74,999 | 297 (19.5%) | 174 (6.0%) |
| $75,000 to $99,999 | 172 (11.3%) | 532 (18.3%) |
| $100,000 to $149,999 | 140 (9.2%) | 622 (21.4%) |
| $150,000 or more | 249 (16.3%) | 841 (29.0%) |
| Total | 1,525 (100.0%) | 2,900 (100.0%) |
Property Value to Household Income Ratio in Midlothian
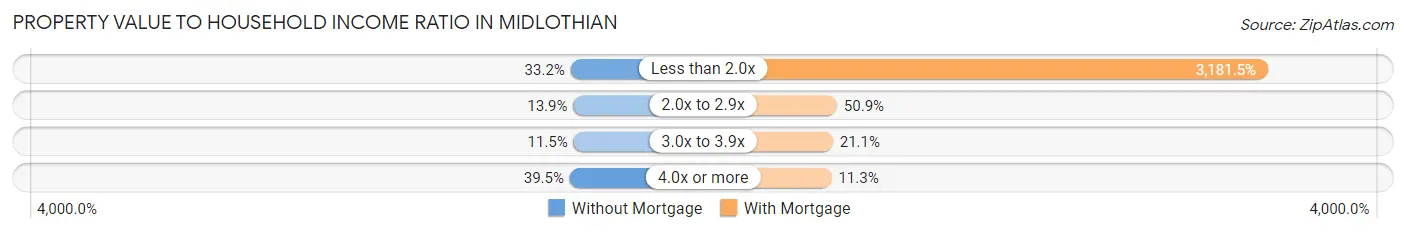
| Value-to-Income Ratio | Without Mortgage | With Mortgage |
| Less than 2.0x | 506 (33.2%) | 92,262 (3,181.4%) |
| 2.0x to 2.9x | 212 (13.9%) | 1,476 (50.9%) |
| 3.0x to 3.9x | 176 (11.5%) | 613 (21.1%) |
| 4.0x or more | 603 (39.5%) | 329 (11.3%) |
| Total | 1,525 (100.0%) | 2,900 (100.0%) |
Real Estate Taxes by Mortgage Status in Midlothian
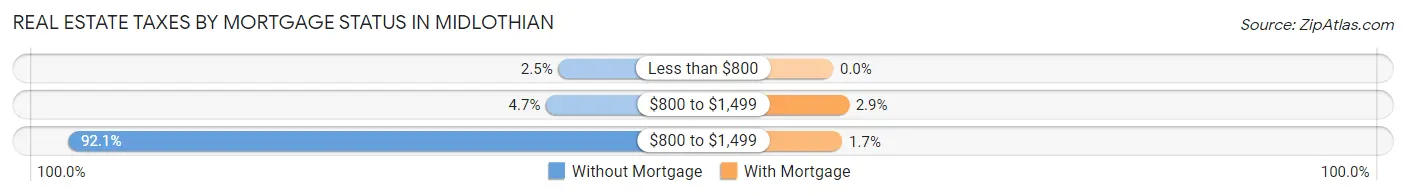
| Property Taxes | Without Mortgage | With Mortgage |
| Less than $800 | 38 (2.5%) | 0 (0.0%) |
| $800 to $1,499 | 72 (4.7%) | 83 (2.9%) |
| $800 to $1,499 | 1,404 (92.1%) | 48 (1.7%) |
| Total | 1,525 (100.0%) | 2,900 (100.0%) |
Health & Disability in Midlothian
Health Insurance Coverage by Age in Midlothian
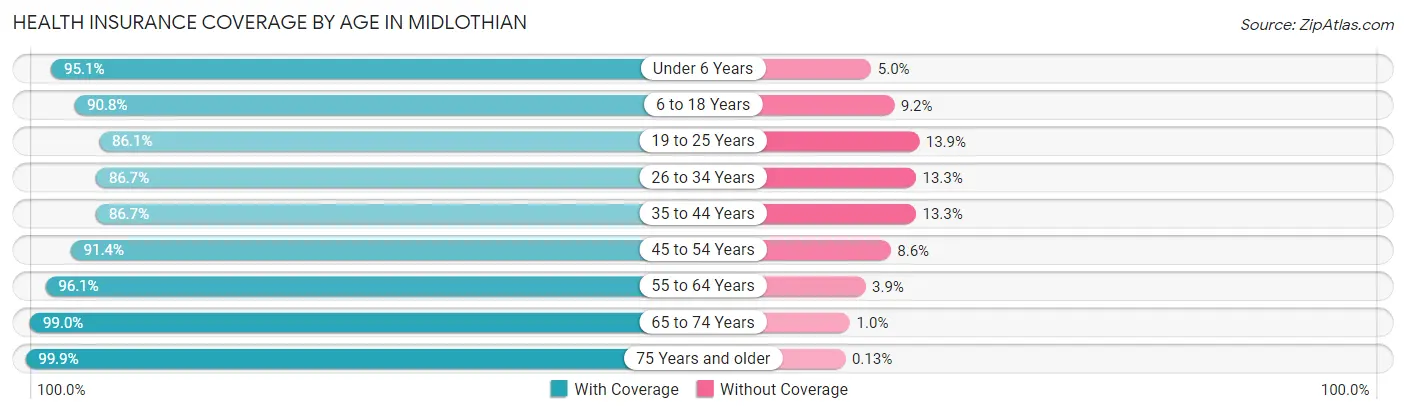
| Age Bracket | With Coverage | Without Coverage |
| Under 6 Years | 787 (95.1%) | 41 (5.0%) |
| 6 to 18 Years | 2,408 (90.8%) | 245 (9.2%) |
| 19 to 25 Years | 812 (86.1%) | 131 (13.9%) |
| 26 to 34 Years | 1,500 (86.7%) | 230 (13.3%) |
| 35 to 44 Years | 1,762 (86.7%) | 270 (13.3%) |
| 45 to 54 Years | 1,649 (91.4%) | 155 (8.6%) |
| 55 to 64 Years | 1,909 (96.1%) | 77 (3.9%) |
| 65 to 74 Years | 1,380 (99.0%) | 14 (1.0%) |
| 75 Years and older | 742 (99.9%) | 1 (0.1%) |
| Total | 12,949 (91.7%) | 1,164 (8.3%) |
Health Insurance Coverage by Citizenship Status in Midlothian
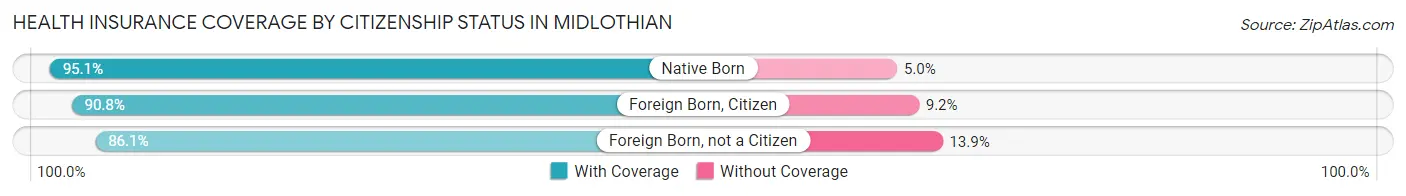
| Citizenship Status | With Coverage | Without Coverage |
| Native Born | 787 (95.1%) | 41 (5.0%) |
| Foreign Born, Citizen | 2,408 (90.8%) | 245 (9.2%) |
| Foreign Born, not a Citizen | 812 (86.1%) | 131 (13.9%) |
Health Insurance Coverage by Household Income in Midlothian
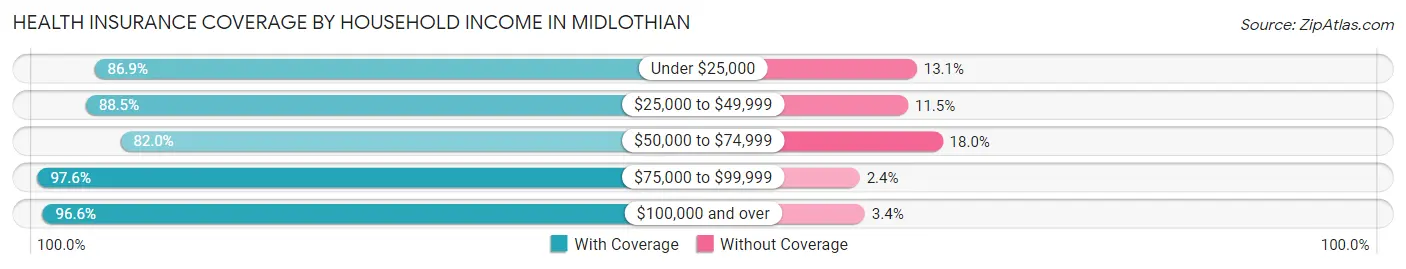
| Household Income | With Coverage | Without Coverage |
| Under $25,000 | 1,398 (86.9%) | 211 (13.1%) |
| $25,000 to $49,999 | 1,706 (88.5%) | 221 (11.5%) |
| $50,000 to $74,999 | 2,206 (82.0%) | 483 (18.0%) |
| $75,000 to $99,999 | 2,136 (97.6%) | 53 (2.4%) |
| $100,000 and over | 5,501 (96.6%) | 193 (3.4%) |
Public vs Private Health Insurance Coverage by Age in Midlothian
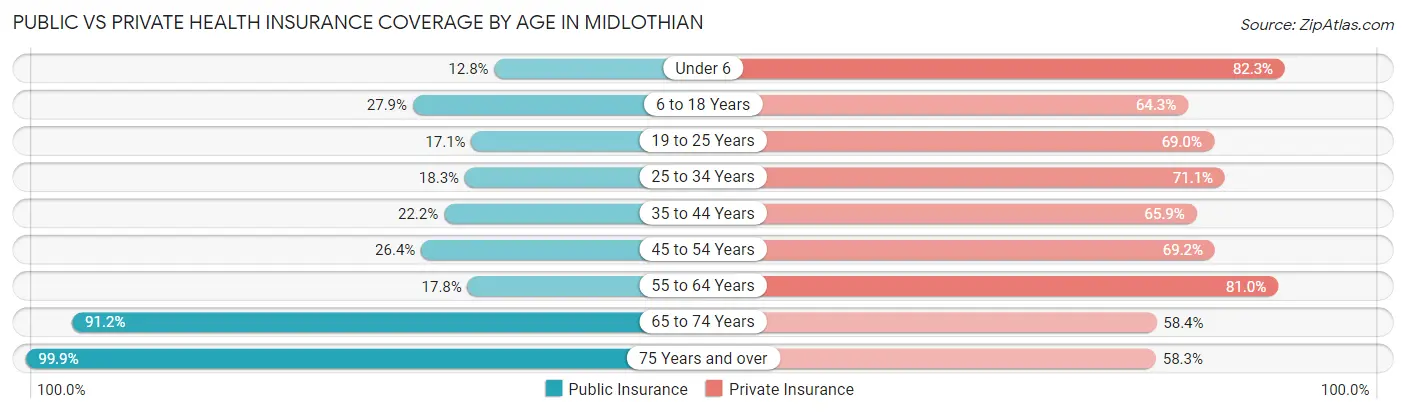
| Age Bracket | Public Insurance | Private Insurance |
| Under 6 | 106 (12.8%) | 681 (82.3%) |
| 6 to 18 Years | 741 (27.9%) | 1,705 (64.3%) |
| 19 to 25 Years | 161 (17.1%) | 651 (69.0%) |
| 25 to 34 Years | 316 (18.3%) | 1,230 (71.1%) |
| 35 to 44 Years | 450 (22.2%) | 1,338 (65.8%) |
| 45 to 54 Years | 476 (26.4%) | 1,249 (69.2%) |
| 55 to 64 Years | 353 (17.8%) | 1,608 (81.0%) |
| 65 to 74 Years | 1,271 (91.2%) | 814 (58.4%) |
| 75 Years and over | 742 (99.9%) | 433 (58.3%) |
| Total | 4,616 (32.7%) | 9,709 (68.8%) |
Disability Status by Sex by Age in Midlothian
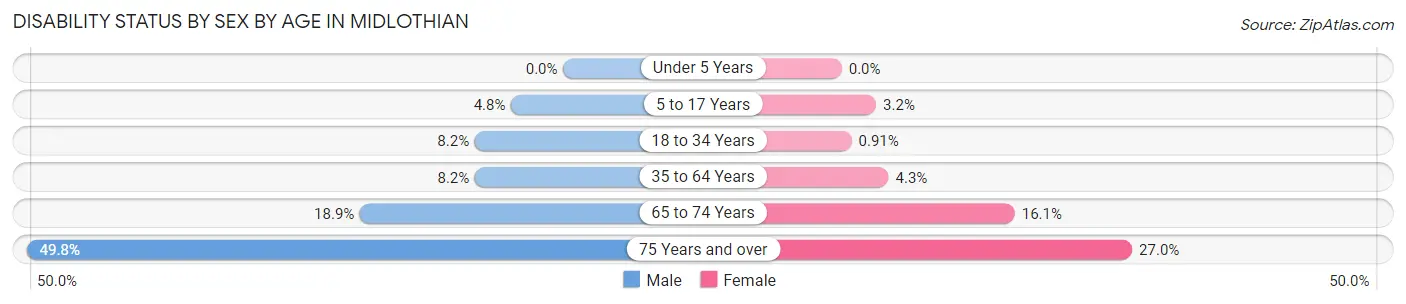
| Age Bracket | Male | Female |
| Under 5 Years | 0 (0.0%) | 0 (0.0%) |
| 5 to 17 Years | 66 (4.8%) | 39 (3.2%) |
| 18 to 34 Years | 96 (8.2%) | 15 (0.9%) |
| 35 to 64 Years | 252 (8.2%) | 119 (4.3%) |
| 65 to 74 Years | 149 (18.9%) | 97 (16.1%) |
| 75 Years and over | 128 (49.8%) | 131 (27.0%) |
Disability Class by Sex by Age in Midlothian
Disability Class: Hearing Difficulty
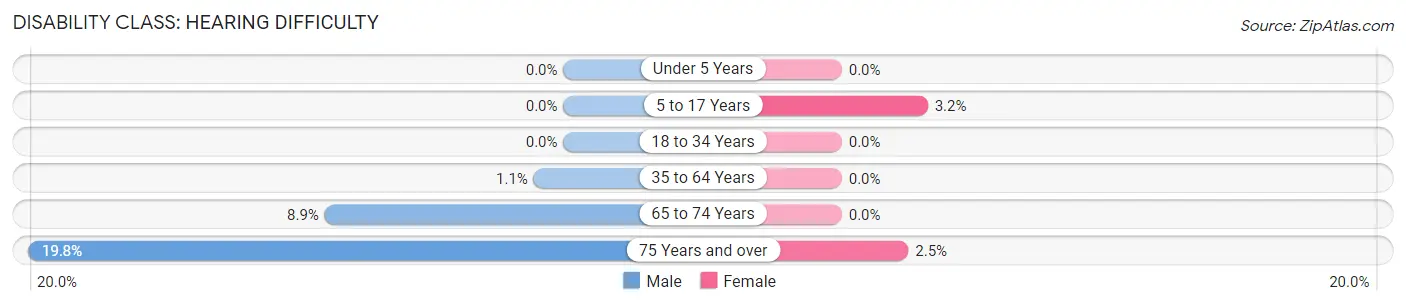
| Age Bracket | Male | Female |
| Under 5 Years | 0 (0.0%) | 0 (0.0%) |
| 5 to 17 Years | 0 (0.0%) | 39 (3.2%) |
| 18 to 34 Years | 0 (0.0%) | 0 (0.0%) |
| 35 to 64 Years | 34 (1.1%) | 0 (0.0%) |
| 65 to 74 Years | 70 (8.9%) | 0 (0.0%) |
| 75 Years and over | 51 (19.8%) | 12 (2.5%) |
Disability Class: Vision Difficulty
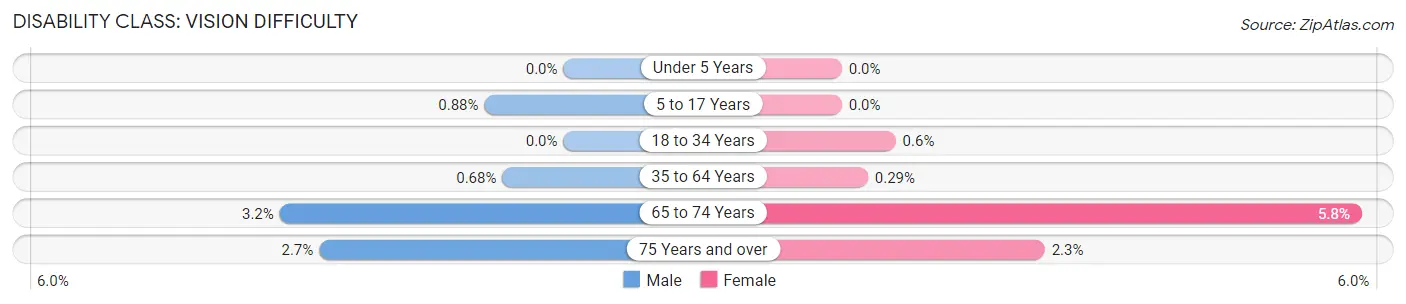
| Age Bracket | Male | Female |
| Under 5 Years | 0 (0.0%) | 0 (0.0%) |
| 5 to 17 Years | 12 (0.9%) | 0 (0.0%) |
| 18 to 34 Years | 0 (0.0%) | 10 (0.6%) |
| 35 to 64 Years | 21 (0.7%) | 8 (0.3%) |
| 65 to 74 Years | 25 (3.2%) | 35 (5.8%) |
| 75 Years and over | 7 (2.7%) | 11 (2.3%) |
Disability Class: Cognitive Difficulty
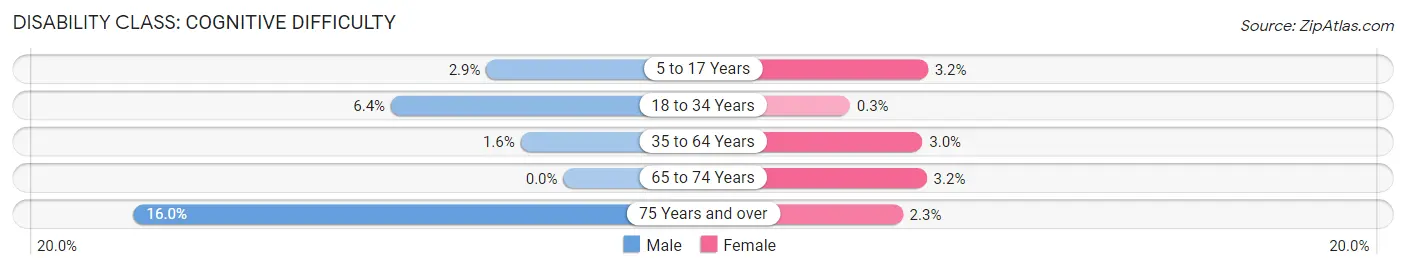
| Age Bracket | Male | Female |
| 5 to 17 Years | 39 (2.9%) | 39 (3.2%) |
| 18 to 34 Years | 75 (6.4%) | 5 (0.3%) |
| 35 to 64 Years | 49 (1.6%) | 82 (3.0%) |
| 65 to 74 Years | 0 (0.0%) | 19 (3.2%) |
| 75 Years and over | 41 (16.0%) | 11 (2.3%) |
Disability Class: Ambulatory Difficulty
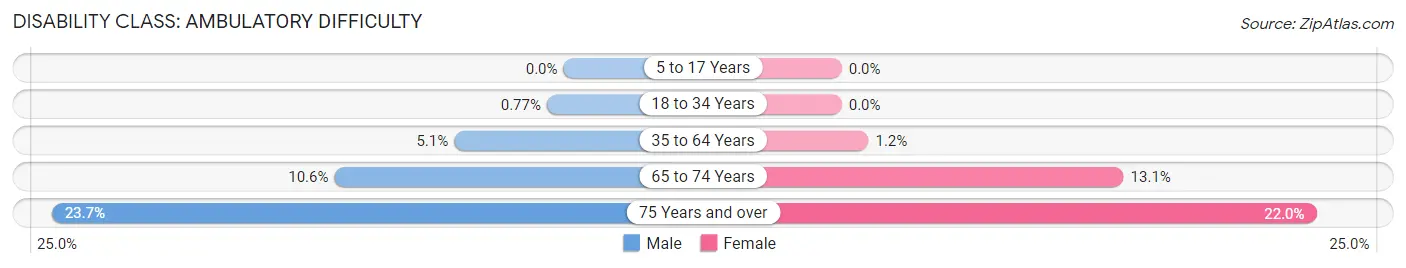
| Age Bracket | Male | Female |
| 5 to 17 Years | 0 (0.0%) | 0 (0.0%) |
| 18 to 34 Years | 9 (0.8%) | 0 (0.0%) |
| 35 to 64 Years | 156 (5.1%) | 34 (1.2%) |
| 65 to 74 Years | 84 (10.6%) | 79 (13.1%) |
| 75 Years and over | 61 (23.7%) | 107 (22.0%) |
Disability Class: Self-Care Difficulty
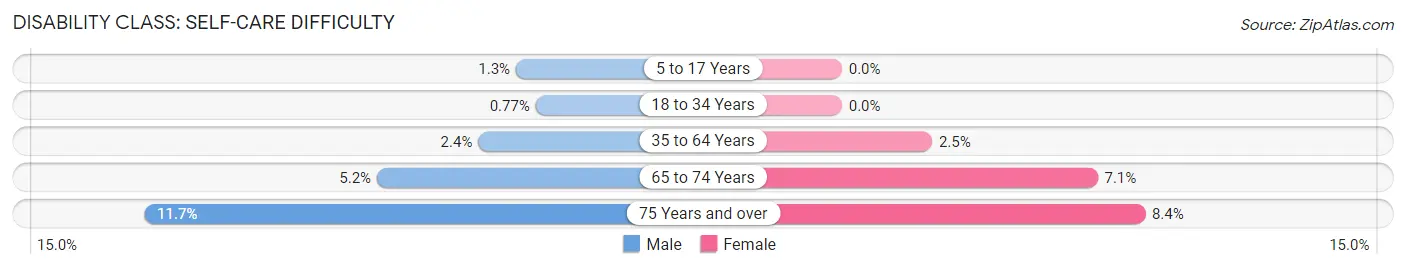
| Age Bracket | Male | Female |
| 5 to 17 Years | 18 (1.3%) | 0 (0.0%) |
| 18 to 34 Years | 9 (0.8%) | 0 (0.0%) |
| 35 to 64 Years | 73 (2.4%) | 69 (2.5%) |
| 65 to 74 Years | 41 (5.2%) | 43 (7.1%) |
| 75 Years and over | 30 (11.7%) | 41 (8.4%) |
Technology Access in Midlothian
Computing Device Access in Midlothian
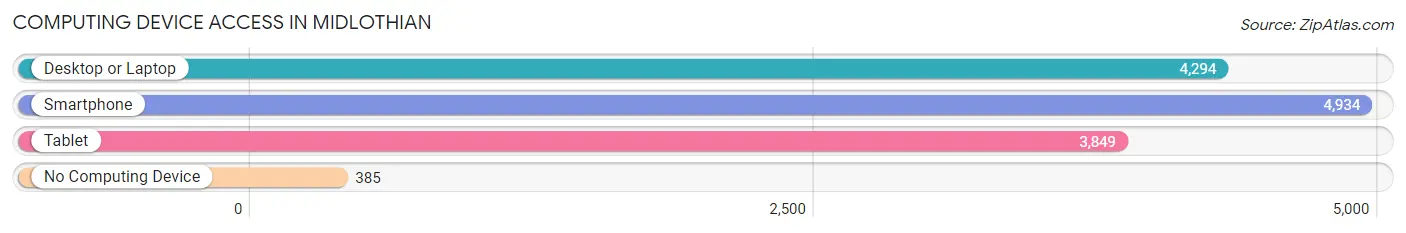
| Device Type | # Households | % Households |
| Desktop or Laptop | 4,294 | 74.7% |
| Smartphone | 4,934 | 85.9% |
| Tablet | 3,849 | 67.0% |
| No Computing Device | 385 | 6.7% |
| Total | 5,747 | 100.0% |
Internet Access in Midlothian
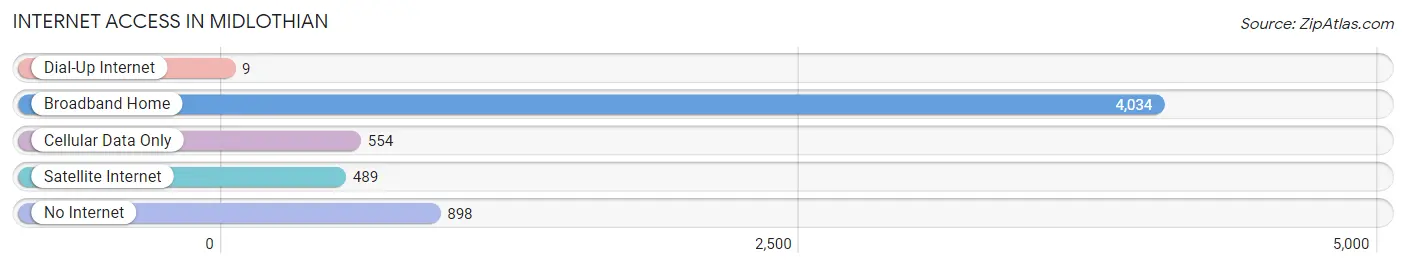
| Internet Type | # Households | % Households |
| Dial-Up Internet | 9 | 0.2% |
| Broadband Home | 4,034 | 70.2% |
| Cellular Data Only | 554 | 9.6% |
| Satellite Internet | 489 | 8.5% |
| No Internet | 898 | 15.6% |
| Total | 5,747 | 100.0% |
Midlothian Summary
Midlothian, Illinois is a village located in Cook County, Illinois, United States. It is a suburb of Chicago, located approximately 25 miles southwest of the city. The population of Midlothian was 14,919 at the 2010 census.
History
Midlothian was first settled in the early 1800s by Scottish immigrants. The village was originally known as “Midlothian Station” and was named after the Midlothian region of Scotland. The village was officially incorporated in 1869.
In the late 1800s, Midlothian was a major coal mining center. The village was home to several coal mines, including the Midlothian Coal Company, which was founded in 1882. The coal mines provided employment for many of the village’s residents.
In the early 1900s, Midlothian began to transition away from its coal mining roots. The village began to attract new businesses and industries, including a steel mill, a brickyard, and a paper mill.
Geography
Midlothian is located in northeastern Illinois, approximately 25 miles southwest of Chicago. The village is situated in the southern portion of Cook County, near the border with Will County.
The village is bordered by the villages of Oak Forest to the north, Markham to the east, Posen to the south, and Robbins to the west. The village is also bordered by the Calumet River to the east and the Little Calumet River to the west.
The village has a total area of 4 2 square miles all of which is land
Economy
Midlothian’s economy is largely based on manufacturing and retail. The village is home to several large manufacturing companies, including the Midlothian Steel Company, the Midlothian Brick Company, and the Midlothian Paper Company.
The village is also home to several retail stores, including a Walmart Supercenter, a Target, and a Lowe’s Home Improvement store.
Demographics
As of the 2010 census, the population of Midlothian was 14,919. The racial makeup of the village was 79.2% White, 11.2% African American, 0.3% Native American, 1.7% Asian, and 6.6% from other races. Hispanic or Latino of any race were 11.7% of the population.
The median household income in Midlothian was $54,945, and the median family income was $63,945. The per capita income was $25,945. About 8.2% of families and 10.2% of the population were below the poverty line.
Conclusion
Midlothian, Illinois is a village located in Cook County, Illinois, approximately 25 miles southwest of Chicago. The village was first settled in the early 1800s by Scottish immigrants and was officially incorporated in 1869. Midlothian’s economy is largely based on manufacturing and retail, and the village is home to several large manufacturing companies and retail stores. As of the 2010 census, the population of Midlothian was 14,919. The median household income in Midlothian was $54,945, and the median family income was $63,945.
Common Questions
What is Per Capita Income in Midlothian?
Per Capita income in Midlothian is $33,393.
What is the Median Family Income in Midlothian?
Median Family Income in Midlothian is $90,703.
What is the Median Household income in Midlothian?
Median Household Income in Midlothian is $66,994.
What is Income or Wage Gap in Midlothian?
Income or Wage Gap in Midlothian is 28.9%.
Women in Midlothian earn 71.1 cents for every dollar earned by a man.
What is Inequality or Gini Index in Midlothian?
Inequality or Gini Index in Midlothian is 0.42.
What is the Total Population of Midlothian?
Total Population of Midlothian is 14,200.
What is the Total Male Population of Midlothian?
Total Male Population of Midlothian is 7,113.
What is the Total Female Population of Midlothian?
Total Female Population of Midlothian is 7,087.
What is the Ratio of Males per 100 Females in Midlothian?
There are 100.37 Males per 100 Females in Midlothian.
What is the Ratio of Females per 100 Males in Midlothian?
There are 99.63 Females per 100 Males in Midlothian.
What is the Median Population Age in Midlothian?
Median Population Age in Midlothian is 39.0 Years.
What is the Average Family Size in Midlothian
Average Family Size in Midlothian is 3.0 People.
What is the Average Household Size in Midlothian
Average Household Size in Midlothian is 2.5 People.
How Large is the Labor Force in Midlothian?
There are 7,159 People in the Labor Forcein in Midlothian.
What is the Percentage of People in the Labor Force in Midlothian?
64.0% of People are in the Labor Force in Midlothian.
What is the Unemployment Rate in Midlothian?
Unemployment Rate in Midlothian is 5.4%.